

Abstract
The human apical sodium-dependent bile acid transporter (hASBT) may serve as a prodrug target for oral drug absorption. Synthetic, biological, NMR and computational approaches identified the structure-activity relationships of mono- and dianionic bile acid conjugates for hASBT binding. Experimental data combined with a conformationally-sampled pharmacophore/QSAR modeling approach (CSP-SAR) predicted that dianionic substituents with intramolecular hydrogen bonding between hydroxyls on the cholane skeleton and the acid group on the conjugate's aromatic ring increased conjugate hydrophobicity and improved binding affinity. Notably, the model predicted the presence of a conformational molecular switch, where shifting the carboxylate substituent on an aromatic ring by a single position controlled binding affinity. Model validation was performed by effectively shifting the spatial location of the carboxylate by inserting a methylene adjacent to the aromatic ring, resulting in the predicted alteration in binding affinity. This work illustrates conformation as a determinant of ligand binding affinity to a biological transporter.
Introduction
Human apical sodium-dependent bile acid transporter (hASBT) is a member of the solute carrier genetic superfamily and is expressed at high levels in the terminal ileum of the small intestine. It plays a key physiological role in the active intestinal re-absorption of bile acids. With the bile acid pool circulating 6-10 times each day, 20-30g of bile acid are taken up via hASBT daily. Due to its high transport efficiency and capacity, hASBT is an attractive target for prodrug delivery.1 Previously, acyclovir bioavailability was increased several fold by conjugating acyclovir to chenodeoxycholic acid (CDCA) via a valine linker at the bile acid's C-24 position.2 Inhibition of hASBT is also an approach to treat hypercholesterolemia.3-5
To date, a reliable rational design for prodrugs that targets hASBT has yet to be developed. Moreover, the lack of an hASBT crystal structure hampers understanding of its structure and function at the molecular level. In particular, the contribution of the chemistry space beyond the bile acid's C-24 position to hASBT binding has not been well characterized.6, 7 We previously showed C-24 conjugation patterns impacted the interaction of native bile acids with hASBT.1 Addition of steric bulk to the C-24 position of CDCA enhanced binding. Interestingly, although native bile acids are monoanions, a single negative charge was not essential for binding to hASBT.6 Neutral and cationic conjugates exhibited potent inhibitory activity, while dianions were weak inhibitors.
To further explore the chemistry space of bile acid conjugates extending beyond C-24 region and its effect on hASBT binding, a novel series of bile acid analogs were synthesized and evaluated here for their inhibition potency. Glutamic acid CDCA amide (glu-CDCA) served as the bile acid conjugate moiety, to which various substituted anilines were coupled, yielding anilinyl conjugates of glu-CDCA. The resulting compounds were then subjected to hASBT inhibition and subsequent QSAR model development.
The conformationally sampled pharmacophore (CSP) method is a novel approach7-10 that can be combined with 3D QSAR methods (denoted CSP-SAR). CSP is well-suited for compound classes with high structural flexibility. In this method all accessible conformations for each molecule are considered during model development, thereby maximizing the probability of including the bioactive conformer of each ligand. This approach would appear particularly useful to examine the important conformational and physical features of bile acid conjugates, as these conjugates are relatively large and flexible ligands.
From the combined experimental/CSP-SAR approach, hydrogen bonding between the hydroxyl moieties on the cholane skeleton and a carboxylate beyond the bile acid C-24 region improved activity. Notably, this interaction was predicted to be highly sensitive to location of the acid substituent on the aromatic ring, effectively creating a molecular switch that controls ligand binding to hASBT. This prediction was then tested via the synthesis and evaluation of additional bile acid conjugates. The resulting validated model provides a new perspective to rationally exploit hASBT for enhanced absorption of drugs containing carboxylate moieties.
Results and Discussion
Results from synthetic efforts and hASBT inhibition experiments are presented, followed by CSP-SAR analysis and resulting inhibition models. CSP-SAR models are further classified into quantitative CSP-SAR models, and a qualitative CSP-SAR model.
Conjugate Synthesis
A total of thirty-five compounds, including 33 initial conjugates and two validation compounds, were synthesized in moderate to high yields, depending on the nature and position of the substituent group on aniline. Meta substituents with strong electron withdrawing groups were not highly reactive, leading to low yields and in some cases inability to react (e.g. trifluromethyl and ethylaminobenzoate). All conjugates (excluding 2) were synthesized using Scheme 1, where a large amount of intermediate glu-CDCA was synthesized.
Scheme 1.

Synthesis of most monoanionic and all dianionic anilinyl conjugates of glu-CDCA. (a) TEA, HBTU, HOBT, DMF, 25°C, 4h; (b) TEA, HBTU, NHS, 25°C, 4h; (c) TEA, DMF, 40°C, 12h; (d) TEA, HBTU, DMF, 40-60°C, 24h; (e) 10%Pd/C, EtOH, 1h.
Inhibition of Taurocholate Uptake
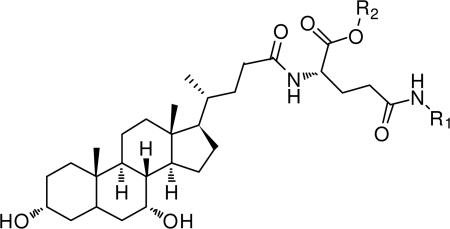
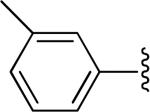
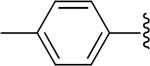
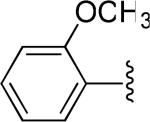
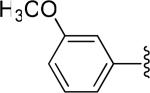
All compounds were potent inhibitors of hASBT, except for the dianions. Figure 1 illustrates inhibition of taurocholate uptake by the m-fluoro substituted anilinyl conjugate of glu-CDCA in a concentration dependent manner (Ki = 1.25 μM). Table 1 shows conjugate structures, along with their inhibition values. The table is arranged with unsubstituted aniline first, followed by mono-substituted anilines, di-substituted aniline, and then dianions. In general, most compounds showed potent binding, with no drastic effect of substituent. Bulkier groups (e.g. t-butyl) were preferred. Electron withdrawing substituents, such as flouro, chloro, and triflouromethyl, provided stronger inhibition than electron donating substituents, such as methyl and methoxy at the para position. For monoanionic conjugates, substituent position on the side chain aromatic ring did not markedly affect binding affinity. Ki values for monoanions were potent and ranged from 0.275-16.3 μM. Interestingly, 30 was a potent inhibitor, even though the charge on glutamic acid was protected by α-benzyl, such that the negative charge was distal, as compared to other monoanions 1-29. This observation is consistent with previous results where a proximal single negative charge is not required for binding.6
Figure 1.

Inhibition profile for 5, the 3-flouro substituted anilinyl conjugate of glu-CDCA.
Table 1.
Structures and Ki values of anilinyl conjugates of glu-CDCA.
 | |||||
|---|---|---|---|---|---|
| Compound | R1 | R2 | Charge | Observed Ki (μM) | Predicted Ki (μM)a |
| 1 |
|
H | -1 | 2.01±0.61 | 4.17 |
| 2 |
|
H | -1 | 1.91±0.21 | 2.13 |
| 3 |
|
H | -1 | 2.02±0.62 | 0.568 |
| 4 |
|
H | -1 | 2.31±0.29 | 3.90 |
| 5 |
|
H | -1 | 1.25±0.10 | 2.66 |
| 6 |
|
H | -1 | 3.02±0.92 | 0.902 |
| 7 |
|
H | -1 | 2.63±0.28 | 4.18 |
| 8 |
|
H | -1 | 0.889±0.122 | 3.72 |
| 9 |
|
H | -1 | 3.20±0.67 | 4.33 |
| 10 |
|
H | -1 | 3.89±0.41 | 4.63 |
| 11 |
|
H | -1 | 4.22±0.39 | 4.61 |
| 12 |
|
H | -1 | 6.09±0.66 | 4.25 |
| 13 |
|
H | -1 | 3.93±0.84 | 3.21 |
| 14 |
|
H | -1 | 0.587±0.112 | 3.38 |
| 15 |
|
H | -1 | 0.275±0.093 | 3.38 |
| 16 |
|
H | -1 | 2.30±0.50 | 3.88 |
| 17 |
|
H | -1 | 7.65±1.63 | 3.58 |
| 18 |
|
H | -1 | 4.03±1.52 | 2.80 |
| 19 |
|
H | -1 | 1.15±0.07 | 3.29 |
| 20 |
|
H | -1 | 5.16±0.69 | 2.21 |
| 21 |
|
H | -1 | 6.53±1.32 | 9.54 |
| 22 |
|
H | -1 | 5.26±1.02 | 7.28 |
| 23 |
|
H | -1 | 2.64±0.36 | 8.02 |
| 24 |
|
H | -1 | 16.3±3.6 | 11.2 |
| 25 |
|
H | -1 | 15.9±3.1 | 10.6 |
| 26 |
|
H | -1 | 3.16±0.47 | 2.30 |
| 27 |
|
H | -1 | 8.07±1.23 | 4.08 |
| 28 |
|
H | -1 | 4.30±0.50 | 2.85 |
| 29 |
|
H | -1 | 5.19±0.47 | 3.31 |
| 30 |

|
OCH2C6H5 | -1 | 2.24±0.21 | 7.36 |
| 31 |
|
H | -2 | 40.4±5.7 | 40.4 |
| 32 |
|
H | -2 | 35.9±3.5 | 35.5 |
| 33 |
|
H | -2 | 108±8 | No fit model |
| 34 |
|
H | -2 | 126±13 | No fit model |
| 35 |
|
H | -2 | 41.0±4.1 | 37.0 |
Predicted Ki values were obtained using CSP-SAR quantitative Model 1.
Substituent position had a significant impact on the affinity for dianions. Dianions 31, 32, and 35 were potent (i.e. Ki < 50 μM), while 33 and 34 were weak inhibitors (Ki values of 108 and 126 μM, respectively). Previous studies have shown dianions to be weak inhibitors of hASBT.6 The greater potency of the 2- and the 3-amino benzoic acid congeners, compared to the 4-amino benzoic acid substituent, warranted further investigation and is discussed below.
CSP-SAR hASBT Inhibition Model Development: Quantitative Model
In the absence of a crystal structure for hASBT or that of an inhibitor-transporter complex, a ligand-based drug design approach was applied.11 Conjugates 1-33 were subjected to CSP-SAR model analysis to develop an inhibition model for Ki, in part since these conjugates exhibit high molecular flexibility, for which CSP-SAR and replica-exchange MD simulations are particularly advantageous. For each conjugate, starting with the second-most potent compound 14, Table S4 lists physico-chemical descriptor values, as wells as overlap coefficients of each structural descriptor. Figure 2 identifies conjugate structural features used for pharmacophore development, as described in Experimental Section. Overlap coefficients were calculated relative to 15.
Figure 2.

Structural features in anilinyl conjugates of glu-CDCA used for pharmacophore development. Notation is as follows: O3, position of 3-OH; O7, position of 7-OH; BC, centroid of B and C rings of steroidal nucleus; C18, location of C-18; C19, location of C-19; C20, location of C-20; AA, centroid of carboxylic acid oxygens on α-acid; and GS, centroid of γ-substituent (R1).
Initially, the efforts to obtain a comprehensive CSP-SAR model for all thirty-three conjugates in Table 1 (1-33) were not successful due to insufficient validation. Molecular descriptors indicated that 33, in spite of being the weakest inhibitor in the set, possessed high structural similarity with 14 and 15, the two most potent inhibitors. Figure 3 considers the angle C18-GS-O7 and angle C19-GS-O3, and shows that the conformational distribution pattern of 33 (in green) is almost identical to 14 and 15 (in red), while the second and third weakest inhibitors (31 and 32 in blue) have a differential pattern for those two structural descriptors. All thirty-three compounds in the initial data set were monoanionic, except for 31, 32 and 33, which were dianionic. Since dianionic compounds have previously shown poor affinity towards hASBT,6 31-33 being the three weakest inhibitors was not unanticipated. However, 31 and 32 were estimated to be over 2-fold more potent than 33. These observations necessitated a more detailed evaluation of the poor potency of 33, making it difficult to include 33 in the general quantitative model. As discussed below, compound 33's low potency was qualitatively explainable by virtue of its combined dianionic nature and inability for an intramolecular hydrogen bond. Hence, 33 was subsequently excluded from the quantitative model, but included in the qualitative analysis presented below. Table S5 shows the best CSP-SAR model for compounds 1-33; although r2 = 0.837, the model failed validation due to Q2 = 0.347.
Figure 3.

Probability distributions of structural descriptors; (A) angle C18-GS-O7 and (B) angle C19-GS-O3. The red line represents the combined distribution of 14 and 15; the blue line represents the same for 31 and 32. The green line represents 33.
Quantitative modeling for compounds 1-32 was initiated using single variable regression analysis of all structural and physico-chemical descriptors with respect to Ki. Table S6 represents the results from single-variable linear regression analysis of the molecular descriptors against Ki. ΔGw and logPc showed the highest correlations with Ki. The negative coefficient of these two descriptors suggested that conjugate hydrophobic character favors hASBT inhibition (i.e., decrease in Ki). Among physico-chemical descriptors, HA ranked third in correlation with Ki. The positive coefficient of HA was consistent with ΔGw and logPc, in that HA indicated more hydrogen bond acceptors increased polar character and hence disfavored binding.
Binding affinity was dominated by conjugate physico-chemical properties. In Table S6, all conformational descriptors, except for O7-AA-C19 (r2 = 0.02) exhibited negative linear coefficient for the overlap coefficient, as expected since similarity to 15 promoted lower Ki value.
Eighty-one candidate quantitative models were identified via multivariable regression analysis. AIC analysis indicated that only one model possessed more than 5% probability of being the best model. Table 2 lists parameters for the three best fitting quantitative models. Model 1 yielded r2 = 0.914 with 95.5% probability of being the best model. Model 2 yielded r2 = 0.890 with 2.14% probability of being the best model, while Model 3 yielded r2 = 0.886 with 1.31% probability of being the best model. Figure 4 plots predicted versus observed Ki from Model 1. From leave-one-out validation, Q2 = 0.888, indicating the robustness of Model 1. Models 2 and 3 also yielded a high Q2 of 0.861 and 0.855, respectively. Regression plots for Model 2 and Model 3 are shown in Figure S1.
Table 2.
Results from multivariable regression analysis and modified Akaike Information Criterion (AICC) for the selected CSP-SAR models.a,b
| CSP-SAR Models | r2 | Q2 | F | Wi | K (μM) | A (μM/kcal/mol) | B | Standardized A (μM) | Standardized B |
|---|---|---|---|---|---|---|---|---|---|
| 1) ΔGw, HD | 0.914 | 0.888 | 148 | 0.955 | -45.9 ± 6.1 | -0.365 ± 0.021 | 5.29 ± 1.4 (μM) | -0.950 | 0.215 (μM) |
| 2) ΔGw, PSAside | 0.890 | 0.861 | 113 | 0.021 | -31.9 ± 4.2 | -0.342 ± 0.025 | 0.0505 ± 0.021 (μM/Å2) | -0.890 | 0.154 (μM/Å2) |
| 3) ΔGw, PSA | 0.886 | 0.855 | 109 | 0.0131 | -34.8 ± 5.8 | -0.348 ± 0.025 | 0.0457 ± 0.022 (μM/Å2) | -0.904 | 0.138 (μM/Å2) |
Parameters include free energy of solvation for each compound in water (ΔGw), number of hydrogen bond donors (HD), polar surface area (PSA), and PSA exclusively for the region beyond C-24 of the bile acid conjugates (PSAside).
A and B represent the coefficient of the independent variables (molecular descriptors); K represents the coefficient of the intercept.
Figure 4.

Regression plot for predicted vs. observed Ki values for anilinyl conjugates of glu-CDCA using CSP-SAR Model 1.
Model 1 comprised of the physico-chemical descriptors ΔGw and HD. As with the single variable regression analysis results, the negative coefficient of ΔGw and the positive coefficient of HD indicate hydrophobicity facilitated binding. Model 2 included ΔGw, PSAside; Model 3 consisted of ΔGw and PSA. Consistent with Model 1, ΔGw yielded a negative coefficient and both PSAside and PSA yielded positive coefficients in Model 2 and Model 3, demonstrating that hydrophobicity improved affinity. The standardized coefficients of the descriptors suggested that ΔGw had the highest impact on binding affinity.
It should be noted that a model based on log transformed data (i.e. pKi rather than Ki) provided inferior models (Q2 < 0.6) than those above for Ki. Table S7 lists parameters for the two best fitting quantitative models for pKi. Figure S2 plots predicted versus observed pKi for these models. Reasons for these models to be inferior are that log transformed data represents an order-of-magnitude focused analysis, but observed Ki data ranges only 147-fold, which is less than three orders-of-magnitude. Additionally, 31 and 32 are notably less potent than other compounds (about 2-fold less).
CSP-SAR hASBT Inhibition Model Development: Qualitative Model
Qualitative analysis was undertaken to include the non-potent conjugate 33 in the analysis, as quantitative models were developed without 33. Since 33 is a dianion, analysis focused on the three dianionic compounds 31, 32 and 33 and their probability distributions for various pharmacophore distances and angles. Figure 5 shows the probability distributions for O7-GSmin and O3-GSmin. The distribution for the potent conjugate 31 showed high probabilities for conformers with short distances of O3-GSmin (< 3 Å). Similarly, the distribution of O7-GSmin for the other potent dianionic conjugate, 32, displayed a high probability at distances less than 3 Å. Meanwhile, non-potent compound 33 did not sample short distances. These structural descriptors reflect intramolecular hydrogen bonding between the γ-substituent and the cholane hydroxyls for 31 and 32, leading to improved binding as compared to 33.
Figure 5.

Probability distribution of O3-GSmin and O7-GSmin for conjugates 15, 31, 32 and 33. The maximum probability of O7-GSmin for 32 was 0.213.
These intramolecular hydrogen bonds promoted hydrophobicity, consistent with the quantitative CSP-SAR. Figure 6 depicts the distances between carboxylate group on the γ-substituent (GA) and the hydroxyls against ΔGw and logPc. In panels A-D, short γ acid-hydroxyl distances correlated with ΔGw and log P for both 31 and 32. For these two potent inhibitors, conformers with short distances exhibited higher ΔGw and logPc values. These findings illustrate that the conformers of dianionic conjugates with intramolecular hydrogen bonding exhibit greater hydrophobicity, which promotes hASBT binding, as per the quantitative CSP-SAR models (Table 2).
Figure 6.

Dependence of ΔGw and logPc on distance between the 3-OH and carboxylate group on the aromatic ring (O3-GA) for 31 (A and B); between 7-OH and carboxylate group on the aromatic ring (O7-GA) for 32 (C and D); and between carboxylate group on the aromatic ring and 3-OH (E and F) and 7-OH (G and H) for 33.
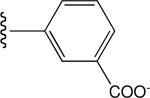
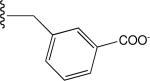
Meanwhile, in panels E-H of Figure 6, no conformers with short distance interactions were observed for 33; consequently there was no significant elevation in the hydrophobicity of 33. Visual analysis of the compact conformations of 31 and 32, as well as various conformations of 33, indicated that the para-position of the acid group in 33 disfavored sampling of the conformation for hASBT binding. Figure 7 depicts representative conformers of 31, 32 and 33. The intramolecular hydrogen bond between the γ acid and a steroidal hydroxyl is evident in each 31 and 32, but not in 33. What is most remarkable about the differences in biological and conformational characteristics of 31 and 32 versus 33 is that the conjugates only differ in the location of the carboxylate group on the aromatic ring of the γ-substituent (Table 1); 31, 32, and 33 are ortho, meta and para, respectively. These results suggest that the location of the acid group acts as a “molecular switch” to allow for hydrogen bonding with the cholane hydroxyls, leading to conformations where the acid is “concealed”, thereby affording hydrophobicity.
Figure 7.

Representative conformers of 31, 32 and 33, illustrating the intramolecular hydrogen bond in 31 and 32, but not in 33.
CSP-SAR hASBT Inhibition Model Development: Qualitative Model Validation
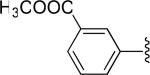
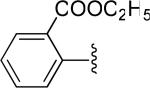
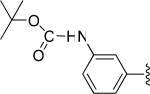
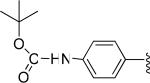
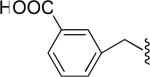
In order to challenge our molecular switch hypothesis, two additional conjugates were synthesized. Conjugate 35 was devised to have high affinity by effectively shifting the para location of the carboxylate on low-activity 33 to an “effective-meta” position relative to the remainder of the conjugate, thereby mimicking the location of the carboxylate in 32. This switch was performed by inserting a methylene between the aromatic ring and the remainder of the conjugate in 33 yielding 35. Table 3 presents a schematic representation of the shift of the carboxylate from the para position in 33 to the “effective-meta” position in 35, though the aromatic ring is still formally para substituted. The structural change from 33 to 35 is predicted to allow for the necessary intramolecular hydrogen bonding needed for dianion high affinity binding.
Table 3.
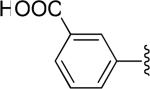
Tabulated approximate orientation of the carboxylate at para (33 and 35) and meta (32 and 34) positions associated with the insertion of an additional methylene group between the aromatic ring and the remainder of the bile acid conjugate.
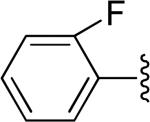
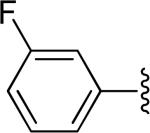
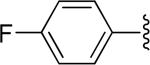
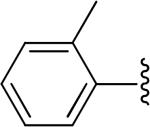
| Compound Number | Relative Orientation | Affinity (switch on or off) |
|---|---|---|
| 33 |
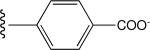
|
Low (off) |
| 35 |
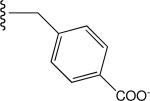
|
Predicted High (on) |
| 32 |
|
High (on) |
| 34 |
|
Predicted Low (off) |
Additionally, a second conjugate was designed as a negative control, where the molecular switch was applied to abolish intramolecular hydrogen bonding. Conjugate 34was designed to have low affinity by shifting the location of the meta carboxylate in high affinity 32 to an “effective-para” position by again introducing a methylene bridge adjacent to the aromatic ring to produce 34. Table 3 schematically shows how the introduction of the methylene into 32 shifts the meta substituent to an “effective-para” position in 34, even though the ring is still formally meta substituted. Conjugate 34 was predicted to not undergo intramolecular hydrogen bonding, as the molecular switch was designed to be turned off.
Conjugates 34 and 35 were initially subjected to in silico analysis via MD simulations as part of the CSP-SAR methodology. Figure 8 shows the dependence of ΔGw and logPc on the distance between 7-OH and carboxylate group on the aromatic ring (O3-GA) for 34 and 35. Relative to 32, the addition of the methylene bridge in 34 disrupted the intramolecular hydrogen bonding that favors hASBT binding; in essence, the molecular switch was turned off. In comparing Figure 8 (panels A and B) for 34 to Figure 6 (panels C and D) for 32, loss of intramolecular hydrogen bonding yielded no conformer with enhanced hydrophobicity. Meanwhile, in comparing Figure 8 (panels C and D) for 35 to Figure 6 (panels G and H) for 33, short-distance conformations with enhanced hydrophobicity were observed when the switch was turned on. The CSP-SAR binding affinity from quantitative model 1 for 35 was 39.6 μM. The model predicts 34 to be a weak inhibitor, as 34 did not exhibit conformational distributions that were associated with potent Ki.
Figure 8.

Dependence of ΔGw and logPc on distance between 7-OH and carboxylate group on the γ-substituent (O7-GA) for (A-B) 34 and (C-D) 35.
Conjugates 34 and 35 were then synthesized and subjected to hASBT inhibition. In agreement with the predictions, observed Ki values for 34 and 35 were 126 M and 41.0 M, respectively (Table 1). The CSP-SAR method and the experimental data demonstrate that intramolecular hydrogen bond plays a critical role in the binding potency of dianionic conjugates of glu-CDCA. This hydrogen bond acted as a molecular switch to control the binding of such compounds with hASBT. Therefore, according to our model, and in contrast to the present knowledge, dianionic conjugates of bile acids can possess potent binding affinity if they attain sufficient hydrophobicity via specific intramolecular hydrogen bonding. Additionally, the previously reported poor activity of glu-CDCA dianion6 is in agreement with the evaluation here that glu-CDCA is hydrophilic and is not able to benefit from a molecular switch, due to the location of the carboxylate group on the aromatic ring of the γ-substituent.
Conformational analysis via NMR
The 1D proton, 1D carbon, and COSY spectra of 32 in D2O-phosphate were almost identical to corresponding spectra in D2O, such that chemical shift assignment of 32 in D2O-phosphate were applied to spectra in D2O (Table S8). Table 4 represents the pairs of protons on the carbon atoms in 32 and 33 that showed peaks in 1D NOE. As shown in Table 4, 1D steady-state NOE experiments of 32 indicated that 4 sec irradiation of protons on C31 (7.84 ppm) and C35 (7.72 ppm) resulted in NOE enhancement of protons on methyls C18 (0.5 ppm), C19 (0.8 ppm), and C21 (0.84 ppm) of the cholane skeleton. Table 4 also lists the percentage of MD conformers that satisfy NMR data. For example, 33.0% of 32's conformers showed a short distance (less than 6Å) between protons on C-35 and C-18. Irradiation of the aromatic protons on C33 and C34 did not yield any notable NOE enhancements. The reciprocal proton irradiations of C18 (0.50 ppm) and C21 (0.84 ppm) caused enhancement of the aromatic proton on C31 (7.84 ppm). In contrast, for 33, irradiation of protons on C31, C32, C34 and C35 produced no long-range enhancements; short-range enhancements, such as those to immediate neighbors, were only very weak. Likewise, irradiation on all three methyl groups on 33 resulted only in very weak short-range enhancements.
Table 4.
Observed NOE enhancements from NMR studies and calculated shortest proton-proton distances from MD simulations. Interacting proton pairs between aromatic carbons and cholane moiety were identified from 1D NOE spectra. NMR and MD simulations indicate 32 exhibited compact conformations, while 33 was extended.
| Compound Number | Proton Irradiateda | Observed NOE Enhancement from NMR studiesa | Shortest Distance from MD Simulations (Å) | Percent of MD conformers satisfying NMR data |
|---|---|---|---|---|
| 32 | 31 | 18 | 3.61 | 16.6% |
| 19 | 5.45 | 0.0500% | ||
| 21 | 4.90 | 5.68% | ||
|
| ||||
| 35 | 18 | 3.34 | 33.0% | |
| 19 | 3.28 | 1.35% | ||
| 21 | 4.99 | 0.775% | ||
|
| ||||
| 21 | 31 | 4.90 | 5.68% | |
| 18 | 1.82 | 100% | ||
| 19 | 5.16 | 13.9% | ||
|
| ||||
| 18 | 31 | 3.61 | 16.6% | |
| 21 | 1.82 | 100% | ||
| 19 | 2.11 | 100% | ||
|
| ||||
| 33 | 34 | 2.10 | 100% | |
| 18 (weak) | 4.54 | 27.2% | ||
| 21 (weak) | 5.97 | 0.0500% | ||
|
| ||||
| 33 | 31 | 32 | 2.13 | 100% |
| 32 | 31 | 2.13 | 100% | |
| 18 | None | 2.40b | 17.7%b | |
| 19 | None | 2.35b | 1.73%b | |
| 21 | None | 2.02b | 13.8%b | |
Number represents the carbon at which the proton was irradiated, or carbon with observed NOE enhancement. 18, 19, and 21 are on the cholane skeleton, while 31, 33, 34, and 35 are on the side chain aromatic ring near the acid (see Table S8).
Although no NOEs were observed when protons on carbons 18, 19, and 21 were irradiated, MD simulation results are reported for proton pairs 18-31, 19-31, and 21-31.
NMR results supported the qualitative CSP-SAR analysis. NOE enhancements require the two interacting protons to be within approximately 6 Å or less. Such short distance conformers were observed from MD simulation of 32, but not from 33. The percentage of conformers showing intramolecular hydrogen bonding (i.e. either O3-GA distance or O7-GA distance less than 3Å) for 32 and 33 were 71.8% and 0%, respectively. Accordingly, both NMR and qualitative CSP-SAR analysis found 32 to sample compact conformations, while 33 displayed extended conformations only. From CSP analysis, 32 exhibited intramolecular hydrogen bond between the carboxylate group on the gamma substituent and 7-OH (Figure 7) resulting in enhanced hydrophobicity and inhibition potency. NMR was consistent with this observation, since NOEs between the aromatic ring and the cholane skeleton in 32 indicate a folded conformation. Meanwhile, no NOEs were observed between the aromatic ring and the cholane skeleton in 33, suggesting lack of hydrogen bonding.
Comparison to Previous hASBT Inhibition Models
A 3D QSAR model for inhibition of rabbit ASBT was developed using neutral and monoanionic non-bile acids 12. In the model, the 5-membered D ring, the C-21 methyl group, the 7 or 12-OH in α-orientation, and a negative charge on the C-24 side chain promoted affinity. The 3-ΟΗ and the cis-configuration of A and B rings of the cholane nucleus did not impact binding. This model did not include dianionic bile acid analogues or explain the contribution of conformational distributions to activity.
We recently studied the inhibition properties of aminopiperidine conjugates of glu-CDCA.7 The quantitative CSP-SAR models for aminopiperidine analogues included the electrostatic contribution of solvation free energy (GBener) and logPc, where hydrophobic character favored binding, consistent with the present study's CSP-SAR models for aniline conjugates. The quantitative model for aminopiperidine conjugates included two angle parameters (O7-AS-BC and O7-AS-C20, where AS represents the α-substituents), which were evaluated for aniline conjugates here. However, these two angles did not impact activity for anilinyl conjugates here.
Conformation, Hydrophobicity, and Binding Activity
Results here indicate that ligand conformation can impact ligand physical properties, in this case hydrophobicity, and subsequent binding. For example, Gomar et. al.13 demonstrated that 3D QSAR analysis for the IC50 of anti-HIV compounds was improved when the lipophilicity of the relevant conformer(s) was applied. Gaillard et. al. 14 found that 3D QSAR analysis for α1-adrenoceptor ligands was improved by considering conformationally-dependent lipophilicity. Findings here about the conformation of dianions and hASBT inhibition are similar to these previous works. Hydrophobicity is well known to be a crucial factor for ligand-protein binding interaction. For example, Parker et. al.15 observed that activity of 5-HT2α agonists was strongly dependent on compound lipophilicity.
While the associations of conformation, lipophilicity, and activity have been described previously, the present study elucidates the role of conformation in ligand hydrophobicity and subsequent binding activity for a transporter protein. Perhaps an analogous finding is the unusually high passive permeability of cyclosporine A across lipid bilayers. In spite of cyclosporine A being a relatively large cyclic peptide, this drug shows high permeability across membrane and is well absorbed from the gut after oral administration. Drug conformation, including intramolecular hydrogen bonding, has been considered as a determinant in cyclosporine A's high permeability16.
Conclusion
Thirty-three anilinyl conjugates of glu-CDCA were synthesized and provided a range of hASBT inhibition potencies, ranging from 0.275 to 108 M. Three quantitative CSP-SAR models that excluded the weak dianion 33 were developed and identified physico-chemical features that favor binding. In addition, a qualitative CSP-SAR model was derived to explain affinity values of the dianionic molecules, including 33. The model predicted the presence of a molecular switch associated with the spatial location of the carboxylate group on the aromatic ring, thereby controlling intramolecular hydrogen bonding between the carboxylate group on the aromatic ring and either 3-OH or 7-OH of the cholane skeleton. This interaction afforded ligand conformations that promoted ligand hydrophobicity, thereby improving binding, consistent with the quantitative CSP-SAR models.
This hypothesis was tested by designing conjugates 34 and 35 that should have altered binding properties, based on intramolecular hydrogen bonding ability. MD simulations showed that the insertion of a methylene bridge in 32 to yield 34 resulted in loss of intramolecular hydrogen bond, while the insertion of a methylene bridge in 33 to yield 35 resulted in conformers with an intramolecular hydrogen bond between carboxylate group on the aromatic ring and 7-OH. Accordingly, 35 attained conformations with enhanced hydrophobicity, which led to improved binding affinity. Synthesis and assay of these compounds validated the predictions.
Overall, the present work indicates that dianionic conjugates can be designed with high binding affinity to hASBT by exploiting an underpinning molecular switch mechanism. Activity of potent dianions depended on the location of the acid group and the acid group's function as a “molecular switch” to allow for intramolecular hydrogen bonding, leading to conformations where the acid is “concealed”; thereby enhancing conjugate hydrophobicity. Results here focus on the transporter hASBT and analogues of its native ligand, bile acids. These findings have broader applicability in illustrating ligand conformations that are responsible for ligand binding to biological targets. Enhanced ligand hydrophobicity via a molecular switch or other conformation-dependent mechanisms may contribute to the activity in other ligand-receptor scenarios.
Experimental Section
Materials
[3H]-Taurocholic acid (10 μCi/mmol) was purchased from American Radiolabeled Chemicals, Inc (St. Louis, MO). Taurocholate was obtained from Sigma Aldrich (St. Louis, MO). Chenodeoxycholate (CDCA) was obtained from TCI America (Portland, OR). Protected glutamic acid analogs were purchased from Novabiochem (Gibbstown, NJ). Aniline and substituted anilines were obtained from Sigma Aldrich (St. Louis, MO). Geneticin, fetal bovine serum (FBS), trypsin, and DMEM were purchased from Invitrogen (Rockville, MD). All other reagents and chemicals were of the highest purity commercially available.
Synthetic Procedures: Overview
A series of substituted anilinyl conjugates glu-CDCA were synthesized using two synthetic approaches. In the first approach (used for synthesis of all targets except 2) α-benzyl glutamic acid was first coupled to CDCA via either N-hydroxysuccinimide (OSU) ester or benzotriazole (OBT) ester. Various substituted aniline probes were then coupled to glutamic acid by stirring either at RT or 60°C using O-Benztriazol-1-yloxytris-1,1,3,3 tetra methyl uranium hexaflourophosphate (HBTU) as the activating agent and triethylamine (TEA) as the base. The resulting neutral compounds were then subjected to hydrogenation in parr shaker for 1-2 h in ethanol (EtOH) and 10% palladium to remove the α-benzyl group, yielding the mono and dianionic targets. To synthesize 2 (Scheme 2), a second approach was needed.
Scheme 2.

Synthesis of p-chloro substituted anilinyl conjugates of glu-CDCA. (a) EDC, HOBt, DIPEA, DMF 25°C, 2h; (b) TFA/TES 25°C, 48h (c) CDCA-OBt (ii), DIPEA, DMF 25°C, 12h.
All neutral compounds intermediates were purified by column chromatography using a gradient of hexane and ethyl acetate. All final target compounds were obtained as solids after deprotection. Identity and purity were confirmed by TLC, MS, NMR, and elemental analysis. All final target compounds possessed ≥95% purity.
Synthetic Procedure: Method A
Synthesis of HOBT ester of CDCA (ii).7
To a solution of CDCA (i) (5 g, 12.74 mmol) in DMF (15 mL), HBTU (5.07g, 13.37 mmol), HOBt (0.86g, 6.37 mmol), and TEA (2.33 mL, 13.37mmol) were added and stirred at RT for 4 h. After the reaction was complete, it was quenched with H2O, yielding a crude product, which was then extracted into EtOAc (3×). The combined organic layers were washed with brine (1×), dried over Na2SO4, and filtered. EtOAc was removed under reduced pressure, resulting in CDCA-OBt (ii), a white fluffy solid, which was used without any further purification. MS showed appropriate peaks: [M+1] 510.8, [M+Na] 532.8.
Synthesis of N-hydroxysuccinimide ester of CDCA (iii)
To a solution of CDCA (i) (5 g, 12.74 mmol) in DMF (15 mL), HBTU (5.07g, 13.37 mmol), anhydrous N-hydroxysuccinimide (1.48 g, 12.8 mmol), and TEA (1.7mL, 12.8 mmol) were added and stirred at RT for 4 h. Water was added to quench the reaction, followed by extraction as described above for CDCA-OBT ester. MS showed appropriate peaks: [M+1] 512.8, [M+Na] 534.8.
Synthesis of α-benzyl ester glutamic acid CDCA amide (glu-CDCA).7
The activated ester of CDCA (either ii or iii) (5.2 g, 10.2 mmol) was reacted with α-benzyl-glutamic acid (2.4 g, 10.2 mmol), along with 1.42 mL of triethylamine (TEA), in anhydrous DMF (20 mL). After heating the reaction at 40°C overnight, the reaction was quenched with 50 mL of cold water. The resulting sticky white precipitate was extracted into 40 ml volumes of EtOAc (3x) and washed with 1N HCl (3x), 15 mL of water (3x), and 15 mL of brine (1x). The organic layer was dried over Na2SO4 and filtered. Removal of EtOAc under reduced pressure yielded an off-white fluffy solid, which was used without any further purification. MS showed appropriate peaks: [M+1] 612.8, [M+Na] 634.8.
Synthesis of aniline conjugates of α-benzyl glutamic acid CDCA amide (v)
To a solution of glu-CDCA iv (1.25 g 2mmol) in DMF (15 ml) was added TEA (0.265 mL) and HBTU (0.76 g 2mmol) for 15 min, followed by the addition of appropriate aniline analogue. The reaction mixture was stirred at 40-60°C overnight. The DMF solution was then extracted with 40 mL volumes of EtOAc (3x). The organic extract was washed with 1N HCl (3x), 1N NaOH (3x), 15 mL of water (3x), and 15 mL of brine (1x). The organic extract was dried over Na2SO4, and filtered. The EtOAc extract was evaporated under vacuum to yield crude product. The neutral compounds were further purified by column chromatography (SiO2/8:2 EtOAc/hexane) to give a white solid MS showed appropriate peaks for neutral compounds.
Monoanionic target conjugates 1 and 3-30 were obtained from v via catalytic hydrogenation to remove the α-benzyl ester (10% Pd/charcoal in EtOH at 40 psi for 1 h). The product was filtered through Celite and the solvent was removed under reduced pressure to give targets 1 and 3-30. Dianionic conjugates 31-35 were obtained from v as above, via catalytic hydrogenation to remove the α-benzyl ester (10% Pd/charcoal in EtOH at 40 psi for 1 h). The resulting solution was filtered and solvent was removed under reduced pressure. The benzoate esters were then hydrolysed, using 5% NaOH in methanol for 2 h. The resulting solution was acidified using 12N HCl dropwise to yield a precipitate. Methanol was evaporated under vacuum. The solid was extracted with EtOAc (3x) and dried over Na2SO4, followed by filtration.
Synthetic Procedure: Method B
Synthesis of p-chloroaniline conjugates of α-benzyl glutamic acid CDCA amide
To a solution of N-α-t-boc-L-glutamic acid α-t-butyl ester (vi) (3g, 9.89 mmol) in DMF (30 mL). was added p-chloroaniline (10.88mmol), 1-ethyl-3-(3-dimethylaminopropyl) carbodiimide (EDC, 2.08g, 10.88 mmol), HOBt (1.47g, 10.88 mmol), and DIPEA (3.8 mL, 21.75 mmol). The reaction mixture was stirred at RT for 2 h. After reaction was complete, 30 ml of 1M HCl was added and the mixture was extracted with EtOAc (3x). The combined organic layers were washed with brine (1x), dried over MgSO4, and filtered. EtOAc was removed under vacuum, yielding vii, which was further purified by column chromatography (SiO2/3:7 ethyl acetate/hexane) to give a white solid.
To vii was added trifluoroacetic acid/triethyl silane (TFA/TES, 95:5 ratio, 10 mL/1g of vii). The resulting solution was stirred at RT for 48 h, followed by the removal of the solvent under reduced pressure to yield an oil of viii, which was solidified upon trituration with ether. The pure solid viii was collected by filtration and washed with ether. To a solution of ii (1.2 equiv) in DMF, viii (1 equiv) was added, followed by the addition of DIPEA (1.2 equiv). The reaction mixture was stirred at RT for 12 h. The reaction was quenched by addition of 0.5M HCl solution (30 mL). The mixture was stirred until product 2 solidified, which was then filtered and washed with water. NMR and MS results (Table S1) and elemental analysis (Table S2) verified the identity and purity of the reported compounds.
Binding Affinity Studies
Stably-transfected hASBT-MDCK cells were cultured as previously described.17 Briefly, cells were grown at 37 °C, 90% relative humidity, 5% CO2 atmosphere and fed every two days. Culture media consisted on DMEM supplemented with 10% FBS, 50 units/mL penicillin and 50 μg/mL streptomycin. Geneticin was added at 1 mg/mL to maintain selection pressure. Cells were passaged after four days or after reaching 90% confluency.
The binding affinities of 1-35 were evaluated via taurocholate inhibition studies, where taurocholate is a potent substrate for hASBT. Cis-inhibition of taurocholic acid (3H-TCA) by conjugate of interest was performed using hASBT-MDCK monolayers in 12 well plates (3.8 cm2, Corning, Corning, NY). Briefly, cells were seeded at a density of 1.5 million/well. Prior to study on day 4, cells were induced with 10mM sodium butyrate for about 12-17 h. To conduct the inhibition assay, cells were washed three times with Hank's balanced salt solution (HBSS), and then exposed to donor solution containing taurocholic acid (2.5μM with 0.5μCi/mL 3H-TCA) and conjugate (0-100 μM for monoanions and 0-1000 μM for dianions). Inhibition studies were conducted at 37°C for 10 min on an orbital shaker (50 rpm). After 10 min, donor solution was removed and cells were washed three times with chilled sodium-free buffer (where NaCl was replaced by 137 mM tetraethylammonium chloride). Cells were lysed using 250 μL of 1N NaOH and allowed to stand for at least 2 h. After this time, cell lysate was neutralized with 250 μL of 1N HCl and counted for associated radioactivity using an LS6500 liquid scintillation counter (Beckmann Instruments, Inc., Fullerton, CA).
Inhibition data was regressed using a modified Michaelis-Menten equation to determine the inhibition constant Ki, as previously described7, including parallel studies on each occasion to estimate Kt, Jmax, and Pp for taurocholic acid.
Computational methods
In silico models of conjugates were built using the program CHARMM18 with the all-atom CHARMM general force field.19 Each molecule was subjected to 1000 steps of steepest descent (SD) and 500 steps of Newton−Raphson (NRAP) energy minimization in the gas phase to a gradient of 10-4 kcal/mol/Å. CHARMM-minimized structures were subjected to replica exchange molecular dynamics (MD) simulations to obtain the conformational distribution of each molecule20-22. Replica exchange MD simulations involved 20 ns simulations with four replicas of each molecule between 300K and 400K using an exponential scale (300K, 330K, 363K, and 400K). Exchange of replicas was attempted after every 250 MD steps. MD simulations were performed using Langevin dynamics23 with an integration time step of 0.002 ps and the aqueous solvation was modeled implicitly via the Generalized Born Continuum Solvent Model (GBMV)24, 25. SHAKE was applied to all covalent bonds involving hydrogens26. Conformations saved every 20 ps and obtained from all 4 replicas were used for the analysis. The protonation states of the ionizable groups present in the molecules were determined based on the experimental pH of 6.8. All free acids at R1 and R2 (Table 1) were assumed to be deprotonated.
Several physico-chemical descriptors were calculated for each conjugate by averaging over the full trajectories. The free energy of solvation for each compound in water ( ΔGw) and octanol (ΔGo) was calculated using the semi-empirical quantum chemical program AMSOL6.8 by invoking the AM1-SM5.42R continuum solvent model.27 The free energy of solvation in a solvent medium was calculated by taking the difference between the heat of formation plus solvation energy of the solvated system in its relaxed electronic state and that for the gas-phase system. Partition coefficients (logPc) were calculated using Eqn. 1.28
| (1) |
Average solvent accessible surface area (SASA) and polar surface area (PSA) were calculated using the Lee and Richards method as implemented in CHARMM.29 The radius of the solvent molecule was taken as 1.4 Å, which approximates the radius of a water molecule.30 PSA for each compound was calculated by adding the contribution of polar atoms (N, O, F, Cl, Br and hydrogen atoms covalently attached to any of these atoms). For calculation of PSA, halogens were included as they could potentially take part in polar interaction with other polar atoms.31-34 SASA and PSA were also calculated exclusively for the region beyond C-24 of the bile acid conjugates (SASAside and PSAside) to access the contribution of the substituents alone towards the interaction with hASBT. Surface area terms were obtained as averages over the conformations saved from the MD simulations. Molecular weight (MW), molar refractivity (MR), number of rotatable bonds (brotN) and flexibility parameter (KierFlex) were calculated using the program MOE35. Additionally, number of hydrogen bond donors (HD) and hydrogen bond acceptors (HA) for each molecule was calculated using Discovery Studio (Accelrys Inc.).36
Conformational properties of molecules required for CSP model development included 20 pharmacophore distances (BC-AA, BC-GS, BC-GSmax, BC-GSmin, C18-AA, C18-GS, C18-GSmax, C18-GSmin, C19-AA, C19-GS, C19-GSmax, C19-GSmin, O3-AA, O3-GS, O3-GSmax, O3-GSmin, O7-AA, O7-GS, O7-GSmax, O7-GSmin) and 26 pharmacophore angles (AA-GS-O3, AA-GS-O7, C18-GS-O3, C18-GS-O7, C19-GS-O3, C19-GS-O7, GS-O3-AA, GS-O3-C18, GS-O3-C19, GS-O7-AA, GS-O7-C18, GS-O7-C19, O3-AA-BC, O3-AA-GS, O3-C18-GS, O3-C19-GS, O7-AA-BC, O7-AA-GS, O7-C18-GS, O7-C19-GS, O3-AA-GS, O3-C18-GS, O3-C19-GS, O7-AA-GS, O7-C18-GS, O7-C19-GS, O3-AA-BC, O3-AA-C18, O3-AA-C19, O7-AA-BC, O7-AA-C18, O7-AA-C19) as shown in Figure 2. Probability distributions of conformational sampling involving the structural descriptors were obtained from the MD trajectories. GSmax and GSmin represent the maximum and minimum distances of the γ-substituent from the corresponding point. For example, C18-GSmax denotes the maximum distance of the γ-substituent from C-18. 1-D probability distributions of all structural descriptors were derived with a bin size of 0.1 Å and 1° for distances and valence angles, respectively.
Overlap coefficient (OC) of each structural descriptor were used to quantify the extent of similarity of the regions of conformational space as defined by the various distances, angles and dihedrals sampled by each conjugate. OC for continuous probability density functions is given by Reiser and Faraggi,37
| (2) |
where f1(x) and f2(x) are probability density functions of the two distributions. For discrete probability functions, Eqn. 2 can be written as,
| (3) |
where PAi and PBi are the probability in bin i for compounds A and B, and N is the total number of bins. OC values for each compound were calculated with respect to the most potent inhibitor in the data set (Compound 15, Ki = 0.275 μM).
The overlap coefficients of all molecules were regressed with respect to their inhibition constants. Similarly, physico-chemical descriptors were also subjected to linear regression against the respective Ki values of the molecules. Statistical program “R” was used for the regression analysis38. The structural and physico-chemical descriptors were then combined to make a complete set of molecular descriptors for model development. All descriptors were selected for multivariable regression analysis.
Molecular descriptors were subjected to multivariable regression in all possible combinations of two. However, any combination having correlation (r) greater than 0.8 were not considered. The correlation matrix used to determine the internal correlation between descriptors is presented in Table S3. All pairs of descriptors with p-values of the independent variables, as well as the intercept, less than 0.05 were selected for further analysis. Additional descriptors were sequentially added to each selected pair of descriptors. This approach was applied to all selected groups until all possible combinations of descriptors yielded p-values greater than 0.05. All combinations of descriptors with p-values less than 0.05 formed the set of candidate models. The standardized coefficients of the independent variables39 of the candidate models were also calculated using Equation 4.40
| (4) |
where bk and b'k are the metric and standardized coefficient of independent variable xk, respectively, Sxk and Sy are the standard deviation of xk and dependent variable y. Standardized coefficients were calculated to determine the relative significance of the independent variables to influence the biological activity. Model evaluation was performed using AICC (modified Akaike Information Criterion)41, 42 analysis and leave-one-out cross validation method, as described previously.7
NMR Methods
NMR experiments were performed on a Varian Inova instrument operating at a proton Larmor frequency of 500 MHz. Saturated solutions of each 32 and 33 were prepared in D2O. Analysis of the tumbling times indicated that the compounds are not aggregating in solution. 1D proton steady-state NOE difference experiments were conducted using irradiation times of 1.5, 2 and 4 sec. Aromatic protons on the aniline substituent were irradiated to evaluate NOE enhancements in the steroidal region in order to elucidate differences between 32 and 33 conformational properties. NMR data were processed with Varian software, NMR Pipe (Delaglio and BAX, NIH) and SpinWorks (University of Manitoba, Kurt Marat). Sparky (UCSF, Kneller and Goddard) was used for analysis of the 2D spectra. NMR assignments of 32 were obtained from 1D proton and carbon experiments in D2O-phosphate (pH 7.4) to achieve a high concentration, 2D studies (i.e. COSY, HMQC and HMBC), and published assignments of CDCA.43
Supplementary Material
Acknowledgements
This work was support in part by National Institutes of Health grants DK67530 and the Computer-Aided Drug Design Center, University of Maryland, Baltimore for computational resources. We thank Professor Swaan (University of Maryland) for his helpful suggestions and Kellie Hom (University of Maryland) for NMR assistance.
Abbreviations
- hASBT
Human apical sodium-dependent bile acid transporter
- CDCA
Chenodeoxycholic acid
- glu-CDCA
Glutamic acid CDCA amide
- CSP
Conformationally sampled pharmacophore
- MD
Molecular dynamics
- PSA
Polar surface area
- HD
Hydrogen bond donor
- OC
Overlap coefficient
- SASA
Solvent accessible surface area
- logPc
Calculated partition coefficient
- NOE
Nuclear Overhauser Effect
- OSU
N-hydroxysuccinimide
- OBT
benzotriazole
- HBTU
Benzotriazol-1-yloxytris-1,1,3,3 tetra methyl uranium hexaflourophosphate
- TEA
triethylamine
- EtOH
ethanol
- DMF
Dimethylformamide
- TFA
Triflouroacetic acid
- TES
Triethylsilane
- DIPEA
N,N-Diisopropylethylamine
- MDCK
Madin Darby canine kidney
Footnotes
Supporting Information Available: Complete list of 13C NMR data, combustion analysis, computational tables for all synthesized analogues. This material is available free of charge via the Internet at http://pubs.acs.org.
REFERENCE
- 1.Balakrishnan A, Polli JE. Apical sodium dependent bile acid transporter (ASBT, SLC10A2): a potential prodrug target. Mol Pharmaceutics. 2006;3:223–230. doi: 10.1021/mp060022d. [DOI] [PMC free article] [PubMed] [Google Scholar]
- 2.Tolle-Sander S, Lentz KA, Maeda DY, Coop A, Polli JE. Increased acyclovir oral bioavailability via a bile acid conjugate. Mol Pharmaceutics. 2004;1:40–48. doi: 10.1021/mp034010t. [DOI] [PubMed] [Google Scholar]
- 3.Alrefai WA, Sarwar Z, Tyagi S, Saksena S, Dudeja PK, Gill RK. Cholesterol modulates human intestinal sodium-dependent bile acid transporter. Am J Physiol Gastrointest Liver Physiol. 2005;288:G978–G985. doi: 10.1152/ajpgi.00379.2004. [DOI] [PubMed] [Google Scholar]
- 4.Sakamoto S, Kusuhara H, Miyata K, Shimaoka H, Kanazu T, Matsuo Y, Nomura K, Okamura N, Hara S, Horie K, Baba T, Sugiyama Y. Glucuronidation converting methyl 1-(3,4-dimethoxyphenyl)-3-(3-ethylvaleryl)-4-hydroxy-6,7,8-trimethoxy-2-na phthoate (S-8921) to a potent apical sodium-dependent bile acid transporter inhibitor, resulting in a hypocholesterolemic action. J Pharmacol Exp Ther. 2007;322:610–618. doi: 10.1124/jpet.106.116426. [DOI] [PubMed] [Google Scholar]
- 5.Kitayama K, Nakai D, Kono K, van der Hoop AG, Kurata H, de Wit EC, Cohen LH, Inaba T, Kohama T. Novel non-systemic inhibitor of ileal apical Na+-dependent bile acid transporter reduces serum cholesterol levels in hamsters and monkeys. Eur J Pharmacol. 2006;539:89–98. doi: 10.1016/j.ejphar.2006.04.005. [DOI] [PubMed] [Google Scholar]
- 6.Balakrishnan A, Wring SA, Coop A, Polli JE. Influence of charge and steric bulk in the C-24 region on the interaction of bile acids with human apical sodium-dependent bile acid transporter. Mol Pharmaceutics. 2006;3:282–292. doi: 10.1021/mp0600135. [DOI] [PMC free article] [PubMed] [Google Scholar]
- 7.González PM, Acharya C, MacKerell AD, Jr., Polli JE. Inhibition Requirements of the human Apical Sodium-dependent Bile acid Transporter (hASBT) using Aminopiperidine Conjugates of glutamyl-Bile Acids. Pharm Res. 2009;26:1665–1678. doi: 10.1007/s11095-009-9877-3. [DOI] [PMC free article] [PubMed] [Google Scholar]
- 8.Bernard D, Coop A, MacKerell AD., Jr. 2D conformationally sampled pharmacophore: a ligand-based pharmacophore to differentiate delta opioid agonists from antagonists. J Am Chem Soc. 2003;125:3101–3107. doi: 10.1021/ja027644m. [DOI] [PubMed] [Google Scholar]
- 9.Bernard D, Coop A, MacKerell AD., Jr. Quantitative conformationally sampled pharmacophore for delta opioid ligands: reevaluation of hydrophobic moieties essential for biological activity. J Med Chem. 2007;50:1799–1809. doi: 10.1021/jm0612463. [DOI] [PMC free article] [PubMed] [Google Scholar]
- 10.Bernard D, Coop A, MacKerell AD., Jr. Conformationally sampled pharmacophore for peptidic delta opioid ligands. J Med Chem. 2005;48:7773–7780. doi: 10.1021/jm050785p. [DOI] [PubMed] [Google Scholar]
- 11.Ekins S, Mirny L, Schuetz EG. A Ligand-Based Approach to Understanding Selectivity of Nuclear Hormone Receptors PXR, CAR, FXR, LXRα, and LXRβ. Pharmaceutical Research. 2002;19:1788–1800. doi: 10.1023/a:1021429105173. [DOI] [PubMed] [Google Scholar]
- 12.Baringhaus KH, Matter H, Stengelin S, Kramer W. Substrate specificity of the ileal and the hepatic Na+/bile acid cotransporters of the rabbit. II. A reliable 3D QSAR pharmacophore model for the ileal Na+/bile acid cotransporter. Journal of Lipid Research. 1999;40:2158–2168. [PubMed] [Google Scholar]
- 13.Gomar J, Giraud E, Turner D, Lahana R, Carrupt PA. 3D-LogP: An Alignment-Free 3D Description of Local Lipophilicity for QSAR Studies. 2008:275. doi: 10.1385/1-59259-802-1:215. [DOI] [PubMed] [Google Scholar]
- 14.Gaillard P, Carrupt PA, Testa B, Boudon A. Molecular lipophilicity potential, a tool in 3D QSAR: method and applications. J Comput Aided Mol Des. 1994;8:83–96. doi: 10.1007/BF00119860. [DOI] [PubMed] [Google Scholar]
- 15.Parker MA, Kurrasch DM, Nichols DE. The role of lipophilicity in determining binding affinity and functional activity for 5-HT2A receptor ligands. Bioorg Med Chem. 2008;16:4661–4669. doi: 10.1016/j.bmc.2008.02.033. [DOI] [PMC free article] [PubMed] [Google Scholar]
- 16.Augustijns PF, Brown SC, Willard DH, Consler TG, Annaert PP, Hendren RW, Bradshaw TP. Hydration Changes Implicated in the Remarkable Temperature-Dependent Membrane Permeation of Cyclosporin A. Biochemistry. 2000;39:7621–7630. doi: 10.1021/bi9929709. [DOI] [PubMed] [Google Scholar]
- 17.Balakrishnan A, Sussman DJ, Polli JE. Development of stably transfected monolayer overexpressing the human apical sodium-dependent bile acid transporter (hASBT). Pharmaceutical Research. 2005;22:1269–1280. doi: 10.1007/s11095-005-5274-8. [DOI] [PubMed] [Google Scholar]
- 18.Brooks BR, Brooks CL, III, MacKerell AD, Jr., Nilsson L, Petrella RJ, Roux B, Won Y, Archontis G, Bartels C, Boresch S, Caflisch A, Caves L, Cui Q, Dinner AR, Feig M, Fischer S, Gao J, Hodoscek M, Im W, Kuczera K, Lazaridis T, Ma J, Ovchinnikov V, Paci E, Pastor RW, Post CB, Pu JZ, Schaefer M, Tidor B, Venable RV, Woodcock HL, Wu X, Yang W, York DM, Karplus M. CHARMM: The biomolecular simulation program. J. Comp. Chem. 2009;30:1545–1614. doi: 10.1002/jcc.21287. [DOI] [PMC free article] [PubMed] [Google Scholar]
- 19.Vanommeslaeghe K, Hatcher E, Acharya C, Kundu S, Zhong S, Shim J, Darian E, Guvench O, Lopes P, Vorobyov I, MacKerell AD., Jr. CHARMM General Force Field (CGenFF): A force field for drug-like molecules compatible with the CHARMM all-atom additive biological force fields. J Comp Chem. 2010;31:671–690. doi: 10.1002/jcc.21367. [DOI] [PMC free article] [PubMed] [Google Scholar]
- 20.Feig M, Karanicolas J, Brooks CL., 3rd MMTSB Tool Set: enhanced sampling and multiscale modeling methods for applications in structural biology. J Mol Graph Model. 2004;22:377–395. doi: 10.1016/j.jmgm.2003.12.005. [DOI] [PubMed] [Google Scholar]
- 21.Garcia AE, Sanbonmatsu KY. Exploring the energy landscape of a beta hairpin in explicit solvent. Proteins. 2001;42:345–354. doi: 10.1002/1097-0134(20010215)42:3<345::aid-prot50>3.0.co;2-h. [DOI] [PubMed] [Google Scholar]
- 22.Sugita Y, Okamoto Y. Replica-exchange Molecular Dynamics Method for Protein Folding. Chem Phys Lett. 1999;314:141–151. [Google Scholar]
- 23.Allen MP, Tildesley DJ. Computer simulation of liquids. Clarendon Press; Oxford: 1987. p. 385. [Google Scholar]
- 24.Lee MS, Feig M, Salsbury FR, Brooks CL. New analytic approximation to the standard molecular volume definition and its application to generalized born calculations. Journal of Computational Chemistry. 2003;24:1348–1356. doi: 10.1002/jcc.10272. [DOI] [PubMed] [Google Scholar]
- 25.Lee MS, Salsbury FR, Brooks CL. Novel generalized Born methods. Journal of Chemical Physics. 2002;116:10606–10614. [Google Scholar]
- 26.Ryckaert JP, Ciccotti G, Berendsen JC. Numerical integration of the cartesian equations of motion of a system with constraints: molecular dynamics of nalkanes. Journal of Computational Physics. 1977;23:327–341. [Google Scholar]
- 27.Hawkins GD, Giesen DJ, Lynch GC, Chambers CC, Rossi I, Storer JW, Li J, Zhu T, Thompson JD, Winget P. e. a. AMSOL Version 6.8. University of Minnesota; Minneapolis, MN: [Google Scholar]
- 28.Orozco M, Colominas C, Luque FJ. Theoretical determination of the solvatioon free energy in water and chloroform of the nucleic acid bases. J. Chem. Phys. 1996;209:19–29. [Google Scholar]
- 29.Lee B, Richards FM. The interpretation of protein structures: estimation of static accessibility. J Mol Biol. 1971;55:379–400. doi: 10.1016/0022-2836(71)90324-x. [DOI] [PubMed] [Google Scholar]
- 30.Chothia C. Structural invariants in protein folding. Nature. 1975;254:304–308. doi: 10.1038/254304a0. [DOI] [PubMed] [Google Scholar]
- 31.Auffinger P, Hays FA, Westhof E, Ho PS. Halogen bonds in biological molecules. Proc Natl Acad Sci U S A. 2004;101:16789–16794. doi: 10.1073/pnas.0407607101. [DOI] [PMC free article] [PubMed] [Google Scholar]
- 32.Panigrahi SK, Desiraju GR. Strong and weak hydrogen bonds in the protein-ligand interface. Proteins. 2007;67:128–141. doi: 10.1002/prot.21253. [DOI] [PubMed] [Google Scholar]
- 33.Berski S, Ciunik Z, Drabent K, Latajka Z, Panek J. Dominant role of C-Br---N halogen bond in molecular self-organization. Crystallographic and quantum-chemical study of schiff-base-containing triazoles. Journal of Physical Chemistry B. 2004;108:12327–12332. [Google Scholar]
- 34.Acharya C, Seo PR, Polli JE, MacKerell AD., Jr. Computational model for predicting chemical substituent effects on passive drug permeability across parallel artificial membranes. Mol Pharmaceutics. 2008;5:818–828. doi: 10.1021/mp800035h. [DOI] [PMC free article] [PubMed] [Google Scholar]
- 35.Hanke PR, Timm P, Falk G, Kramer W. Behavior of different suture materials in the urinary bladder of the rabbit with special reference to wound healing, epithelization and crystallization. Urol Int. 1994;52:26–33. doi: 10.1159/000282565. [DOI] [PubMed] [Google Scholar]
- 36.Discovery Studio, Accelrys Inc. http://www.accelrys.com/dstudio.
- 37.Reiser B, Faraggi D. Confidence Intervals for the Overlapping Coefficient: the Normal Equal Variance Case. The Statistician. 1999;48:413–418. [Google Scholar]
- 38.Ihaka R, Gentleman RR. A Language for Data Analysis and Graphics. Journal of Computational and Graphical Statistics. 1996;5:299–314. [Google Scholar]
- 39.Schroeder LD, Sjoquist DL, Stephan PE. Understanding regression analysis: an introductory guide. Sage Publications; 1986. [Google Scholar]
- 40.Olobatuyi ME. A user's guide to path analysis. University Press of America; 2006. [Google Scholar]
- 41.Akaike H. Likeliood of a Model and Information Criteria. Journal of Econometrics. 1981;16:3–14. [Google Scholar]
- 42.McQuarrie ADR, Tsai CL. Regression and Time Series Model Selection. World Scientific; Singapore: 1998. [Google Scholar]
- 43.Waterhous DV, Barnes S, Muccio DD. Nuclear magnetic resonance spectroscopy of bile acids. Development of two-dimensional NMR methods for the elucidation of proton resonance assignments for five common hydroxylated bile acids, and their parent bile acid, 5 beta-cholanoic acid. J Lipid Res. 1985;26:1068–1078. [PubMed] [Google Scholar]
Associated Data
This section collects any data citations, data availability statements, or supplementary materials included in this article.