Abstract
Objective
To describe the prevalence of time spent in sedentary behaviors (e.g., TV/video and computer use) among youth in the U.S.
Methods
The National Health and Nutrition Examination Survey (2001–06) provided data to examine sedentary behavior across age groups (2–5, 6–11, and 12–15 years of age), ethnic groups (European (EA), African (AA), and Mexican American (MA)), and body mass index categories (normal weight, overweight, obese).
Results
The sample included 8,707 (50.7% boys) children aged 2 to 15 years. Seventy percent of the sample was normal weight, 18.1% was overweight, and 11.5% was obese. The total proportion of young people engaged in TV/video viewing, computer use, and total screen time ≥ 2 hours daily was 33.0%, 6.7%, and 47.3%, respectively. More boys (49.4%) than girls (45.0%); older (12–15 yrs: 56.0%) versus younger children (2–5 yrs: 35.3% and 6–11 yrs: 49.1%); AA (66.1%) versus EA (42.5%) and MA (46.1%); obese (58.5%) versus overweight (50.8%) versus normal weight (44.6%); and low and middle income (<$25K: 51.4% and $25–45K: 51.2%) versus high income (>$45K: 42.6%) children spent ≥ 2 hours daily in screen time.
Conclusion
Nearly half (47%) of U.S. children exceed ≥2 hours/day of time in sedentary behavior. Further, it appears there are gender, age, ethnic, BMI-defined weight status, and income differences in exceeding ≥2 hours/day in sedentary behavior. These results will be useful in planning targeted interventions at those populations with a higher prevalence of sedentary behavior.
Keywords: sedentary time, TV viewing, disease risk, American youth, prevalence, leisure time
Introduction
Sedentary behavior is an independent risk factor for chronic disease (1). This relationship has been established in adults (2–8) and has recently been reported in children (9–11). Sedentary behavior can be either “productive” or “leisure” depending on the purpose of the activity (12). For example, reading and using the computer for homework are considered productive sedentary activities compared with watching cartoons on TV or playing non-educational computer or video games. Productive sedentary behaviors have not been associated with higher levels of physical inactivity, contrary to leisure-time sedentary behaviors (12). In children and adolescents, leisure-time sedentary behaviors such as TV viewing have also been associated with metabolic risk factors, independent of meeting physical activity recommendations (13). One predominant disease risk factor associated with leisure-time in children and adolescents is overweight and obesity (14–17), which poses independent health threats to young people (18–21) and tracks into adulthood (22).
The prevalence of overweight and obesity has been increasing in children in the U.S.; from 1999 to 2004 it increased from 14% to 18.2% in boys and from 13.8% to 16.0% in girls (23). It is logical to surmise that the recent rise in obesity prevalence is related to either 1) decreases in physical activity (energy expenditure) or 2) increases in food consumption (energy intake), or more likely a combination of both. Time spent in sedentary behavior such as using television, videos, DVDs, video games, and computers, collectively known as screen time, is purported to impact both physical activity levels (since sedentary behavior may displace physical activity (17)) and energy intake (by encouraging snacking while watching due to easy availability of foods and the influence of food commercials and advertisements (24)). The American Academy of Pediatrics (AAP) recommends no more than two hours per day of quality TV programming for young people, in part due to the relationship between screen time and health risk (25).
Data from the National Health and Nutrition Examination Survey (NHANES) from 1988 to 1994 reported that 25.9% of young people 8 to 16 years of age watched ≥ 4 hours of TV daily and that 39.1% watched ≤ 1 hour/day (14). Furthermore, there were ethnic differences, with 42.8% of Non-Hispanic black boys watching ≥ 4 hours of TV daily compared with 24.3% of Non-Hispanic white boys (14). In girls, those watching ≥ 2 hours per day of TV had higher odds of being overweight or obese regardless of level of physical activity (15). A description of the prevalence and profiles of sedentary behavior in U.S. children is needed to understand the extent of the problem and to identify high-risk groups. Therefore, the purpose of this study is to examine the profile and prevalence of time spent watching TV and total screen time in children and adolescents in the U.S.
Methods
Profiles of sedentary behavior were created using data from the National Health and Nutrition Examination Survey (NHANES) cycles 2001–02, 2003–04, and 2005–06. NHANES uses a complex, multistage, probability sampling design to select participants representative of the civilian, non-institutionalized U.S. population (26). Oversampling of certain population subgroups (i.e., African Americans, Mexican Americans, low income European Americans, adolescents 12–19 years, and people over 60 years) is done to increase the reliability and precision of health status indicator estimates for these groups (26). Each individual in the NHANES is assigned a sample weight based on census population figures; this allows for the development of national prevalence estimates (26).
Variables of interest for this study included TV viewing, computer use, age, ethnicity, and body mass index measured during the visit to the mobile exam center. Ethnicity was derived from questions about race and Hispanic origin (26). There were two questions used to assess sedentary behavior: “Over the past 30 days, on average how many hours per day did you sit and watch TV or videos?” and “Over the past 30 days, on average about how many hours per day did you use a computer or play computer games [outside of work]?” Response categories included “none”, “<1 hr”, “1 hr”, “2 hr”, “3 hr”, “4 hr”, and “5 or more hours”. These variables were analyzed combined to create a total screen time outcome variable, which serves as our primary measure of sedentary behavior. It is plausible that not all of time spent using a computer was for leisure and perhaps included homework or school research; the purpose of the computer usage was not collected in the survey; thus, we are not distinguishing between leisure-time and non-leisure-time computer use. Children aged 2 to 11 years had a responsible adult complete the survey on their behalf (i.e., proxy) while those aged 12 to 15 years completed it themselves. Body weight was measured on a digital scale with the participant wearing minimal clothes, and height was measured by a trained technician using a fixed wall stadiometer with participants heels together, arms by their side, and eyes in the Frankfort plane (26). The collection of NHANES data was reviewed and approved by the National Center for Health Statistics’ Institutional Review Board. Documentation on informed consent can be located on the NHANES website (26).
Data analysis followed the guidelines of the National Center for Health Statistics for analysis of NHANES data due to complex sampling design and methods (26). Exclusion criteria of participants in this study included being older than 16 years of age, younger than two years of age, physically unable to be active, “don’t know” or missing responses for TV/video and computer time, or refused to answer. Separate analyses were conducted examining the sedentary behavior variables across age groups (2–5, 6–11, and 12–15 years of age), ethnic groups (European, African, and Mexican American), international BMI classifications developed for children (normal weight, overweight, obese) (27), and annual household income (<$24,999, $25,000–$44,999, ≥$45,000). The criterion of less than 16 years was included since in 2001–02 the TV and computer questions were only asked to NHANES participants less than 16 years of age. Nevertheless, in 2003–04 and 2005–06 the questions were expanded to include all adolescents and adults; older adolescents and adults were removed since they were not included in the 2001–02 cycle.
Results
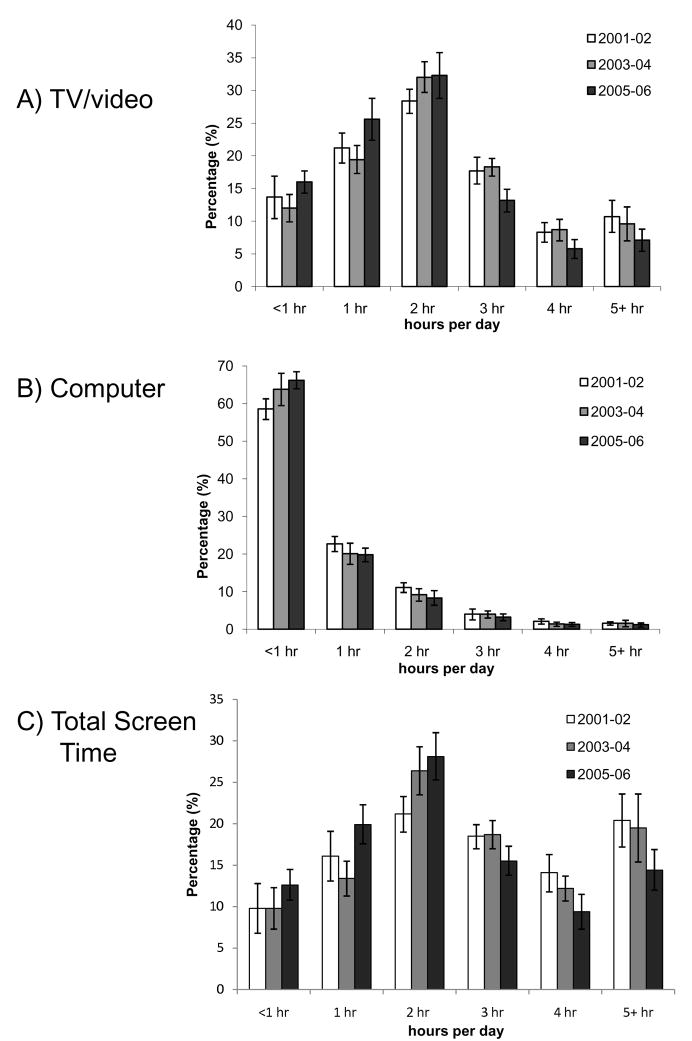
The sample included 8,707 (50.7% boys) children for the examination of age, ethnicity, BMI, household income and sedentary behavior (Table 1). According to international BMI classifications, 70.4% of the sample was normal weight, 18.1% was overweight, and 11.5% was obese. Profiles of the time spent in TV/video, computer, and total screen time for each of the NHANES cycles (2001–02, 2003–04, 2005–06) are presented in Figure 1. The total proportion of children watching or using the TV/video, computer, and total screen time for two or more hours was 33.0 ± 1.2%, 6.7 ± 0.4%, and 47.3 ± 1.2% over the combined cycles. The majority of the confidence intervals are overlapping between the NHANES data collection cycles, showing no significant difference between cycles. For total screen time, 2005–06 is higher for those respondents in the 2 hours/day category than 2003–04; however, it is not different from the 2001–02 responses.
Table 1.
Descriptive characteristics of children and adolescents 2 to 15 years of age in the U.S. National Health and Nutrition Examination Survey, cycles 2001–02, 2003–04, 2005–06 (Means ± SE).
| Total | Boys | Girls | |
|---|---|---|---|
| N | 8707 | 4413 | 4294 |
| Ethnicity (%) | |||
| European American | 59.4 | 59.9 | 59.0 |
| African American | 14.7 | 14.7 | 14.8 |
| Mexican American | 13.2 | 13.3 | 13.1 |
| Survey year (%) | |||
| 2001–02 | 31.1 | 31.7 | 30.5 |
| 2003–04 | 34.1 | 34.1 | 34.2 |
| 2005–06 | 34.8 | 34.3 | 35.4 |
| Age (y) | 8.6 ± 0.1 | 8.6 ± 0.1 | 8.5 ± 0.1 |
| BMI (kg/m2) | 19.0 ± 0.1 | 18.9 ± 0.1 | 19.0 ± 0.1 |
| IOTF BMI classifications (%) | |||
| Normal weight | 70.4 ± 1.1 | 71.1 ± 1.2 | 69.7 ± 1.2 |
| Overweight | 18.1 ± 0.7 | 18.0 ± 0.9 | 18.3 ± 0.8 |
| Obese | 11.5 ± 0.6 | 10.9 ± 0.7 | 12.1 ± 0.8 |
IOTF = International Obesity Task Force body mass index cutpoints (27).
Figure 1.
Distribution (95% CI) of sample across categories of hours per day in A) TV/video, B) computer, C) total screen time by cycles of the U.S. National Health and Nutrition Examination Survey in children and adolescents aged 2 to 15 years of age.
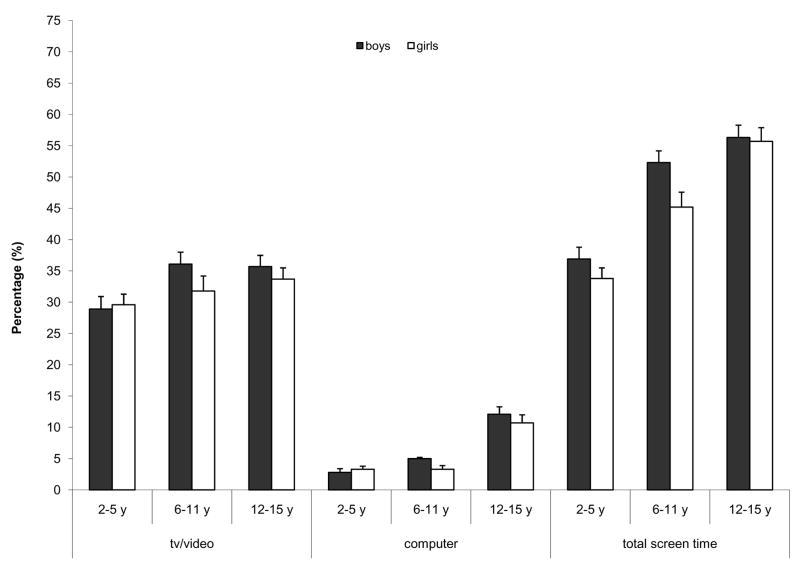
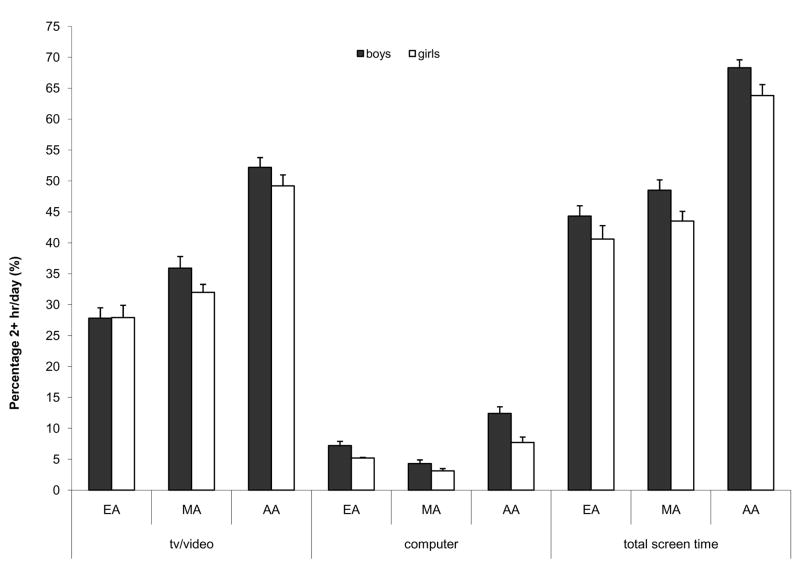
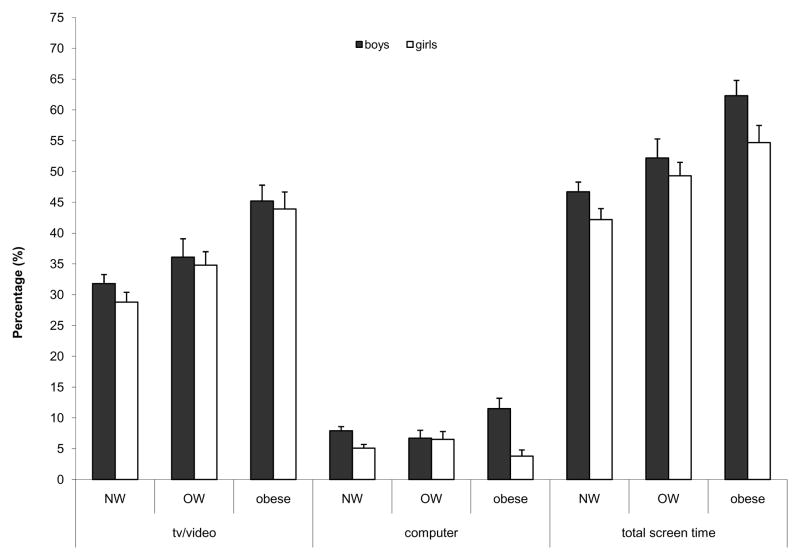
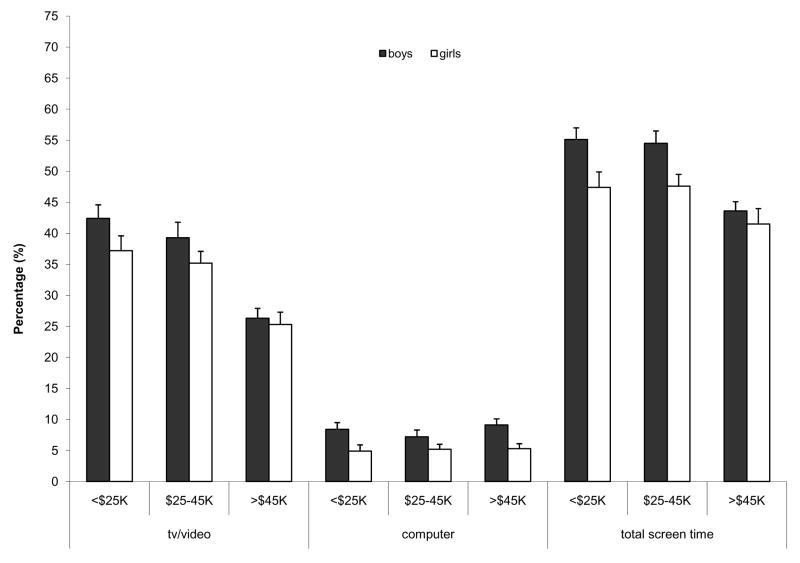
For all three categories of sedentary behavior, a higher proportion of boys spent ≥ 2 hours daily than girls (TV/video: 34.1 ± 1.3% versus 31.7 ± 1.4%; computer: 8.1 ± 0.6% versus 5.2 ± 0.6%; and total screen time: 49.4 ± 1.2% versus 45.0 ± 1.6%, in boys and girls, respectively). It appears there are also ethnic differences in the amount of time spent in TV/video, computer and total screen time (European American 42.5 ± 1.5%, Mexican American 46.1 ± 1.2%, African American 66.1 ± 1.1%), as well as age group (2–5 yr: 35.3 ± 1.5%, 6–11 yr: 49.1 ± 1.7%, 12–15 yr: 56.0 ± 1.7%), and BMI (normal weight: 44.6 ± 1.5%, overweight: 50.8 ± 2.1%, obese: 58.5 ± 2.0%) differences. A smaller proportion of those children living in homes with the highest household income spend ≥ 2 hours per day watching TV/video and in total screen time (<$25K: 51.4 ± 1.6%, $25–45K: 51.2 ± 1.6%, >$45K: 42.6 ± 1.5%). However, approximately the same proportion of children across middle and low income categories exceed ≥ 2 hours daily using the computer. The proportion of children watching ≥ 2 hours daily of TV/videos, computer, and total screen time by age group (Figure 2), ethnicity (Figure 3), BMI status (Figure 4), and household income (Figure 5) have been presented separately for boys and girls.
Figure 2.
Proportion (SE) of children and adolescents watching ≥ 2 hours per day of TV/video, computers and total screen time by age group (2 to 5 y, 6 to 11 y, and 12 to 15 y) in the U.S. National Health and Nutrition Examination Survey, 2001–06.
Figure 3.
Proportion (SE) of children and adolescents watching ≥ 2 hours per day of TV/video, computers and total screen time by ethnicity (African American (AA), Mexican American (MA), and European American (EA)) in the U.S. National Health and Nutrition Examination Survey, 2001–06.
Figure 4.
Proportion (SE) of children and adolescents watching ≥ 2 hours per day of TV/video, computers and total screen time by international BMI classification (normal weight (NW), overweight (OW), and obese) in the U.S. National Health and Nutrition Examination Survey, 2001–06.
Figure 5.
Proportion (SE) of children and adolescents watching ≥ 2 hours per day of TV/video, computers and total screen time by annual household income in the U.S. National Health and Nutrition Examination Survey, 2001–06.
More African American children spent ≥ 2 hours daily time in TV/video, computer, and total screen time than Mexican American and European American children. European American children had the lowest prevalence in each category and the difference (i.e., delta, Δ) between African American boys and European American boys for total screen time was 24.0% (68.3 vs. 44.3%) and for girls Δ was 23.2% (63.8 vs. 40.6%). The Δ between the oldest and youngest age groups for total screen time was 19.4% (56.3 vs. 36.9%) and 21.9% (55.7 vs. 33.8%), for boys and girls, respectively. For both boys and girls, a higher proportion of obese young people exceeded 2 hours of screen time than overweight and normal weight children and adolescents. The total screen time Δ was greater for boys (15.6% (62.3 vs. 46.7%) between obese and normal weight) than for girls (12.5% (54.7 vs. 42.2%) between obese and normal weight). In boys and girls, the lowest household income category (<$25K) had a higher prevalence of exceeding daily recommendations than the highest income category (>$45K). For the boys, the difference between the highest and lowest income categories was 11.5% (55.1 vs. 43.6%) and Δ was only 5.9% (47.4 vs. 41.5%) for the girls between the same categories.
Discussion
The primary findings of this study are descriptive and pertain to the prevalence of children in the U.S. engaging in sedentary screen time. From 2001 to 2006, the time spent in TV/video, computers, and total screen time does not appear to have changed; nor is there an observable difference in the preferences within total screen time (i.e., selecting computers over TV/videos). Over 47% of the children and adolescents in this nationally representative sample spent ≥ 2 hours per day total screen time which has predominantly driven by the high prevalence of children viewing ≥ 2 hours daily in TV/videos alone (33%). Differences in total screen time prevalence ≥ 2 hours daily were noted between genders (49% boys and 45% girls), age groups (2–5 yr: 35%, 6–11 yr: 49%, 12–15 yr: 56%), ethnicities (European American 43%, Mexican American 46%, African American 66%), international BMI classification groups (normal weight 45%, overweight 51%, obese 59%) and annual household income categories (<$25K: 51%, $25–45K: 51%, >$45K: 43%). It is worthy to note that children aged 2 to 11 years had a proxy report their sedentary behavior; the difference between self-report and parental-report may confound the age group results. However, child- and parent proxy- reported physical activity (28, 29) and television viewing (30) have been reported to be similar, especially in young children (29). However, parents may underestimate TV time (30) but avoid the social desirability bias of underestimating self-reported TV time, especially in overweight and obese youth (31).
A previous examination of time spent viewing only TV using NHANES 1988–1994 by Andersen et al. (14) reported that over 60% of children and adolescents aged 8 to 16 years spent ≥ 2 hours daily watching TV. Similar to our results, African American children in that study had the highest prevalence (approximately 75%) of watching ≥ 2 hours of daily TV (14). A difference between age groups was not noted; however, the age groups were smaller and focused on older (ages 8 to 16 years) children and adolescents. It appears that the prevalence of children spending ≥ 2 hours per day in TV time has decreased between Andersen et al.’s report and the current study (60% TV only (14) versus 33% TV/video). Some methodological differences such as the age of the participants and method of measurement (previous day versus average over past 30 days) preclude the conclusion that LTSB has decreased between these two studies. When looking at only TV/video time in our study the prevalence can also appear lower than the previous report since the use of computers was not included in NHANES 1988–1994. It is plausible that children are spending the same amount of time in screen time but with the number of households with computers rising from 51% in 1997 to 69% in 2001 and Internet becoming more available at home (27% in 1997 to 59% in 2001) (32), some children are switching from TV, videos, and DVDs to computer games and Internet surfing. A recent review noted that of those children with access to computers and video games, on average an additional 30 and 45 minutes per day was spent in sedentary behavior (33). With rapidly changing technology and behavior of children, maintaining questionnaires that accurately capture all facets of sedentary behavior will be a challenge.
A recent literature review of screen-based media use of 7–18 year old males and females, reported that 63% of youth spent ≤2 hours/day and 33% spent ≥4 hours/day in watching TV (33). This may appear discrepant with our report (47% ≥2 hours/day in screen time), but the mean minutes/day reported in the literature review was 159 min/day (over 2.5 hours/day) and the median (minimum, maximum) was 171 min/day (102, 206) (33). Since NHANES used categorical responses for sedentary behavior, measures of central tendency cannot be calculated and compared directly; furthermore the different classification of time (i.e., ≥ or ≤ 2 hours/day) makes direct comparison between the two studies difficult. Project EAT was a large study (n ≈ 4,800) conducted with U.S. middle and high school students (mean age 14.9 years) in which participants self-reported sedentary screen time (24). Similar to our findings, boys spent significantly more time each day in sedentary behavior than girls (2.8 vs. 2.6 hours daily). Furthermore, differences between ethnic groups were similar such that African American adolescents watched more TV than European American adolescents; approximately 15 and 45 minutes more per day for boys and girls, respectively (24). Another examination of 180 children reported that daily leisure screen time increased with age from nearly four hours per day in 6 to 7 years olds to 6.3 hours daily in 12 to 13 year olds (34). Taken together, these findings are of importance to understand where children and adolescents in the U.S. stand currently with regard to sedentary behavior.
As our society becomes more dependent on media which is becoming ubiquitously integrated into daily life, developing an understanding of the impact of different types of sedentary behavior on the health of children is critical. Several studies have reported that higher levels of leisure-time sedentary behavior are associated with higher levels of overweight, obesity (14, 15, 35) and disease risk (9–11), and that there are perhaps gender differences in leisure-time sedentary behavior (15, 35). Further research will need to examine different types of sedentary behaviors and the potential compensatory influence of physical activity. In the limited studies conducted to date, productive time has not shown the same negative impacts as leisure screen time; the exact mechanism is not thoroughly understood (12). In recent years, active video games such as Nintendo® Wii™ Fit and Dance Dance Revolution, have become popular with children in addition to, or possibly in lieu of, traditional seated, passive video games. A few studies have examined active video games and shown that they elicit higher levels of physical activity and energy expenditure than traditional video games but that they are not equivalent to actually playing the sport or game (36–38). More research is necessary to determine the health and body weight impact of active video game playing, as well as adherence to these more active forms of entertainment. As they become more popular and prevalent, further research will need to discriminate between passive and active computer and video games in addition to productive and leisure sedentary pursuits.
The strengths and limitations of this study warrant discussion. The strengths of these analyses include the nationally representative sample of children and the rigor with which the NHANES are conducted and managed. Additional strengths include the combination of several years of NHANES data to examine profiles and prevalence of sedentary behavior over time. A limitation is that the questions do not separate computer usage as leisure (i.e., surfing the Internet) or productive (i.e., homework preparation and research) and video game usage was not included at all in the questions and therefore the analyses.
In conclusion, a large percentage of U.S. children and adolescents are exceeding 2 hours/day of sedentary behavior, specifically with large amounts of TV/videos, each day. Further, it appears there are gender, ethnic, age, BMI, and household income differences in the amount of time spent in sedentary behavior (i.e., total screen time). This is of concern since emerging research has highlighted the risks associated with extended bouts of sedentary time including increased risk for overweight and obesity and associated health risk factors. With TV/video and computer technology infusing nearly every aspect of daily life, a purposeful and concerted effort is needed to decrease the amount of daily time spent in sedentary pursuits and to develop thorough and appropriate measures to accurately capture leisure and productive sedentary pursuits above and beyond screen time. The advent of the next generation of active video games is a step in this direction; children can play video games yet they are not sitting sedentary for extended bouts of time.
Acknowledgments
C. Bouchard is partially supported by the George A. Bray Chair in Nutrition. P.T. Katzmarzyk is partially supported by the Louisiana Public Facilities Authority Endowed Chair in Nutrition and T.S. Church is partially funded by the John S. McIlhenny Endowed Chair in Health Wisdom. C.K. Martin is partially supported by National Institutes of Healthgrant K23 DK068052-01. R.L. Newton is partially support by National Institutes of Health grant 5K01HL88723-2. We would also like to thank Emily F. Mire for her assistance in data management and analysis.
Footnotes
Conflicts of interest: none
References
- 1.Hamilton MT, Hamilton DG, Zderic TW. Role of low energy expenditure and sitting in obesity, metabolic syndrome, type 2 diabetes, and cardiovascular disease. Diabetes. 2007;56:2655–67. doi: 10.2337/db07-0882. [DOI] [PubMed] [Google Scholar]
- 2.Hu FB, Li TY, Colditz GA, Willett WC, Manson JE. Television watching and other sedentary behaviors in relation to risk of obesity and type 2 diabetes mellitus in women. JAMA. 2003;289:1785–91. doi: 10.1001/jama.289.14.1785. [DOI] [PubMed] [Google Scholar]
- 3.Dunstan DW, Salmon J, Owen N, et al. Associations of TV viewing and physical activity with the metabolic syndrome in Australian adults. Diabetologia. 2005;48:2254–61. doi: 10.1007/s00125-005-1963-4. [DOI] [PubMed] [Google Scholar]
- 4.Hu FB, Leitzmann MF, Stampfer MJ, Colditz GA, Willett WC, Rimm EB. Physical activity and television watching in relation to risk for type 2 diabetes mellitus in men. Arch Intern Med. 2001;161:1542–8. doi: 10.1001/archinte.161.12.1542. [DOI] [PubMed] [Google Scholar]
- 5.Matthews CE, Jurj AL, Shu XO, et al. Influence of exercise, walking, cycling, and overall nonexercise physical activity on mortality in Chinese women. Am J Epidemiol. 2007;165:1343–50. doi: 10.1093/aje/kwm088. [DOI] [PubMed] [Google Scholar]
- 6.Bertrais S, Beyeme-Ondoua JP, Czernichow S, Galan P, Hercberg S, Oppert JM. Sedentary behaviors, physical activity, and metabolic syndrome in middle-aged French subjects. Obes Res. 2005;13:936–44. doi: 10.1038/oby.2005.108. [DOI] [PubMed] [Google Scholar]
- 7.Ford ES, Kohl HW, 3rd, Mokdad AH, Ajani UA. Sedentary behavior, physical activity, and the metabolic syndrome among U.S. adults. Obes Res. 2005;13:608–14. doi: 10.1038/oby.2005.65. [DOI] [PubMed] [Google Scholar]
- 8.Gao X, Nelson ME, Tucker KL. Television viewing is associated with prevalence of metabolic syndrome in Hispanic elders. Diabetes Care. 2007;30:694–700. doi: 10.2337/dc06-1835. [DOI] [PubMed] [Google Scholar]
- 9.Ekelund U, Brage S, Froberg K, et al. TV viewing and physical activity are independently associated with metabolic risk in children: the European Youth Heart Study. PLoS Med. 2006;3:e488. doi: 10.1371/journal.pmed.0030488. [DOI] [PMC free article] [PubMed] [Google Scholar]
- 10.Mark AE, Janssen I. Relationship between screen time and metabolic syndrome in adolescents. J Public Health (Oxf) 2008;30:153–60. doi: 10.1093/pubmed/fdn022. [DOI] [PubMed] [Google Scholar]
- 11.Sardinha LB, Andersen LB, Anderssen SA, et al. Objectively measured time spent sedentary is associated with insulin resistance independent of overall and central body fat in 9- to 10-year-old Portuguese children. Diabetes Care. 2008;31:569–75. doi: 10.2337/dc07-1286. [DOI] [PubMed] [Google Scholar]
- 12.Feldman DE, Barnett T, Shrier I, Rossignol M, Abenhaim L. Is physical activity differentially associated with different types of sedentary pursuits? Arch Pediatr Adolesc Med. 2003;157:797–802. doi: 10.1001/archpedi.157.8.797. [DOI] [PubMed] [Google Scholar]
- 13.Healy GN, Dunstan DW, Salmon J, Shaw JE, Zimmet PZ, Owen N. Television time and continuous metabolic risk in physically active adults. Med Sci Sports Exerc. 2008;40:639–45. doi: 10.1249/MSS.0b013e3181607421. [DOI] [PubMed] [Google Scholar]
- 14.Andersen RE, Crespo CJ, Bartlett SJ, Cheskin LJ, Pratt M. Relationship of physical activity and television watching with body weight and level of fatness among children: results from the Third National Health and Nutrition Examination Survey. JAMA. 1998;279:938–42. doi: 10.1001/jama.279.12.938. [DOI] [PubMed] [Google Scholar]
- 15.Eisenmann JC, Bartee RT, Smith DT, Welk GJ, Fu Q. Combined influence of physical activity and television viewing on the risk of overweight in US youth. Int J Obes. 2008;32:613–8. doi: 10.1038/sj.ijo.0803800. [DOI] [PubMed] [Google Scholar]
- 16.Hume C, Singh A, Brug J, van Mechelen W, Chinapaw M. Dose-response associations between screen time and overweight among youth. Int J Pediatr Obes. 2008:1–4. doi: 10.1080/17477160802199992. [DOI] [PubMed] [Google Scholar]
- 17.Rey-Lopez JP, Vicente-Rodriguez G, Biosca M, Moreno LA. Sedentary behaviour and obesity development in children and adolescents. Nutr Metab Cardiovasc Dis. 2008;18:242–51. doi: 10.1016/j.numecd.2007.07.008. [DOI] [PubMed] [Google Scholar]
- 18.Tortolero SR, Goff DC, Jr, Nichaman MZ, Labarthe DR, Grunbaum JA, Hanis CL. Cardiovascular risk factors in Mexican-American and non-Hispanic white children: The Corpus Christi Child Heart Study. Circulation. 1997;96:418–23. doi: 10.1161/01.cir.96.2.418. [DOI] [PubMed] [Google Scholar]
- 19.Freedman DS, Serdula MK, Srinivasan SR, Berenson GS. Relation of circumferences and skinfold thicknesses to lipid and insulin concentrations in children and adolescents: the Bogalusa Heart Study. Am J Clin Nutr. 1999;69:308–17. doi: 10.1093/ajcn/69.2.308. [DOI] [PubMed] [Google Scholar]
- 20.Dietz WH. Health consequences of obesity in youth: childhood predictors of adult disease. Pediatrics. 1998;101:518–25. [PubMed] [Google Scholar]
- 21.Weiss R, Kaufman FR. Metabolic complications of childhood obesity: identifying and mitigating the risk. Diabetes Care. 2008;31 Suppl 2:S310–6. doi: 10.2337/dc08-s273. [DOI] [PubMed] [Google Scholar]
- 22.Must A, Jacques PF, Dallal GE, Bajema CJ, Dietz WH. Long-term morbidity and mortality of overweight adolescents. A follow-up of the Harvard Growth Study of 1922 to 1935. N Engl J Med. 1992;327:1350–5. doi: 10.1056/NEJM199211053271904. [DOI] [PubMed] [Google Scholar]
- 23.Ogden CL, Carroll MD, Curtin LR, McDowell MA, Tabak CJ, Flegal KM. Prevalence of overweight and obesity in the United States, 1999–2004. JAMA. 2006;295:1549–55. doi: 10.1001/jama.295.13.1549. [DOI] [PubMed] [Google Scholar]
- 24.Utter J, Neumark-Sztainer D, Jeffery R, Story M. Couch potatoes or french fries: are sedentary behaviors associated with body mass index, physical activity, and dietary behaviors among adolescents? J Am Diet Assoc. 2003;103:1298–305. doi: 10.1016/s0002-8223(03)01079-4. [DOI] [PubMed] [Google Scholar]
- 25.American Academy of Pediatrics. Children, adolescents, and television. Pediatrics. 2001;107:423–6. doi: 10.1542/peds.107.2.423. [DOI] [PubMed] [Google Scholar]
- 26.Centers for Disease Control and Prevetion. National Health and Nutrition Examination Survey. Hyattsville, MC: United State Department of Health and Human Services; 2007. [Google Scholar]
- 27.Cole TJ, Bellizzi MC, Flegal KM, Dietz WH. Establishing a standard definition for child overweight and obesity worldwide: international survey. BMJ. 2000;320:1240–3. doi: 10.1136/bmj.320.7244.1240. [DOI] [PMC free article] [PubMed] [Google Scholar]
- 28.Dowda M, Pate RR, Sallis JF, et al. Agreement between student-reported and proxy-reported physical activity questionnaires. Pediatr Exerc Sci. 2007;19:310–8. doi: 10.1123/pes.19.3.310. [DOI] [PubMed] [Google Scholar]
- 29.Economos CD, Sacheck JM, Kwan Ho Chui K, et al. School-based behavioral assessment tools are reliable and valid for measurement of fruit and vegetable intake, physical activity, and television viewing in young children. J Am Diet Assoc. 2008;108:695–701. doi: 10.1016/j.jada.2008.01.001. [DOI] [PubMed] [Google Scholar]
- 30.Bryant MJ, Lucove JC, Evenson KR, Marshall S. Measurement of television viewing in children and adolescents: a systematic review. Obes Rev. 2007;8:197–209. doi: 10.1111/j.1467-789X.2006.00295.x. [DOI] [PubMed] [Google Scholar]
- 31.Sithole F, Veugelers PJ. Parent and child reports of children’s activity. Health Rep. 2008;19:19–24. [PubMed] [Google Scholar]
- 32.Foundation AEC. Kids Count Data Book. Baltimore, MD: Annie E. Casey Foundation; 2008. [Google Scholar]
- 33.Marshall SJ, Gorely T, Biddle SJ. A descriptive epidemiology of screen-based media use in youth: a review and critique. J Adolesc. 2006;29:333–49. doi: 10.1016/j.adolescence.2005.08.016. [DOI] [PubMed] [Google Scholar]
- 34.Jordan AB, Hersey JC, McDivitt JA, Heitzler CD. Reducing children’s television-viewing time: a qualitative study of parents and their children. Pediatrics. 2006;118:e1303–10. doi: 10.1542/peds.2006-0732. [DOI] [PubMed] [Google Scholar]
- 35.Laurson KR, Eisenmann JC, Welk GJ, Wickel EE, Gentile DA, Walsh DA. Combined influence of physical activity and screen time recommendations on childhood overweight. J Pediatr. 2008;153:209–14. doi: 10.1016/j.jpeds.2008.02.042. [DOI] [PubMed] [Google Scholar]
- 36.Graves L, Stratton G, Ridgers ND, Cable NT. Energy expenditure in adolescents playing new generation computer games. Br J Sports Med. 2008;42:592–4. [PubMed] [Google Scholar]
- 37.Maddison R, Mhurchu CN, Jull A, Jiang Y, Prapavessis H, Rodgers A. Energy expended playing video console games: an opportunity to increase children’s physical activity? Pediatr Exerc Sci. 2007;19:334–43. doi: 10.1123/pes.19.3.334. [DOI] [PubMed] [Google Scholar]
- 38.Ni Mhurchu C, Maddison R, Jiang Y, Jull A, Prapavessis H, Rodgers A. Couch potatoes to jumping beans: A pilot study of the effect of active video games on physical activity in children. Int J Behav Nutr Phys Act. 2008;5:8. doi: 10.1186/1479-5868-5-8. [DOI] [PMC free article] [PubMed] [Google Scholar]


