

Abstract
High-resolution manometry capable of pressure monitoring from the pharynx to the stomach together with pressure topography plotting represents an unquestionable evolution in oesophageal manometry. However, with this advanced technology come challenges and one of those is devising the optimal scheme to apply high-resolution oesophageal pressure topography (HROPT) to the clinical evaluation of patients. The first iteration of the Chicago classification was based on a systematic analysis of motility patterns in 75 control subjects and 400 consecutive patients. This review summarizes the analysis process as it has evolved. Individual swallows are analysed in a stepwise fashion for the morphology of the oesophagogastric junction (OGJ), the extent of OGJ relaxation, the propagation velocity of peristalsis, the vigour of the peristaltic contraction, and abnormalities of intrabolus pressure utilizing metrics that have now been customized to HROPT. These results are then synthesized into a comprehensive diagnosis that, although based on conventional manometry criteria, is also customized to HROPT measures. The resultant classification objectifies the identification of three unique subtypes of achalasia. Additionally, it provides enhanced detail in the description of distal oesophageal spasm, nutcracker oesophagus subtypes, and OGJ obstruction. It is our expectation that modification of this classification scheme will continue to occur and this should further clarify the utility of pressure topography plotting in assessing oesophageal motility disorders.
Keywords: achalasia, distal oesophageal spasm, high-resolution manometry, nutcracker oesophagus
INTRODUCTION
The concept of high-resolution oesophageal manometry (HRM) is to employ a sufficient number of pressure sensors within the oesophagus such that intraluminal pressure can be monitored as a continuum much as time is viewed as a continuum in line tracings of conventional manometry. Basically, this means having pressure sensors spaced about 1 cm apart. At that spacing, pressure values between sensors can be estimated by interpolation without significant loss of contractile information.1 When coupled with sophisticated algorithms to display the manometric data as pressure topography plots, HRM permits the visualization of oesophageal contractility with isobaric conditions among sensors indicated by isocoloric regions on the pressure topography plots. Fig. 1 depicts the typical pressure topography of both sphincters and the intervening oesophagus during a normal swallow; the relative timing of sphincter relaxation and segmental contraction, and the position of the transition zone are all readily demonstrated.
Figure 1.
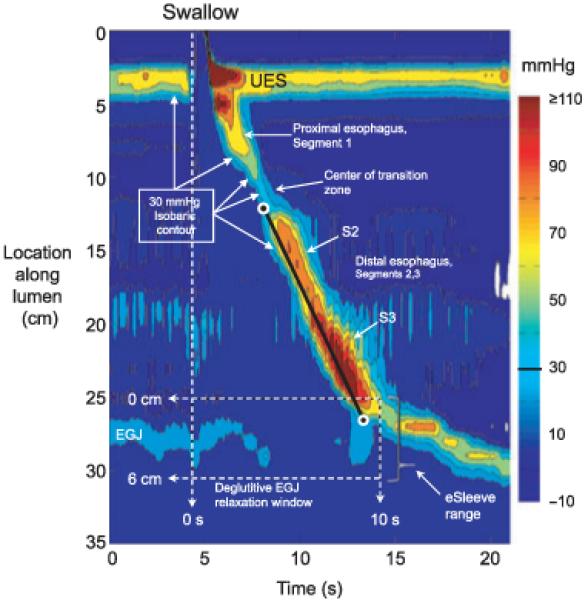
Typical swallow pressure topography spanning from the pharynx (locations 0–2 cm) to stomach (locations 29–35 cm) of a normal subject with normal peristalsis and normal oesophagogastric junction (OGJ) relaxation. The transition zone, demarcating the end of the proximal oesophageal segment (striated muscle) and the beginning of the distal oesophageal segment (smooth muscle), is readily identified as a pressure minimum. Note that the distal segment, in fact, has three sub-segments within it, each with an identifiable pressure peak. The most distal sub-segment, the lower oesophageal sphincter, contracts at the termination of peristalsis and then descends back to the level of the crural diaphragm as the period of swallow-related oesophageal shortening ends. The onset of the deglutitive relaxation window is at the onset of upper sphincter relaxation while the offset is 10 s later. The spatial domain within which OGJ relaxation is assessed (the eSleeve™ range) is user defined, spanning at least 6 cm, depending on the extent of oesophageal shortening after the swallow. The characteristics of the distal oesophageal contraction are defined by the isobaric contour tool set at 30 mmHg (highlighted with arrows). The isobaric contour can then be utilized to measure the contractile front velocity (CFV) and identify breaks in the contractile wavefront. The CFV is the slope of the line connecting points (black circles) on the 30 mmHg isobaric contour at the proximal margin and the distal margin of the smooth muscle oesophagus (CFV = 3 cm s−1).
When confronted with a paradigm shift such as HRM imaged in pressure topography plots, it is almost reflexive that practitioners ask, why bother? In answer to this, high-resolution oesophageal pressure topography (HROPT) offers several basic technical advantages over conventional manometry: (i) the technique lends itself to standardized objective measures of interpretation, (ii) it is easier and quicker to perform studies of uniform high quality, and (iii) the process of interpretation is more intuitive and more easily learned by trainees naïve to manometric formats.2 Thus, with the widespread adoption of HRM and pressure topography display methodology that is currently underway, there is a need to reconsider the classification of oesophageal motility that was developed for conventional manometry systems.
Some clinicians have reacted to this challenge by transforming the unfamiliar pressure topography displays back to conventional line tracings and then applying a conventional analysis. Although this represents a practical solution, it is in essence, dumbing down the technology, and certainly abandons whatever gains may be achieved from the topographic plots. The alternative approach is to build a classification scheme based on pressure topography plots that parallels conventional manometric classification but enhances it based on the strengths of the technology.
THE HROPT CLASSIFICATION SCHEME
HRM can precisely quantify the contractility of the oesophagus and its sphincters. However, condensing the vast information set obtained during a patient study into the diagnosis of an oesophageal motility disorder pertinent to clinical practice is a daunting task. In pursuit of that objective, there have been several recent publications on normative HRM data and proposed classifications pertinent to the interpretation of HRM studies.3-7 The most substantial of these was a comprehensive characterization of distal oesophageal HROPT data in 75 normal subjects and 400 patients using analysis paradigms unique to pressure topography interpretation.6 That classification has been referred to as the Chicago classification in subsequent reviews.8,9 However, even in these early reviews, the need was felt for subtle modifications, a process that has subsequently continued (and will continue) in the face of wider discussion of these findings with research groups around the world.
Currently, the classification scheme developed has been focused on the HRM system developed by Sierra Scientific Instruments Inc. (Los Angeles, CA, USA). Normative data have been derived using the Manoscan™ 36 channel circumferential solid-state hardware and Manoview™analysis software (Sierra Scientific Instruments Inc.). All of the analysis paradigms described in this manuscript are incorporated in the current version of ManoView™ software (version 2.0; Sierra Scientific Instruments Inc.) and Solar GI HRM (Medical Measurement Systems, Enschede, The Netherlands). Although numerical cutoffs defining normality may change with the use of alternative hardware, the principles of analysis described here are intended to generalize to any HRM system.
ESSENTIAL NOMENCLATURE OF HROPT
It is inevitable that HROPT employ a new vocabulary. While it is desirable to minimize this, an irreducible minimum exists. The Appendix summarizes some of the HROPT terms used throughout this manuscript, many of which appear repeatedly throughout the HROPT literature. Fig. 1 is a pressure topography plot, the foundation of the HRM display and analysis methodology. Note that Fig. 1 has an isobaric contour line drawn to accentuate every 15 mmHg increase in pressure amplitude spanning from 0 to 110 mmHg; as the pressure magnitude increases, the isobaric contour lines isolate progressively smaller regions on the pressure topography plot. As the 30 mmHg isobaric contour line is the most relevant for classification schemes, it is highlighted. Many of the other terms in Tables 1 & 2 are also illustrated in Fig. 1 including the transition zone, the deglutitive oesophagogastric junction (OGJ) relaxation window, the contractile front velocity (CFV), and the subsegments within the distal oesophageal contractile segment.
Table 1.
Comparison of OGJ relaxation measures in the detection of 62 cases of well-defined achalasia
| OGJ relaxation measure | Achalasia sensitivity (%) | False positives | False negatives (%) |
|---|---|---|---|
| Nadir pressure, conventional (≥7 mmHg) |
52 | 0 | 48 |
| Nadir pressure, eSleeve™ ≥10 mmHg) |
69 | 0 | 31 |
| eSleeve™, 3-s nadir (≥15 mmHg) |
94 | 0 | 6 |
| eSleeve™, IRP (≥15 mmHg) |
97 | 0 | 3 |
The nadir pressure in conventional terms was the lowest pressure recorded from the sensor best centred on the OGJ, whereas the nadir pressure in HRM terms took the eSleeve™ nadir occurring within the relaxation window. Although the HRM method is marginally better because it at least accounts for OGJ movement, both of these exhibited very poor sensitivity for detecting achalasia because they fail to detect the subset of achalasics characterized by brief periods of OGJ relaxation to within the normal range. Of the two complex metrics that required persistence of OGJ relaxation, the IRP was marginally better than the 3-s nadir because it was less susceptible to crural diaphragm artefact during rapid respiration. Normal values were determined from 75 asymptomatic control subjects. Adapted from Ref. (5). OGJ, oesophagogastric junction; IRP, integrated relaxation pressure; HRM, high-resolution manometry.
Table 2.
OGJ pressure during normal respiration in a set of 75 normal volunteers
| Relative to atmospheric pressure | |||
|---|---|---|---|
| Expiration† | Inspiration† | Inspiratory change† |
|
| OGJ pressure (mmHg) |
23.9 (9.3)* | 40.9 (12.3) | +16.9 (8.2) |
| Oesophageal pressure (mmHg) |
0.3 (2.3)* | −4.7 (2.3) | −5.0 (1.8) |
| Gastric pressure mmHg) |
5.5 (2.1)* | 8.6 (2.3) | +3.1 (1.0) |
| Relative to gastric pressure | ||
|---|---|---|
| Mean | 2 SD range | |
| Expiratory OGJ pressure (mmHg) |
18.4 | 4.0–32.8 |
| Inspiratory OGJ pressure (mmHg) |
32.3 | 12.3–52.3 |
Modified from Ref. (3).
P < 0.05 vs inspiration
all values expressed as mean (SD). OGJ, oesophagogastric junction.
THE ALGORITHM OF ANALYSIS USING PRESSURE TOPOGRAPHY PARAMETERS
First and foremost, some patients exhibit abnormal OGJ pressure morphology and impaired deglutitive OGJ relaxation (Appendix), each of which can profoundly affect peristalsis and pressure topography within the distal oesophagus. These also impart functional significance because oesophageal bolus transport depends on the balance of resistance through the OGJ, intrabolus pressure (IBP), and oesophageal closure pressure behind the bolus.10,11 Hence, it is illogical to analyse peristaltic function without first considering the OGJ. Recognizing this, we apply a stepwise HROPT analysis algorithm that first characterizes patients by OGJ pressure morphology (presence of hiatus hernia) and the presence or absence of impaired deglutitive OGJ relaxation. The implications of abnormal OGJ pressure morphology on the classification scheme have not yet been fully defined, but data support the concept that there is a strong interaction between OGJ structure and function.12 The consequences of impaired deglutitive OGJ relaxation are more obvious, leading to increased distal oesophageal IBP.11,12 Hence, although abnormalities of OGJ pressure morphology will likely modify subsequent diagnostic categories, the first branch point in patient classification is of normal or impaired OGJ relaxation because this consistently impacts on function.
OGJ relaxation
Incomplete deglutitive OGJ relaxation is an essential feature in the diagnosis of achalasia and achalasia is not only the best-defined oesophageal motor disorder, but also the one with the most specific treatments. These features impart great clinical relevance on the accurate detection of incomplete deglutitive OGJ relaxation. Despite this cardinal significance, there is no accepted convention for defining incomplete deglutitive OGJ relaxation with conventional manometry. Furthermore, numerous potential confounding factors exist including crural diaphragm (CD) contraction during respiration, deglutitive oesophageal shortening, hiatal hernia, IBP within the OGJ, sphincter radial asymmetry, and movement of the recording sensor relative to the OGJ.13 With HROPT, this situation is greatly improved.14 Pressure topography plotting facilitates accurate localization of the OGJ and the deglutitive relaxation window as illustrated in Figs 1 and 2. An exploratory study comparing criteria for detecting impaired deglutitive OGJ relaxation within that relaxation window in a large group of patients and control subjects concluded that the optimal measure for quantifying deglutitive relaxation was the integrated relaxation pressure (IRP), with normal being defined as less than 15 mmHg (Table 1).5 The IRP is amenable to automated calculation and, conceptually, it is the lowest average pressure for four contiguous or non-contiguous seconds within the relaxation window (Fig. 2). This single measure of deglutitive OGJ relaxation exhibited 98% sensitivity and 96% specificity for distinguishing well-defined achalasia patients from control subjects and patients with other diagnoses.5
Figure 2.
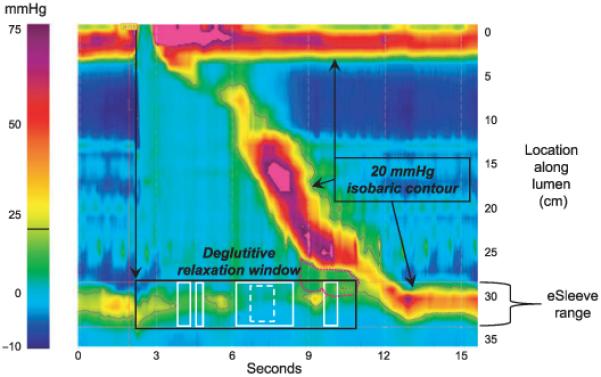
The integrated relaxation pressure (IRP) is a more complex metric of oesophagogastric junction (OGJ) relaxation than a simple end-expiratory measurement of OGJ pressure after a swallow. The IRP requires persistence of OGJ relaxation for 4 s within the relaxation window (black box) but the actual time periods that go into its calculation (solid white boxes) can be contiguous or, as in this example, non-contiguous. By finding the periods of lowest pressure within the relaxation window, the IRP reduces, but does not eliminate, influences of intrabolus pressure (IBP) (pink dotted contour) or crural diaphragm (CD) contractions. The black isobaric contour is set at 20 mmHg. Note that a purer measure of intrinsic LOS relaxation would isolate a briefer time period within the relaxation window and isolate times least influenced by IBP and CD contractility. For example, a 1-s IRP (dashed box) in this example is 7.2 mmHg compared to the standard (4-s) IRP of 9.6 mmHg. The 4-s IRP was selected as the standard metric because it best differentiated the impaired OGJ relaxation in achalasia from non-achalasic individuals.
As illustrated in Fig. 2, the IRP is not synonymous with nadir lower oesophageal sphincter (LOS) relaxation pressure. Other variables, especially IBP within the OGJ and CD contractility can also affect it. Thus, the IRP measurement is virtually always greater than end-expiratory nadir LOS relaxation pressure as it represents a comprehensive standardized assessment of the obstructing pressure within the OGJ following a swallow, regardless of what that obstructing pressure is attributable to. On the other hand, the best estimate of maximal relaxation of the intrinsic LOS would utilize a briefer time window and focus on the period within the relaxation window least affected by IBP or the CD. For example, the 1-s IRP illustrated in Fig. 2 (broken white box) is 7.2 mmHg compared with the 4-s IRP value of 9.6 mmHg.
Apart from improving the sensitivity of manometry in the detection of achalasia, HROPT has also defined a clinically relevant sub-classification of achalasia.15 A diagnosis of achalasia requires both aperistalsis and impaired deglutitive OGJ relaxation. In its most obvious form, this occurs in the setting of oesophageal dilatation with negligible pressurization within the oesophagus (Fig. 3A). However, despite there being no peristalsis, there can still be substantial pressurization within the oesophagus. In fact, a very common pattern encountered is achalasia with oesophageal compression and pan-oesophageal pressurization (Fig. 3B). The other, less common pattern is of spastic achalasia in which there is a spastic contraction within the distal oesophageal segment (Fig. 3C,D). In a series of 99 consecutive patients with newly diagnosed achalasia, 21 had the pattern shown in Fig. 3A, 49 the pattern in Fig. 3B, and 29 the pattern in Fig. 3C.15 Logistic regression analysis found pan-oesophageal pressurization (Fig. 3B) to be a predictor of positive treatment response while spastic achalasia (Fig. 3C) and pretreatment oesophageal dilatation were predictive of negative treatment response. Adopting these sub-classifications will likely strengthen future prospective studies of achalasia management.
Figure 3.

Achalasia subtypes are distinguished by three distinct manometric patterns of oesophageal body contractility. In classic achalasia (Panel A), there is no significant pressurization within the body of the oesophagus and impaired oesophagogastric junction relaxation (integrated relaxation pressure of 42 mmHg in this example). Panel B represents a swallow from a patient with the ‘achalasia with compression’ subtype exhibiting rapid pan-oesophageal pressurization. Panel C illustrates a pressure topography plot typical of spastic achalasia. Although this swallow is also associated with rapidly propagated pressurization, the pressurization is attributable to an abnormal lumen obliterating contraction. The three dimensional rendering of these pressure data (Panel D) illustrates the peaks and valleys of that spastic contraction and this swallow would likely appear as a rosary-bead pattern on fluoroscopy. Modified from: Pandolfino JE, Kwiatek MA, Nealis T, Bulsiewicz W, Post J, Kahrilas PJ. Achalasia: a new clinically relevant classification by high-resolution manometry. Gastroenterology 2008; 135: 1526.
OGJ morphology
Both the LOS and the surrounding CD contribute to intraluminal OGJ pressure.16,17 The CD component is most evident during inspiration but probably contributes a minor component to OGJ pressure during expiration as well.18 Thus, there are two major confounding variables in describing OGJ intraluminal pressure: phase of the respiratory cycle and the relative positions of the LOS and the CD. No consensus was ever achieved with conventional manometry on how to deal with either of these variables.19 In fact, there was generally little recognition of the OGJ as a complex sphincter, instead simply referring to it as the LOS. With HROPT, the sphincteric contributions of the CD and LOS become somewhat obvious and the relative localization of the LOS and CD elements define OGJ morphologic subtypes (Fig. 4). The magnitude of CD augmentation of OGJ pressure during normal respiration is also readily quantified. A retrospective analysis of the relationship between these attributes of OGJ pressure topography and gastro-oesophageal reflux disease (GORD) found that GORD patients had significantly greater CD-LOS separation compared with either controls or non-GORD patients.20 GORD patients also had significantly less inspiratory CD augmentation compared with controls or non-GORD patients. Furthermore, in a logistic regression model, only inspiratory augmentation was found to have a significant independent association with GORD, suggesting that CD impairment was the mediator of both the hiatus hernia and LOS hypotension effects.
Figure 4.

Pressure topography plots of oesophagogastric junction (OGJ) pressure morphology subtypes primarily distinguished by the extent of lower oesophageal sphincter-crural diaphragm (LOS-CD). separation during several respiratory cycles. The pressure scale is shown at the right. Instantsof peak inspiration are marked I with mid expiration (E) indicated midway between inspirations. The locus of the respiratory inversion point (RIP) is indicated by a horizontal dashed line. Type I is characterized by complete overlap of the CD and the LOS. The RIP lies at the proximal margin of the OGJ. Type II is characterized by minimal, but discernible, LOS-CD separation, but the nadir pressure between the LOS and CD was still greater than gastric pressure. The RIP is within the OGJ at the proximal margin of the CD. OGJ type III is the high-resolution oesophageal pressure topography signature of hiatus hernia. Two subtypes are discernible, IIIa and IIIb, with the distinction being that the respiratory inversion point was proximal to the CD with IIIa and proximal to the LOS in IIIb. The shift in respiratory inversion point is likely indicative of a grossly patulous hiatus, open throughout the respiratory cycle. Modified from Ref. (20).
Finally, dynamic HROPT studies during reflux monitoring revealed that this is not a static situation.21 Rather, GORD patients oscillated between types I and II OGJ conformations. Reflux events preferentially occurred during the periods of type II conformation with a small separation between the two sphincters.21 Paradoxically, in contrast to the findings related to the CD and OGJ morphology, it is less clear that any measure of basal OGJ pressure has much significance.
Pressure topography parameters of the distal oesophageal segment contraction
Following the analysis of the OGJ, a swallow is further categorized by the characteristics of the distal oesophageal contraction. This analysis is largely facilitated by the generation of a pressure topography plot highlighting the 30 mmHg isobaric contour and recognizing well-defined patterns of peristaltic contraction and IBP. Under circumstances of normal deglutitive OGJ relaxation, the 30 mmHg pressure threshold provides a reliable means of differentiating IBP from luminal closure pressure, thereby delineating the wavefront of the peristaltic contraction.10 It is also the best accepted peristaltic pressure threshold for predicting bolus clearance.22 Contractile front velocity is calculated from the 30 mmHg isobaric contour plots by calculating the slope of the line connecting the 30 mmHg isobaric contour at the proximal margin of S2 and the distal margin of the S3 (Fig. 1). From an analysis of 75 normal subjects, the upper limit of normal (95th percentile) for mean CFV is 4.5 cm s−1.4 From conventional manometry, a contractile velocity of >8 cm s−1 is indicative of a spastic contraction. This threshold also defines a spastic contraction in HROPT terms, now using the CFV as the defining metric (Table 3). The clinical significance of a CFV between 4.5 and 8 cm s−1 is unclear.
Table 3.
Classification of individual swallows based on pressure topography criteria
| Distal segment contraction (referenced to atmospheric pressure) | |
|---|---|
| Classification | Criteria |
| Normal | <3 cm defect in the 30 mmHg isobaric contour distal to the TZ CFV < 8 cm s−1, IBP < 15 mmHg, and DCI < 5000 mmHg s−1 cm−1 |
| Hypotensive peristalsis |
Normal appearing wavefront propagation with a ≥3 cm defect in the 30 mmHg isobaric contour distal to the TZ |
| Absent peristalsis |
No propagating contractile wavefront and minimal (<3 cm) contractile activity or pressurization greater than the 30 mmHg isobaric contour |
| Hypertensive peristalsis |
Normal appearing wavefront propagation with a DCI > 5000 mmHg s−1 cm−1 |
| Spasm | Rapidly propagated contraction (CFV ≥ 8 cm s−1) |
| Elevated IBP | IBP > 15 mmHg compartmentalized between the OGJ and the peristaltic wavefront |
| Pan-oesophageal pressurization |
Oesophageal pressurization from the UOS to the OGJ with >30 mmHg IBP |
TZ, transition zone; CFV, contractile front velocity; DCI, distal contractile integral; IBP, intrabolus pressure; UOS, upper oesophageal sphincter.
Although the CFV is easily definable in the circumstance of normal OGJ relaxation, it is a bit more complex when OGJ relaxation is impaired (Fig. 5A). With impaired OGJ relaxation, there is compartmentalized pressurization between the contractile front of the distal oesophageal contraction and the OGJ with a high IBP residing between the two. In such instances, the slope of the 30 mmHg isobaric contour is no longer indicative of the CFV but now indicates increased IBP as a result of obstruction at the OGJ. In such circumstances, the algorithm for computing CFV defaults to computing the slope of an isobaric contour line of magnitude greater than the OGJ relaxation pressure so as to consistently represent the propagation velocity of luminal closure (Fig. 5A).
Figure 5.

Differentiating increased intrabolus pressure (top) from a rapidly propagated contraction (bottom). The upper panel illustrates a swallow with functional obstruction at the oesophagogastric junction (OGJ). Note that the 30 mmHg isobaric contour line (black) deviates quickly from the 50 mmHg isobaric contour line (blue). In this case the contractile front velocity (CFV) is normal, reflecting the propagation velocity of 50 mmHg isobaric contour rather than the 30 mmHg isobaric contour. In contrast, the lower panel represents a swallow with rapid CFV attributable to spasm. OGJ relaxation is normal and the 30 mmHg and 50 mmHg isobaric contours parallel each other indicating that no compartmentalized oesophageal pressurization has occurred. The entire distal oesophagus is contracting simultaneously. Modified from Ref. (6).
Apart from a rapid CFV, other common abnormalities of the distal oesophageal contraction are of hypotensive or absent peristalsis. In such instances, the 30 mmHg isobaric contour is either discontinuous or absent, reflective of either a focal or diffuse hypotensive contraction within the distal segment. Each swallow is thus characterized as normal (intact 30 mmHg isobaric contour and a CFV < 8 cm s−1), hypotensive (≥3 cm defect in the 30 mmHg isobaric contour), or absent peristalsis (complete failure of contraction with no pressure domain above 30 mmHg) (Table 3). Hypotensive or absent peristalsis is potentially associated with impaired bolus clearance but, whether or not that occurs depends upon the balance between the severity of weakness and the magnitude of outflow resistance at the OGJ.11 Although there is great interest in precisely defining these relationships in the hopes of determining a threshold lower limit pertinent to the advisability of antireflux surgery, there are minimal data available to support such a categorization. Nonetheless, a reasonable beginning would be to categorize the extremes of peristaltic performance: (i) ≥70% normal peristaltic contractions is normal, (ii) 100% of swallows with absent peristalsis constitutes absent peristalsis, and (iii) ≥70% of swallows with hypotensive peristaltic defects constitutes frequent hypotensive peristalsis (Table 4). The grey zone is with degrees of hypotensive peristalsis that are quantitatively between normal and frequent hypotensive peristalsis. The clinical significance of these degrees of hypotensive peristalsis is currently unknown. Hence, a conservative approach is to categorize these intermediate levels of hypotensive peristaltsis as ‘intermittent’ (Table 4). In addition, we have chosen to abandon terminology such as ‘peristaltic dysfunction’ and ‘ineffective oesophageal motility’ as these labels are not specific enough to describe a hypotensive peristaltic event and could easily include spasm and absent peristalsis as these are also dysfunctional and ineffective.
Table 4.
The Chicago classification (c 2/2009) of distal oesophageal motility disorders
| Disorder | Criteria |
|---|---|
| With normal OGJ relaxation (mean IRP <15 mmHg) and normal IBP | |
| Absent peristalsis | 100% swallows with absent peristalsis |
| Hypotensive peristalsis | |
| Intermittent | More than 30% of swallows with hypotensive or absent peristalsis |
| Frequent | ≥70% of swallows with hypotensive or absent peristalsis |
| Hypertensive peristalsis | Normal CFV, mean DCI > 5000 and <8000 mmHg s−1 cm−1 or LOS after- contraction >180 mmHg |
| Spastic nutcracker | Normal CFV, mean DCI > 8000 mmHg s−1 cm−1 |
| Distal oesophageal spasm | Spasm (CFV > 8 cm s−1) with ≥20% of swallows |
| Segmental | Spasm limited to S2 or S3 |
| Diffuse | Spasm involving both S2 and S3 |
| With impaired OGJ relaxation (IRP ≥ 15 mmHg) and/or elevated IBP (mean ≥15 mmHg) | |
| Achalasia | |
| Classic achalasia | Mean IRP ≥ 15 mmHg, absent peristalsis |
| Achalasia with oesophageal compression |
Mean IRP ≥ 15 mmHg, absent peristalsis, and pan-oesophageal pressurization with ≥20% of swallows |
| Spastic achalasia | Mean IRP ≥ 15 mmHg, absent peristalsis, and spasm (CFV > 8 cm s−1) with ≥20% of swallows |
| Functional OGJ obstruction* |
Normal CFV, Max-IBP > 15 mmHg with ≥30% of swallows compartmentalized above OGJ |
May represent an achalasia variant. OGJ, oesophagogastric junction; IRP, integrated relaxation pressure; IBP, intrabolus pressure; CFV, contractile front velocity; DCI, distal contractile integral.
Once swallows are characterized by the integrity of deglutitive OGJ relaxation and normality of the CFV, the distal oesophageal contraction is further characterized for the vigour of contraction using a newly developed measure, the distal contractile integral (DCI). The DCI integrates the length, contractile vigour, and duration of contraction of the first two sub-segments of the distal oesophageal segment contraction (S2 & S3), expressed as mmHg s−1 cm−1.4 Using data from the 75 control subjects, a DCI value greater than 5000 mmHg s−1 cm−1 is considered elevated. Adopting the nomenclature ‘nutcracker oesophagus’ from conventional manometry, this is the HRM criterion defining hypertensive peristalsis and was seen in 9% of a 400 patient series.6 However, there was substantial heterogeneity as to the locus of the hypertensive contraction within this group, potentially involving either or both of the sub-segments within the distal oesophageal contraction (Fig. 1, Table 4). Similarly, the LOS can also exhibit a hypertensive after-contraction, defined as exceeding 180 mmHg. Furthermore, one particularly interesting subgroup, defined by having a higher threshold DCI (>8000 mmHg s−1 cm−1), exhibited repetitive high-amplitude contractions and was clinically discernible by the uniform association with dysphagia or chest pain. Similar to distal oesophageal spasm (DOS), this ‘spastic nutcracker’ pattern is very rare, found in only 12 (3%) of this 400 patient series.
THE HROPT CLASSIFICATION OF DISTAL OESOPHAGEAL MOTILITY, C. FEBRUARY 2009
Although it will take years for an HRM consensus for a classification system to mature fully, substantial progress has occurred in the process of only a few years. At least with respect to the distal oesophagus, Tables 3 and 4 represent a reasonable representation of this. Table 3 details the vital measures to be made on individual swallows in an HROPT study. As described in the text, this results in ascertaining normal or abnormal OGJ relaxation, OGJ morphology, distal segment wavefront propagation velocity, hypotensive peristalsis, peristaltic vigour, and specific patterns of IBP. All of these measures can now be made with analysis tools available in the current version of ManoView™ analysis software (version 2.1; Sierra Scientific Instruments Inc.) and Solar GI HRM (Medical Measurement Systems).
Following analysis of individual swallows by the criteria in Table 3, the component results are synthesized into a global diagnosis by the criteria detailed in Table 4. Patients with normal OGJ relaxation, normal CFV, and a DCI <5000 mmHg s−1 cm−1 are reported as normal while the range of potential abnormalities is then detailed. Note that, in contrast to conventional classification schemes, there is no category of non-specific oesophageal motility disorders. This is intentional, as all manometric findings are non-specific; manometry only describes oesophageal contractility or pressurization patterns and there is always more than one diagnosis associated with a particular pattern.13,19 Even the most specific pattern, classic achalasia, can be seen as a result of either mechanical outflow obstruction or idiopathic achalasia. Hence, the abnormalities encountered are described in specific functional terms with the intent that these then be interpreted within the clinical context of the patient. An example of that strategy was the description of OGJ obstruction as the combination of impaired deglutitive OGJ relaxation and/or elevated IBP in the context of some preserved peristalsis (Fig. 5A). This has several potential aetiologies including mechanical obstruction (eg. Fundoplication, para-oesophageal hernia, tumour), variant achalasia, and oeosinophilic oesophagitis. In addition, functional obstruction could be related to a hiatus hernia and can be subtyped based on the location of the obstruction (LOS or CD).
Future directions
As alluded to in the introduction, HROPT classification of oesophageal motor function will require continuous refinement of diagnostic criteria. At this point, the emphasis of the endeavour is to establish a useful framework both to guide the clinical management of oesophageal motility disorders and to highlight areas of uncertainty where research opportunities exist. A brief inventory of unresolved issues to be taken up in future includes: the sub-classification of hypotensive peristalsis (likely based on outcome data and/or impedance correlations), the sub-categorization of DOS, consideration of OGJ morphologic subtypes in functional OGJ obstruction, defining transition zone defects, defining proximal oesophageal segment defects, and defining upper oesophageal sphincter dysfunction. By adopting an evidence-based strategy and focusing on methodological soundness, accurate diagnostic criteria, and outcome studies, it is hoped that this effort will enhance the value of clinical manometry as a tool for the diagnosis and management of oesophageal diseases.
ACKNOWLEDGMENTS
The authors would like to acknowledge the HRM Classification Working Group who met in San Diego at the 2008 DDW (along with the authors of this treatise) for their input in formulating a HROPT classification scheme: Donald Castell, Jeff Conklin, Ian Cook, John Dent, Chandra Prakash Gyawali, Geoff Hebbard, Richard Holloway, Phil Katz, Ravi Mittal, Taher Omari, Jeff Peters, Werner Schwizer, Daniel Sifrim, Andre Smout, Annamarie Staiano, Radu Tutuian, Marcelo Vela. This work was supported by R01 DC00646 (PJK & JEP) from the Public Health Service.
Abbreviations
- CD
crural diaphragm
- CFV
contractile front velocity
- DCI
distal contractile integral
- DOS
distal oesophageal spasm
- OGJ
oesophagogastric junction
- HROPT
high-resolution oesophageal pressure topography
- HRM
high-resolution manometry
- IRP
integrated relaxation pressure
- LOS
lower oesophageal sphincter
APPENDIX: RESOLUTION OESOPHAGEAL PRESSURE TOPOGRAPHY (HROPT) GLOSSARY
High-resolution manometry plotting
Pressure topography plots: Pressure data displayed with time on the x-axis, location of the pressure sensors on the y-axis, and pressure magnitude on the z-axis, scaled by colour intensity. To smooth the appearance, data are interpolation between sampling times and sensor positions. Pressure topography plots provide a quick assessment of peristalsis and sphincter relaxation.
Isobaric contour: A line on a pressure topography plot where the pressure is equal to a specific value, e.g. 30 mmHg. The 30 mmHg isobaric contour circumscribes areas where pressure exceeds 30 mmHg and excludes areas of lesser pressure. Multiple isobaric contour lines, for instance at 15 mmHg increments, can be used as an aid in scaling on pressure topography plots.
Oesophagogastric junction (OGJ) pressure morphology subtypes
OGJ pressure morphology: The OGJ derives pressure contributions from both the lower oesophageal sphincter (LOS) and the surrounding crural diaphragm (CD). The CD element is most evident during inspiration. OGJ pressure morphology subtypes are defined by relative localization of the LOS and CD elements.
LOS-CD separation: When the location of maximal pressure is different during inspiration and expiration, the proximal (expiratory) peak is the LOS and the distal (inspiratory) the CD. LOS-CD separation is measured during inspiration. To minimize sampling error, a mean of five consecutive values is derived.
OGJ type I: There is no discernible LOS-CD separation because the CD is superimposed on the LOS. In this case, neither LOS nor CD pressure is independently quantifiable.
OGJ type II: There is minimal but discernible LOS-CD separation, but the nadir pressure between the peaks is still positive. This represents an intermediate condition between normal and a hiatal hernia.
OGJ type III: LOS-CD separation is >2 cm. This is the HROPT signature of hiatus hernia. Two subtypes are discernible (IIIa and IIIb) with the distinction being that the respiratory inversion point is proximal to the CD with IIIa and proximal to the LOS in IIIb. Inspiratory augmentation is negative in type IIIa but positive in IIIb.
OGJ pressure (measured relative to gastric pressure)
Basal pressure (inspiratory): Inspiratory OGJ pressure is defined as the maximal pressure occurring during the normal respiratory cycle. To minimize sampling error, a mean of five consecutive values is derived.
Basal pressure (expiratory): Expiration is the lengthier portion of the respiratory cycle, and hence, not so easily isolated in time. Thus, expiratory OGJ pressure is defined as the pressure at the midpoint between adjacent inspiratory pressures during the normal respiratory cycle. Again, to minimize sampling error, a mean of five consecutive values is derived.
Respiratory inversion point: The location at which the inspiratory OGJ pressure becomes less than the expiratory OGJ pressure. Conceptually, this is the position at which the external OGJ environment switches from intra-abdominal to intra-mediastinal.
Inspiratory augmentation of OGJ pressure: The difference between basal inspiratory pressure and basal expiratory pressure. This can have a positive or negative value.
OGJ relaxation (measured relative to gastric pressure)
Deglutitive relaxation window: Deglutitive OGJ relaxation is measured within a 10 s period beginning with UOS relaxation and ending either at 10 s or upon the arrival of the peristaltic contraction at the OGJ. Because the oesophagus shortens and the LOS elevates during peristalsis, the relaxation window must also span a designated length (conventionally 6 cm) that is selected so as to accurately track the movement of the sphincter in the postdeglutitive period.
eSleeve pressure: An electronic computation designed to detect maximal pressure across a span of several adjacent sensors. The greatest pressure among the sensors within this span is the eSleeve pressure.
3-s nadir eSleeve relaxation pressure: An index of deglutitive OGJ relaxation derived from the eSleeve pressures expressed in mmHg. The 3-s nadir reports the lowest mean eSleeve pressure during a contiguous 3 s period of relaxation.
Integrated relaxation pressure (IRP): An index of deglutitive OGJ relaxation derived from the eSleeve pressures expressed in mmHg. The IRP reports the lowest mean eSleeve pressure for four contiguous or non-contiguous seconds of relaxation.
Distal segment contractility (measured relative to gastric pressure)
Distal contractile segment: Peristalsis has distinct proximal and distal segments separated by a transition zone. The distal segment also has three less distinct sub-segments, the third of which is the LOS (Fig. 1). This analysis lumps together the two sub-segments extending from the transition zone to the proximal aspect of the OGJ.
Intrabolus pressure (IBP): Intrabolus pressure is measured between the leading edge of the distal segment contraction and the OGJ and is a means of detecting functional OGJ obstruction. As the contractile wavefront nears the OGJ, the magnitude of IBP approximates the instantaneous OGJ relaxation pressure reflecting the pressure within the fluid compartmentalized between the two.
Contractile front velocity (CFV): A measure derived from the 30 mmHg isobaric contour circumscribing the distal contractile segment designed to detect rapidly conducted contractions expressed in cm s−1. Proximal and distal points are identified on the 30 mmHg isobaric contour and the slope of the line connecting the two is the CFV. Note that in instances of impaired OGJ relaxation, IBP will often exceed 30 mmHg, and in such instances the CFV is calculated from an isobaric contour line of magnitude greater than IBP.
Distal contractile integral (DCI): A measure of contractile vigour. If the pressure topography plot of sub-segments 2 and 3 in the distal oesophageal contraction is envisioned as a solid, it appears as a set of peaks with the height of the peaks corresponding to contractile pressure. The DCI is the entire volume of that solid spanning from 20 mmHg at the base to top of the peak(s) expressed as (mmHg s−1 cm−1).
REFERENCES
- 1.Clouse RE, Staiano A. Topography of the esophageal peristaltic pressure wave. Am J Physiol. 1991;261:G677–84. doi: 10.1152/ajpgi.1991.261.4.G677. [DOI] [PubMed] [Google Scholar]
- 2.Grubel C, Hiscock R, Hebbard G. Value of spatiotemporal representation of manometric data. Clin Gastroenterol Hepatol. 2008;6:525–30. doi: 10.1016/j.cgh.2008.02.006. [DOI] [PubMed] [Google Scholar]
- 3.Pandolfino JE, Ghosh SK, Zhang Q, Jarosz A, Shah N, Kahrilas PJ. Quantifying OGJ morphology and relaxation with high-resolution manometry: a study of 75 asymptomatic volunteers. Am J Physiol Gastrointest Liver Physiol. 2006;290:G988–97. doi: 10.1152/ajpgi.00510.2005. [DOI] [PubMed] [Google Scholar]
- 4.Ghosh SK, Pandolfino JE, Zhang Q, Jarosz A, Shah N, Kahrilas PJ. Quantifying esophageal peristalsis with high-resolution manometry: a study of 75 asymptomatic volunteers. Am J Physiol Gastrointest Liver Physiol. 2006;290:G988–97. doi: 10.1152/ajpgi.00510.2005. [DOI] [PubMed] [Google Scholar]
- 5.Ghosh SK, Pandolfino JE, Rice J, Clarke JO, Kwiatek M, Kahrilas PJ. Impaired deglutitive OGJ relaxation in clinical esophageal manometry: a quantitative analysis of 400 patients and 75 controls. Am J Physiol Gastrointest Liver Physiol. 2007;293:G878–85. doi: 10.1152/ajpgi.00252.2007. [DOI] [PubMed] [Google Scholar]
- 6.Pandolfino JE, Ghosh SK, Rice J, Clarke JO, Kwiatek MA, Kahrilas PJ. Classifying esophageal motility by pressure topography characteristics: a study of 400 patients and 75 controls. Am J Gastroenterol. 2008;103:27–37. doi: 10.1111/j.1572-0241.2007.01532.x. [DOI] [PubMed] [Google Scholar]
- 7.Ghosh SK, Pandolfino JE, Kwiatek MA, Kahrilas PJ. Oesophageal peristaltic transition zone defects: real but few and far between. Neurogastroenterol Motil. 2008;20:1283–90. doi: 10.1111/j.1365-2982.2008.01169.x. [DOI] [PMC free article] [PubMed] [Google Scholar]
- 8.Fox MR, Bredenoord AJ. Oesophageal high-resolution manometry: moving from research into clinical practice. Gut. 2008;57:405–23. doi: 10.1136/gut.2007.127993. [DOI] [PubMed] [Google Scholar]
- 9.Kahrilas PJ, Ghosh SK, Pandolfino JE. Esophageal motility disorders in terms of pressure topography: the Chicago classification. J Clin Gastroenterol. 2008;42:627–35. doi: 10.1097/MCG.0b013e31815ea291. [DOI] [PMC free article] [PubMed] [Google Scholar]
- 10.Massey BT, Dodds WJ, Hogan WJ, Brasseur JG, Helm JF. Abnormal esophageal motility. An analysis of concurrent radiographic and manometric findings. Gastroenterology. 1991;101:344–54. [PubMed] [Google Scholar]
- 11.Ghosh SK, Kahrilas PJ, Lodhia N, Pandolfino JE. Utilizing intraluminal pressure differences to predict esophageal bolus flow dynamics. Am J Physiol Gastrointest Liver Physiol. 2007;293:G1023–8. doi: 10.1152/ajpgi.00384.2007. [DOI] [PubMed] [Google Scholar]
- 12.Mittal RK, Ren J, McCallum RW, Shaffer HA, Jr, Sluss J. Modulation of feline esophageal contractions by bolus volume and outflow obstruction. Am J Physiol. 1990;258:G208–15. doi: 10.1152/ajpgi.1990.258.2.G208. [DOI] [PubMed] [Google Scholar]
- 13.Pandolfino JE, Kahrilas PJ. AGA technical review on the clinical use of esophageal manometry. Gastroenterology. 2005;128:209–24. doi: 10.1053/j.gastro.2004.11.008. [DOI] [PubMed] [Google Scholar]
- 14.Clouse RE, Staiano A, Alrakawi A, Haroian L. Application of topographical methods to clinical esophageal manometry. Am J Gastroenterol. 2000;95:2720–30. doi: 10.1111/j.1572-0241.2000.03178.x. [DOI] [PubMed] [Google Scholar]
- 15.Pandolfino JE, Kwiatek MA, Nealis TJ, Bulsiewicz W, Post J, Kahrilas PJ. Achalasia: it’s not all one disease. Gastroenterology. 2008;135:1526–33. doi: 10.1053/j.gastro.2008.07.022. [DOI] [PMC free article] [PubMed] [Google Scholar]
- 16.Mittal RK, Rochester DF, McCallum RW. Effect of the diaphragmatic contraction on lower oesophageal sphincter pressure in man. Gut. 1987;28:1564–8. doi: 10.1136/gut.28.12.1564. [DOI] [PMC free article] [PubMed] [Google Scholar]
- 17.Mittal RK. The crural diaphragm, an external lower esophageal sphincter: a definitive study. Gastroenterology. 1993;105:1565–7. doi: 10.1016/0016-5085(93)90167-b. [DOI] [PubMed] [Google Scholar]
- 18.Klein WA, Parkman HP, Dempsey DT, Fisher RS. Sphincterlike thoracoabdominal high pressure zone after esophagogastrectomy. Gastroenterology. 1993;105:1362–9. doi: 10.1016/0016-5085(93)90140-8. [DOI] [PubMed] [Google Scholar]
- 19.Kahrilas PJ, Clouse RE, Hogan WJ. American Gastroenterological Association technical review on the clinical use of esophageal manometry. Gastroenterology. 1994;107:1865–84. doi: 10.1016/0016-5085(94)90835-4. [DOI] [PubMed] [Google Scholar]
- 20.Pandolfino JE, Kim H, Ghosh SK, Clarke JO, Zhang Q, Kahrilas PJ. High-resolution manometry of the OGJ: an analysis of crural diaphragm function in GORD. Am J Gastroenterol. 2007;102:1056–63. doi: 10.1111/j.1572-0241.2007.01138.x. [DOI] [PubMed] [Google Scholar]
- 21.Bredenoord AJ, Weusten BL, Timmer R, Smout AJ. Intermittent spatial separation of diaphragm and lower esophageal sphincter favors acidic and weakly acidic reflux. Gastroenterology. 2006;130:334–40. doi: 10.1053/j.gastro.2005.10.053. [DOI] [PubMed] [Google Scholar]
- 22.Kahrilas PJ, Dodds WJ, Hogan WJ. Effect of peristaltic dysfunction on esophageal volume clearance. Gastroenterology. 1988;94:73–80. doi: 10.1016/0016-5085(88)90612-9. [DOI] [PubMed] [Google Scholar]