Abstract
Alterations in cellular phosphorylation patterns have been implicated in a number of diseases, including cancer, through multiple mechanisms. Herein we present a survey of the phosphorylation profiles of an isogenic pair of human cancer cell lines with opposite metastatic phenotype. Phosphopeptides were enriched from tumor cell lysates with titanium dioxide and zirconium dioxide, and identified with nano-LC-MS/MS using an automatic cross-validation of MS/MS and MS/MS/MS (MS2 + MS3) data-dependent neutral loss method. A spectral counting quantitative strategy was applied to the two cell line samples on the MS2-only scan which was implemented successively after each MS2 + MS3 scan in the same sample. For all regulated phosphopeptides reported by spectral counting analysis, sequence and phosphorylation site assignments were validated by a MS2 + MS3 data-dependent neutral loss method. With this approach, we identified over 70 phosphorylated sites on 27 phosphoproteins as being differentially expressed with respect to tumor cell phenotype. The altered expression levels of proteins identified by LC-MS/MS were validated using Western blotting. Using network pathway analysis, we observed that the majority of the differentially expressed proteins were highly interconnected and belong to two major intracellular signaling pathways. Our findings suggest that the phosphorylation of isoform A of lamin A/C and GTPase activating protein binding protein 1 is associated with metastatic propensity. The study demonstrates a quantitative and comparative proteomics strategy to identify differential phosphorylation patterns in complex biological samples.
Keywords: Breast Cancer, Label-free, Metastasis, Phosphorylation, Quantification
1 Introduction
Breast cancer is by far the most frequent cancer of women, with an estimated 192,370 new cases and 40,170 deaths in the United States in 2009. The majority of cancer mortality is attributed to metastasis, which is the spread of tumor cells to a secondary site such as bone, lung, and liver. The multistep nature of metastasis poses difficulties in both design and interpretation of experiments to unveil the mechanisms causing the process. Studies on excised fixed human tissues are complicated by the variance of genetic background between individuals and by the cellular heterogeneity of a complex tissue mass [1]. Through in vivo selection of monoclonal cultures of the MDA-MB-435 breast tumor cell line we were able to characterize a pair of subclones (M-4A4 and NM-2C5) which differ in their ability to complete the metastatic process [2–4]. When orthotopically inoculated into athymic mice, both cell lines form primary tumors, but only M-4A4 is capable of metastasis to the lungs and lymph nodes. These cell lines constitute a valuable model for the study of cancer metastasis.
M-4A4 and NM-2C5 have been extensively compared using gene and protein expression analysis identifying a panel of differentially expressed genes and protein [1–3, 5–6]. However, because protein phosphorylation-mediated signaling networks regulate much of the cellular response to external stimuli, and dysregulation in these networks has been linked to multiple disease states including cancer [7], similar studies at the phosphoprotein level may add valuable biological insight to inhibit the metastatic process.
Although significant advances have been made over the past decade to enable the analysis and quantification of cellular protein phosphorylation events, comprehensive quantitative analysis of the phosphoproteome is still lacking. Several mass spectrometry (MS) -based quantification methods have been implemented for phosphoproteomics, including stable-isotope labeling through chemical modification of peptides with, for example, isobaric tags for relative and absolute quantitation (iTRAQ) and stable-isotope labeling of amino acids in cell culture (SILAC). The well known limitations of label based-methods include increased complexity of the experimental protocols and the high cost of reagents.
In recent years, label-free quantitation methods have received increased attention as promising alternatives that automatically avoid some of the disadvantages of using stable isotope labeling methods. One approach is based on calculating extracted ion chromatogram ratios of peptides from separate LC-MS experiments and often includes an additional normalization step. Furthermore, the simple and straightforward spectral counting approach, in which total numbers of acquired MS/MS (MS2) spectra assigned to peptides are used as a read-out, transforms the frequency by which a peptide is identified into a measure for peptide abundance. Spectral counts of peptides associated with a protein are then averaged into a protein abundance index [8]. This approach was recently employed as a semi-quantitative measure of phosphoprotein abundance [9–10]. Although conceptually simple, recent studies have demonstrated that spectral counting can be as sensitive as ion peak intensities in terms of detection range while retaining linearity [11].
Despite published examples of using spectral counting in quantitative phosphoproteomics, there are still challenges. In a relatively large-scale phosphorylation study, especially for phosphoserine and phosphothreonine, there is the frequent and often overwhelming domination of phosphorylation-specific neutral losses (NL) in MS2 spectra. These peaks reduce the intensity of backbone b- and y-type ions that are critical for both phosphopeptide identification and precise site localization. To address this issue, a new data-dependent neutral loss (DDNL) MS/MS/MS (MS3) method that consists of additional fragmentation of the product of the precursor neutral loss in the form of a MS3 scan has been introduced. This approach (MS2 + MS3 scan) has now been widely adopted for phosphorylation identification analysis and is especially used on low mass accuracy mass spectrometers [12–13]. However, this strategy requires additional cycle time on the instrument and therefore reduces the number of spectra that can be measured in the same amount of time, so that the spectral counting method is often employed using the MS2-only scan. Sequence and phosphorylation site assignments are often manually validated for the phosphopeptides reported by the MS2 scan, where spectra are checked for the presence of neutral loss peak(s), coverage of the phosphorylation site by b- and y- ions and alternative phosphorylation sites in the sequence matching the same spectrum [14]. This process is time-consuming and laborious.
In this report, we present a survey of phosphorylation profiles for an isogenic pair of human breast cancer cell lines and describe a general integrated framework for quantifying enriched phosphoproteins in the two cell lines by combining automatic validation of the MS2 + MS3 scan for phosphopeptide identification, with a subsequent MS2-only scan for spectral counting. The regulated phosphorylated peptides and sites identified by MS2 scan were validated by the MS2 + MS3 neutral loss method. Application of the label-free approach to this source material revealed a panel of differentially expressed phosphoproteins which implicate specific signaling pathways as being associated with distinct cellular phenotypes.
2 Materials and methods
2.1 Materials
Titanium dioxide (TiO2) (3μm, 300Å, part number MZRO3000) and zirconium dioxide (ZrO2) (3μm, 300Å, part number MTIO3000) were purchased from Glygen (Glygen, Columbia, MD). Protease inhibitor cocktail and phosphatase inhibitor cocktail were from Roche (Roche, Nutley, NJ). Sequencing grade modified trypsin was from Promega (Promega, Madison, WI). All other chemicals were from Sigma (Sigma, St. Louis, MO).
2.2 Cell culture
Human tumor cell lines M-4A4 and NM-2C5 were derived from the tumor cell line MDA-MB-435 as described previously [2–3]. Cell lines were maintained as subconfluent monolayer cultures in RPMI 1640 medium (Gibco-BRL, New York, NY) supplemented with 10% fetal calf serum at 37°C under 5% CO2/95% air. Cell lines were maintained in parallel cultures and harvested using non-trypsin cell dissociation as cultures reached ~75% confluency. Harvested cells were washed once in serum-free media and immediately snap-frozen in liquid nitrogen.
2.3 Enrichment of phosphopeptides
TiO2 and ZrO2 particles were pretreated with 30% ACN, 0.1% TFA and 50% ACN, 10% acetic acid (HAC) respectively by vortex for 15 min. After centrifuging at 25, 000 g for 5 min, the supernatant was discarded. The pellet was then treated with 100% ACN. Then TiO2 and ZrO2 beads were diluted as 20 mg/mL in 30% ACN, 0.1% TFA and 50% ACN, 10% HAC separately.
To make cell extracts, a lysis buffer (7 M urea, 2 M thiourea, 10% glycerol, 2% n-octyl G-D-glucopyranoside (OG), 100 mM DTT, protease inhibitor cocktail, phosphatase inhibitor cocktail) was directly added to frozen cell pellets and the lysates were vibrated at room temperature for 1 hr. Cellular debris and other insoluble materials were removed by centrifuging the mixture at 80, 000 g for 1 hr. After measuring protein concentration in each lysate, proteins were digested with trypsin with a ratio of 50/1 (w/w) overnight at 37°C.
For enrichment with TiO2, 100 μg tryptic digest of the lysate was incubated with 50 μL TiO2 beads (20 mg/mL). After incubation for 30 min with vibration, the TiO2 beads were first washed with 300 μL 50% ACN, 6% TFA solution, followed by 300 μL 30% ACN, 0.1% TFA solution twice. The bound peptides were eluted with 100 μL 10% NH4OH. After centrifugation, the supernatant was collected and lyophilized to dryness.
For enrichment with ZrO2, 100 μg protein digests were diluted with 50% ACN, 10% HAC. The sample solution was mixed with 50 μL ZrO2 beads suspension (20 mg/mL). The protocol for preparation of standard protein mixture digest was the same as the one used with TiO2. The resulting solution was incubated for 30 min at room temperature. Then the ZrO2 beads were firstly washed with 300 μL 50% ACN, 10% HAC solution, followed by two washes with 300 μL 10% HAC. The trapped phosphopeptides on ZrO2 beads were eluted using 100 μL NH4OH under sonication for 20 min. After centrifugation, the supernatant was collected and lyophilized to dryness.
2.4 Mass spectrometry
Dry peptides were suspended in 0.1% formic acid and loaded for LC-MS/MS analysis in a LTQ mass spectrometer. The nano-RPLC column (Nano Trap Column 5 μm 200Å Magic C18AQ 100 μm × 150 mm, Michrom Bioresources, Auburn, CA) was directly coupled to a LTQ linear IT MS from Thermo Scientific with a nanospray source. The LTQ instrument was operated in positive ion mode. The scan range of each full MS scan was m/z 400–2000. ACN gradients of 5–35% for 70 min at a flow rate 300 nL/min were applied for the separation of phosphopeptides. For the detection, the MS was set as a full scan followed by three data dependent MS2 events. For MS2 + MS3 scan, a subsequent MS3 event was triggered upon detection when a neutral loss of −49 or −32.7 (loss of H3PO4 for the +2 and +3 charged ions, respectively) was detected among the top 10 most intense ions in MS2. A dynamic exclusion window was applied which prevented the same m/z from being selected for 1 min after its acquisition. This entire LC-MSn system was controlled under Xcalibur software 2.0 (Thermo Scientific, Waltham, MA).
The MS2 and MS3 spectra were searched using SEQUEST (v0.27) against human IPI database v3.49 with the following parameters: peptide mass tolerance, 1.5 Da; MS2 and MS3 fragment ion mass tolerance, 1.4 Da; enzyme set as trypsin and allowance up to two missed cleavages; no static modification; dynamic modifications were methionine oxidation (+16 Da), phosphorylation on serine, threonine, and tyrosine (+80 Da); for MS3 data, besides the above modifications, variable modifications of −18 Da (elimination of phosphoric acid) on serine and threonine residues were also selected.
2.5 MS2 + MS3 scan data analysis
Enriched phosphopeptides were identified with automatic cross-validation of MS2 and MS3 spectra using the method of Jiang and coworkers [15]. Because the charge state of the precursor ion cannot be determined with low mass accuracy MS, more than one DTA file with different precursor charge states (commonly 2+ and 3+, respectively) were exported for one tandem spectrum. By combining MS2 spectra and corresponding neutral loss MS3, charge states of precursor ions can be determined from the m/z value of neutral loss: −49 indicated +2 charged precursor ions, while −32.7 was for +3 charged ions. Only a DTA spectrum with neutral loss peak of at least 50% of the base peak in intensity was considered. After removal of MS2/MS3 pairs with incorrect charge states, MS2 with no MS3, and MS2/MS3 pairs with neutral loss intensity less than 50% of the base peak in MS2 spectrum, the remaining MS2 and MS3 DTA spectra with specific precursor charge states were searched against the database, respectively. The top 10 hit peptides from a database search for a spectrum were considered. Then peptide identifications from a pair of spectra (MS2 and its corresponding MS3) were combined. Only peptides which were identified from both of the spectra (MS2 and MS3) were retained. The matched peptide in a spectra pair with the highest Xcorr’s score was defined as the top matched peptide for the spectra pair and selected for filter afterward.
For the determination of phosphorylation sites, Tscore was introduced as the sum of MS2 and MS3 PTM scores with the definition as −10 log(Ptotal). For the phosphopeptide with two or more phosphorylation sites, Tscores of all candidate sequences with different phosphorylation site combinations for this phosphopeptide were calculated. Then the Tscore of a given site was computed by summing the Tscores of all candidate sequences containing this site. Phosphorylation sites with top n (equal to the number of possible phosphorylation sites) Tscores were considered as the most likely phosphorylation site localizations [15].
2.6 Spectral counting analysis
We counted the number of spectra observed for each peptide sequence in a mass spectrometry run [16]. To calculate a protein spectrum count, we summed the numbers for all of the peptides assigned to each protein in that run. We found this approach preferable to other methods such as parent ion peak height because it allowed us to simplify the analysis by combining all sites on a given protein [9]. Then we applied a normalized spectral abundance factor (NSAF) approach [17] to quantify phosphoprotein expression profiles. In spectral counting, larger proteins are expected to generate more peptides and therefore more spectral counts than smaller proteins. Consequently, it is very important to take into consideration the length or sequence of a protein when determining protein abundance using spectral counting [17–18]. The NSAF approach has at least the same, or better, capability to capture a wide dynamic range of protein expression ratios, and it can also identify significantly expressed proteins via simple statistical tests, such as the t-test, to compare the mean protein intensities of two or more samples. The use of the t-test is applicable in this approach because it has been shown that the log transformation of the NSAF value is normally distributed. In addition, the NSAF approach has comparable sensitivity in identifying differentially expressed proteins as other approaches based on protein ratios.
After MS2-only scan analysis, the RAW data file was processed using SEQUEST and validated by Trans-Proteomic Pipeline (TPP). Spectral count data was then extracted from xml files using an in-house Perl script and output into Microsoft Excel files. In order to calculate the NSAF value, we applied the formula
where Spc is the number of spectral count, and L is the length in amino acid for kth protein. The NSAF value was then natural log-transformed and subjected to independent two sample t-test using Microsoft Excel. A t-test p value of less than 0.05 was used to identify significant differentially expressed phosphoproteins.
2.7 Western blotting
Western blotting was performed using established methods [19] to confirm the phosphoprotein expression of isoform A of Lamin-A/C (LMNA, phospho Ser22) and Ras GTPase-activating protein-binding protein 1 (G3BP1, phospho Ser232). Briefly, equal amounts of isolated proteins from M-4A4 and NM-2C5 cell lysates were separated by 12% SDS-PAGE and then transferred to PVDF membrane using Transblot (Bio-Rad). After blocking for 1 h, the membrane was probed with rabbit polyclonal antibody against human phospho Lamin-A/C (Cell Signaling Technology, Boston, MA) or phospho G3BP1 (Abcam, Cambridge, MA) diluted in 1:1000 overnight. After incubation with peroxidase-conjugated goat anti-rabbit IgG secondary antibody (Abcam) for 1 h, immunoblots were visualized with an enhanced chemiluminescent method kit (GE Healthcare, Piscataway, NJ). Densitometric analysis was performed.
3 Results
Our phosphorylation profiling approach combined phosphopeptide enrichment using TiO2 and ZrO2 particles, multistage MS for phosphopeptide identification, and label-free spectral counting for quantitation. Extracted proteins from the human breast cancer cell lines M-4A4 and NM-2C5 were digested with trypsin, and the phosphopeptides were enriched on TiO2 or ZrO2 particles. The resulting peptide mixtures were analyzed by online LTQ linear IT MS with two consecutive stages of fragmentation. Automatic cross-validation by combining consecutive stage mass spectrometry data and the target-decoy database searching strategy was used to identify phosphopeptides. Quantitation of phosphoproteins in the two cell lines was achieved by the spectral counting method, with MS2-only scan implemented successively after each MS2 + MS3 scan. Sequence and site assignments were validated with the MS2 + MS3 neutral loss method. Western blotting was used to validate the altered expression of differentially expressed phosphoproteins (Fig. 1).
Figure 1.
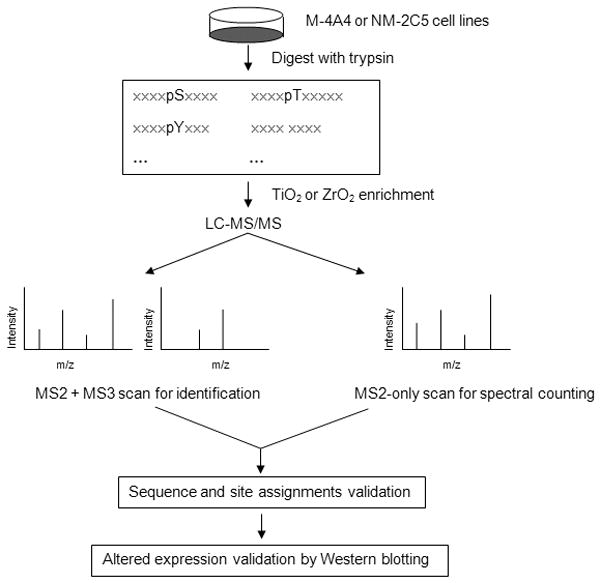
Schematic illustrating the label-free quantitative analytical approach for protein phosphorylation profiling. Extracted proteins from human breast cancer cell lines, malignant M-4A4 and non-malignant NM-2C5, were digested with trypsin. Phosphopeptide mixtures were enriched with TiO2 and ZrO2 particles and analyzed by LC-MS/MS. Phosphopeptides were identified by automatic cross-validation of the MS2 + MS3 scans. Quantification of phosphoprotein expression in the tumor metastasis model was implemented by spectral counting with the MS2-only spectra. Then peptide sequence and site assignments were validated by a MS2 + MS3 neutral loss method. The altered expression of selected phosphoproteins reported from spectral counting was validated by Western blotting.
3.1 Phosphoproteome
To provide adequate coverage of the phosphoproteome, six replicates of MS2 + MS3 scans for each sample were analyzed. More than 6,700 phosphopeptides were detected in 24 LC MS analyses. The six MS runs had very similar counts of identified phosphopeptides, as shown in Fig. 2A. Only the peptides detected 3 or more times within 6 replicates were considered for further analysis. After filtering with the criteria Rank’m = 1, ΔCn’m≥0.1, and the Xcorr’s≥ 3.7, our analysis identified 425 phosphorylation sites on 160 unique proteins with a FDR less than 3% using the described stringent criteria in the two cell line samples. Of these, 65 sites (15.3%) had not been reported in the PhosphoSite Plus database as of September, 2009 (Supplemental material table 1). The representative MS2 and MS3 spectra of identified peptide VLGpSEGEEEDEALpSPAK assigned to protein DNA ligase 1 is shown in Fig. 3.
Figure 2.
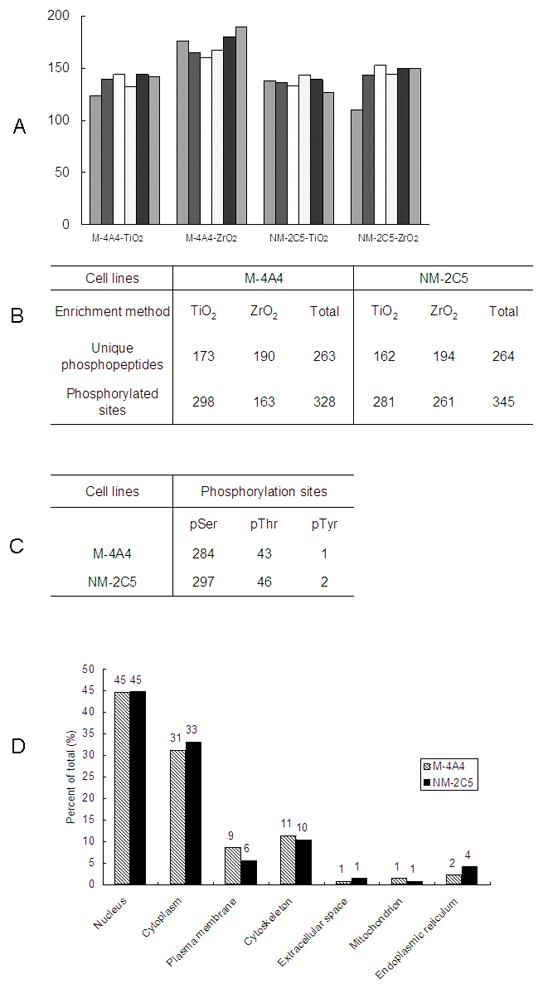
A. Summary of the phosphopeptide identification counts for M-4A4 or NM-2C5 cell lines with TiO2 or ZrO2 enrichment methods in six MS2 + MS3 replicate runs. B. Identified unique phosphopeptides and phosphorylation sites from 6 replicates of MS2 + MS3 scans of the M-4A4 and NM-2C5 cell line samples; C. Distribution of phosphorylated sites by amino acid; D. Gene ontology analysis of the identified unique phosphoproteins.
Figure 3.
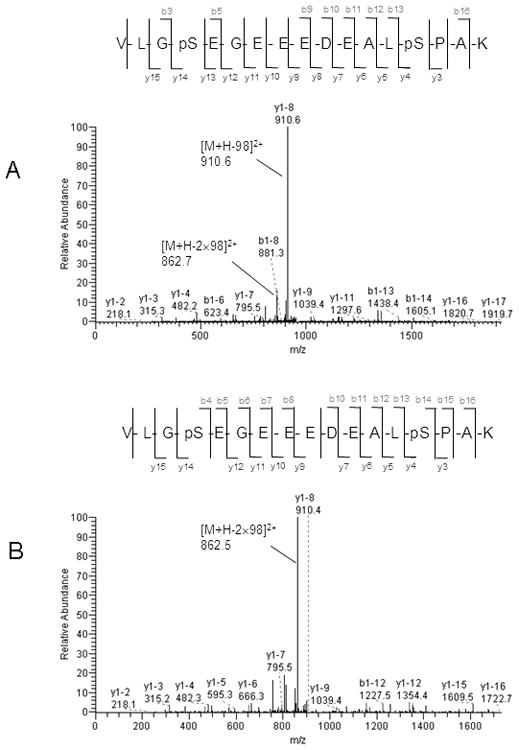
Representative spectra of a phosphorylated peptide identified by automatic cross-validation of MS2 and MS3 data-dependent neutral loss method. A. MS/MS spectrum of doubly charged and doubly phosphorylated peptide VLGpSEGEEEDEALpSPAK assigned to protein DNA ligase 1. The peak at m/z 910.6 represents the doubly charged form of the selected precursor ion at m/z 959.8 with loss of one H3PO4 group, and at m/z 862.7 with loss of two H3PO4 groups. B. MS/MS/MS spectrum for the fragment ion at m/z 910.6 corresponding to neutral loss of the H3PO4 group. The peak at m/z 862.5 represents the doubly charged form of m/z 910.6 after loss of the H3PO4 group.
In the M-4A4 cell line, 328 phosphorylated sites on 263 unique phosphopeptides were identified, and in the NM-2C5 cell line 345 phosphorylated sites on 264 unique phosphopeptides were identified (Fig. 2B). Of these, we determined the distribution between individually identified sites to be 284 phosphoserine (pS), 43 phosphothreonine (pT), and 1 phosphotyrosine (pY) sites in M-4A4 cells and 297 pS, 46 pT, and 2 pY sites in NM-2C5 cells. In the Hunter and Sefton classic study using phosphoamino acid analysis, a relative abundance of 90%, 10%, and 0.05% for pS, pT, and pY was observed in proliferative, non-cancerous human cells [20]. The distribution of pS, pT, and pY sites was 86.6%, 13.1%, and 0.3% for M-4A4 cells and 86.1%, 13.3%, and 0.6% for NM-2C5 cells, a distribution markedly similar to the estimated phosphorylated amino acid content in the previous study (Fig. 2C).
We observed phosphorylation sites on a wide variety of proteins. Fig. 2D shows a Gene Ontology (GO) analysis of the phosphoproteome of M-4A4 and NM-2C5 cell lines. Almost half of the phosphorylation events occurred on nuclear proteins, whereas only one-third of all proteins in the IPI database are assigned as nuclear by GO [21], indicating that phosphorylation in these cells preferentially occurs in nuclear proteins. As expected, proteins annotated as extracellular were significantly underrepresented in the phosphoproteome. In addition, proteins annotated as mitochondrial by GO were underrepresented, as were plasma membrane proteins.
TiO2 and ZrO2 have often been used to enrich phosphopeptides because of their strong interaction between phosphate groups on target molecules. We found that these two enrichment methods were complementary in identifying phosphopeptides, with fifty to sixty percent of identical phosphopeptides being enriched by both TiO2 and ZrO2 (Fig. 4A). Moreover, more selective isolation of singly-phosphorylated peptides was observed with ZrO2 compared to TiO2, whereas TiO2 preferentially enriched multiply-phosphorylated peptides (Fig. 4B).
Figure 4.
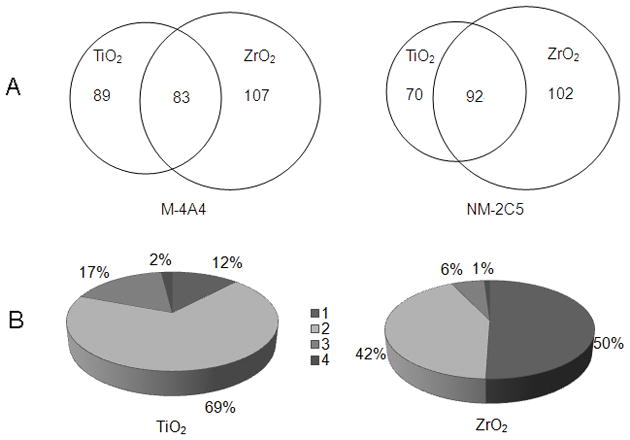
A. Overlap between phosphopeptide enrichment methods on the level of identified unique phosphopeptides in the M-4A4 or NM-2C5 cell lines. Around 50% of the unique phosphopeptides identified from the TiO2 method were also identified in the ZrO2 method; B. Distribution of singly (1), doubly (2), triply (3) and quadruply (4) phosphorylated peptides enriched by TiO2 or ZrO2 in the two cell lines.
3.2 Quantitative phosphoproteomics
While MS3 scans followed by each MS2 scan will interfere with the spectral counting of peptides, we developed an approach to address this problem whereby one MS2-only scan is run successively after each MS2 + MS3 scan of the same sample with different sample injections and different method files. MS2-only scans in each sample were run 6 times. Hierarchical clustering analysis was employed to evaluate reproducibility between the 6 MS2-only scans. Correlation factors calculated using the spectral count of peptides showed very similar results between different MS2-only scans in the same sample, thus, the spectral count method is applicable in label-free shotgun proteomics (Fig. 5). The spectral count was generated from MS2 raw data after TPP analysis. Only the peptides detected for 3 or more times in six MS2 runs for each sample were further analyzed. After normalization for protein length, the changed ratios and p value calculated by Student’s t-test for each protein were recorded. As a result, 33 regulated proteins were identified with a p value less than 0.05 from the two enrichment methods.
Figure 5.
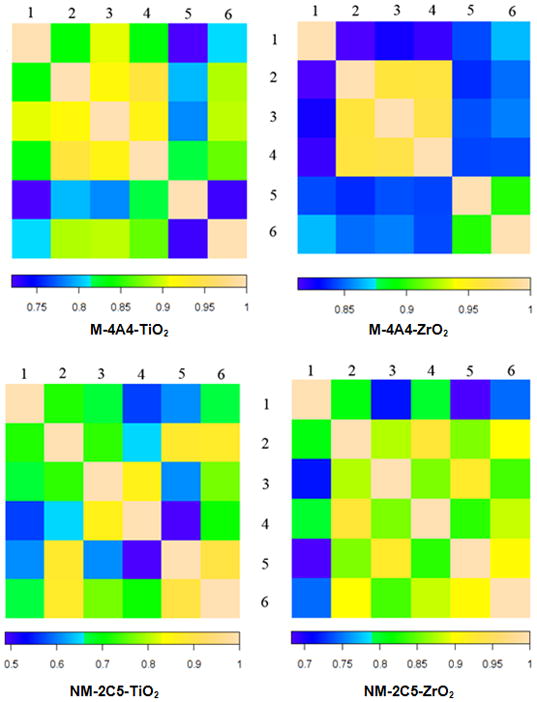
Hierarchical clustering of 6 MS2-only scans ofthe M-4A4 or NM-2C5 cell samples after TiO2 or ZrO2 particle enrichment. After MS2-only scan analysis, the RAW data file was processed using SEQUEST and validated by TPP. Spectral count data was then extracted from xml files. Correlation factors were caculated from the spectral count of phosphoproteins. The color bar represents the reproducibility between two MS2 runs in each sample.
Peptide sequence and site assignments reported from MS2-only scan were validated by a MS2 + MS3 neutral loss method. Only the proteins identified both from MS2-only scans and MS2 +MS3 scans were retained for further analysis. After validation, over 70 phosphorylated sites on 27 proteins were found to be differentially expressed, and 3 of them were present in both of the enrichment experiments with the same change trend. These included neuroblast differentiation-associated protein (AHNAK), myosin-IXb, and protein NDRG1 (Supplemental table 2). Among the proteins we observed, 16 proteins were expressed at higher phosphorylation levels and 11 phosphoproteins were underexpressed in M-4A4 cells compared with NM-2C5 cells (Table 1). The up-regulated protein group included lamin A/C, G3BP1, protein NDRG1, and myosin-IXb, and the down-regulated group included AHNAK, eukaryotic translation initiation factor 5B (EIF5B), serine/threonine-protein kinase 10 (STK10), and prostaglandin E synthase 3 (PTGES3). To provide the foundation of integrating MS2 + MS3 scans and MS2-only scans, we showed that the neutral loss peak for the peptide AEEDEILNRpSPR assigned to the protein calnexin was detected from both the MS2-only scan (Fig. 6A) and the MS2 + MS3 scan (Fig. 6B and 6C). Nevertheless, for the remaining 6 proteins which were not validated by the MS2 + MS3 neutral loss method, we discovered the neutral loss peak neither from MS2-only scans nor MS2 + MS3 scans. Furthermore, we evaluated the recurrence of the peptide AEEDEILNRpSPR in different MS2 + MS3 and MS2-only scans in the same sample. The very similar retention time of this peptide in 3 different MS2 + MS3 scans and 3 different MS2-only scans strongly supports the utility of this integrated quantitative method (Fig. 7).
Table 1.
Regulated phosphoproteins with TiO2 enrichment
| IPI no. | Gene name | Description | Location | M-44 | NM-2C5 | Ratio of mean (M-4A4/NM-2C5) | p value | ||||||||||
|---|---|---|---|---|---|---|---|---|---|---|---|---|---|---|---|---|---|
| Spectral counts | |||||||||||||||||
| R1a | R2 | R3 | R4 | R5 | R6 | R1 | R2 | R3 | R4 | R5 | R6 | ||||||
| IPI00021812 | AHNAK | Neuroblast differentiation-associated protein AHNAK (Fragment) | Nucleus | 2 | 1 | 1 | 2 | 6 | 4 | 7 | 8 | 7 | 10 | 0.18 | 2.44E-03 | ||
| IPI00186966 | BIN1 | Isoform IIA of Myc box-dependent-interacting protein 1 | Nucleus | 2 | 2 | 2 | 2 | 2 | 2 | 1 | 1 | 2 | 2 | 2.45 | 1.74E-02 | ||
| IPI00013743 | BUD13 | BUD13 homolog | Nucleus | 8 | 5 | 6 | 6 | 7 | 4 | 7 | 7 | 5 | 5 | 5 | 4 | 1.33 | 3.54E-02 |
| IPI00296432 | IWS1 | Isoform 1 of IWS1 homolog | Nucleus | 5 | 6 | 5 | 6 | 8 | 7 | 9 | 6 | 6 | 4 | 6 | 4 | 1.33 | 3.68E-02 |
| IPI00017297 | MATR3 | Matrin-3 | Nucleus | 5 | 4 | 5 | 3 | 4 | 5 | 6 | 3 | 4 | 2 | 3 | 4 | 1.48 | 1.80E-02 |
| IPI00306933 | MYO9B | Isoform Short of Myosin-IXb | Cytoplasm | 4 | 4 | 3 | 4 | 4 | 2 | 2 | 2 | 3 | 1 | 3.05 | 1.65E-02 | ||
| IPI00022078 | NDRG1 | Protein NDRG1 | Nucleus | 8 | 8 | 12 | 10 | 11 | 10 | 7 | 6 | 7 | 6 | 7 | 5 | 1.89 | 1.92E-04 |
| IPI00012345 | SFRS6 | Isoform SRP55-1 of Splicing factor, arginine/serine-rich 6 | Nucleus | 6 | 8 | 8 | 10 | 9 | 8 | 5 | 8 | 7 | 5 | 7 | 7 | 1.55 | 5.58E-03 |
| IPI00100151 | XRN2 | Isoform 1 of 5′-3′exoribonuclease 2 | Nucleus | 6 | 7 | 8 | 8 | 8 | 10 | 7 | 8 | 4 | 5 | 7 | 5 | 1.65 | 1.27E-03 |
| IPI00219866 | ZRANB2 | Isoform ZIS-2 of Zinc finger Ran-binding domain-containing protein 2 | Nucleus | 5 | 4 | 5 | 4 | 5 | 5 | 4 | 4 | 4 | 3 | 4 | 5 | 1.43 | 1.34E-03 |
| Regulated phosphoproteins with ZrO2 enrichment | |||||||||||||||||
|---|---|---|---|---|---|---|---|---|---|---|---|---|---|---|---|---|---|
| IPI no. | Gene name | Description | Location | M-4A4 | NM-2C5 | Ratio of mean (M-4A4/NM-2C5) | p value | ||||||||||
| Spectral counts | |||||||||||||||||
| R1 | R2 | R3 | R4 | R5 | R6 | R1 | R2 | R3 | R4 | R5 | R6 | ||||||
| IPI00550363 | TAGLN2 | Transgelin-2 | Cytoplasm | 1 | 1 | 1 | 2 | 2 | 2 | 2 | 2 | 3 | 0.22 | 9.00E-04 | |||
| IPI00021812 | AHNAK | NEUROBLAST DIFFERENTIATION-ASSOCIATED PROTEIN AHNAK | Nucleus | 4 | 5 | 6 | 4 | 1 | 5 | 12 | 14 | 17 | 8 | 15 | 13 | 0.26 | 7.45E-05 |
| IPI00220113 | MAP4 | microtubule-associated protein 4 | Cytoplasm | 2 | 1 | 3 | 1 | 1 | 3 | 3 | 3 | 2 | 4 | 4 | 0.37 | 1.36E-02 | |
| IPI00020956 | HDGF | hepatoma-derived growth factor (high-mobility group protein 1-like) | Extracellular | 1 | 3 | 3 | 1 | 1 | 2 | 3 | 5 | 2 | 4 | 4 | 0.38 | 1.02E-02 | |
| IPI00299254 | EIF5B | eukaryotic translation initiation factor 5B | Cytoplasm | 3 | 3 | 3 | 2 | 3 | 7 | 5 | 6 | 3 | 3 | 4 | 0.39 | 3.22E-02 | |
| IPI00304742 | STK10 | SERINE/THREONINE-PROTEIN KINASE 10 | Cytoplasm | 1 | 1 | 3 | 2 | 4 | 3 | 2 | 2 | 2 | 1 | 0.40 | 4.06E-02 | ||
| IPI00015029 | PTGES3 | Prostaglandin E synthase 3 | Cytoplasm | 7 | 5 | 5 | 7 | 8 | 7 | 8 | 10 | 6 | 8 | 13 | 8 | 0.65 | 2.98E-02 |
| IPI00010276 | OGFOD2 | SRp25 nuclear protein isoform 2 | Unknown | 2 | 3 | 2 | 2 | 1 | 1 | 2 | 2 | 4 | 2 | 2 | 2 | 0.66 | 3.54E-02 |
| IPI00297178 | DHX16 | DEAH (Asp-Glu-Ala-His) box polypeptide 16 | Nucleus | 2 | 2 | 1 | 2 | 2 | 2 | 2 | 2 | 2 | 2 | 3 | 3 | 0.69 | 2.93E-02 |
| IPI00102875 | ZFYVE19 | Isoform 3 of Zinc finger FYVE domain-containing protein 19 | Unknown | 2 | 2 | 2 | 1 | 1 | 2 | 2 | 2 | 2 | 2 | 2 | 2 | 0.69 | 1.08E-02 |
| IPI00006038 | NUP98 | Isoform 1 of Nuclear pore complex protein Nup98-Nup96 precursor | Nucleus | 3 | 2 | 2 | 2 | 2 | 2 | 2 | 2 | 3 | 3 | 4 | 2 | 0.71 | 2.49E-02 |
| IPI00021405 | LMNA | lamin A/C | Nucleus | 14 | 19 | 15 | 22 | 10 | 21 | 9 | 8 | 11 | 12 | 7 | 9 | 1.50 | 7.59E-03 |
| IPI00012442 | G3BP1 | GTPase activating protein (SH3 domain) binding protein 1 | Nucleus | 5 | 4 | 3 | 4 | 4 | 6 | 2 | 3 | 3 | 3 | 2 | 1 | 1.58 | 4.48E-02 |
| IPI00022078 | NDRG1 | Protein NDRG1 | Nucleus | 7 | 5 | 9 | 7 | 5 | 8 | 1 | 4 | 3 | 5 | 4 | 5 | 1.61 | 3.88E-02 |
| IPI00306933 | MYO9B | Isoform Short of Myosin-IXb | Cytoplasm | 4 | 3 | 3 | 6 | 2 | 7 | 1 | 2 | 2 | 3 | 3 | 2 | 1.62 | 4.43E-02 |
| IPI00020984 | CANX | calnexin | Cytoplasm | 5 | 5 | 4 | 5 | 3 | 3 | 1 | 2 | 3 | 2 | 4 | 1 | 1.68 | 1.99E-02 |
| IPI00104050 | THRAP3 | Thyroid hormone receptor-associated protein 3 | Nucleus | 2 | 2 | 2 | 2 | 1 | 2 | 2 | 1 | 1 | 1.95 | 2.99E-02 | |||
| IPI00221394 | DKC1 | dyskeratosis congenita 1, dyskerin | Nucleus | 4 | 2 | 3 | 2 | 2 | 4 | 2 | 1 | 2 | 2 | 2.11 | 4.46E-02 | ||
| IPI00019996 | SLTM | modulator of estrogen induced transcription isoform b | Nucleus | 2 | 3 | 2 | 2 | 2 | 2 | 1 | 1 | 1 | 3.33 | 3.29E-03 | |||
| IPI00297579 | CBX3 | CHROMOBOX PROTEIN HOMOLOG 3 | Nucleus | 2 | 2 | 7 | 5 | 3 | 8 | 3 | 1 | 1 | 3.81 | 8.64E-03 | |||
MS2 run
Figure 6.
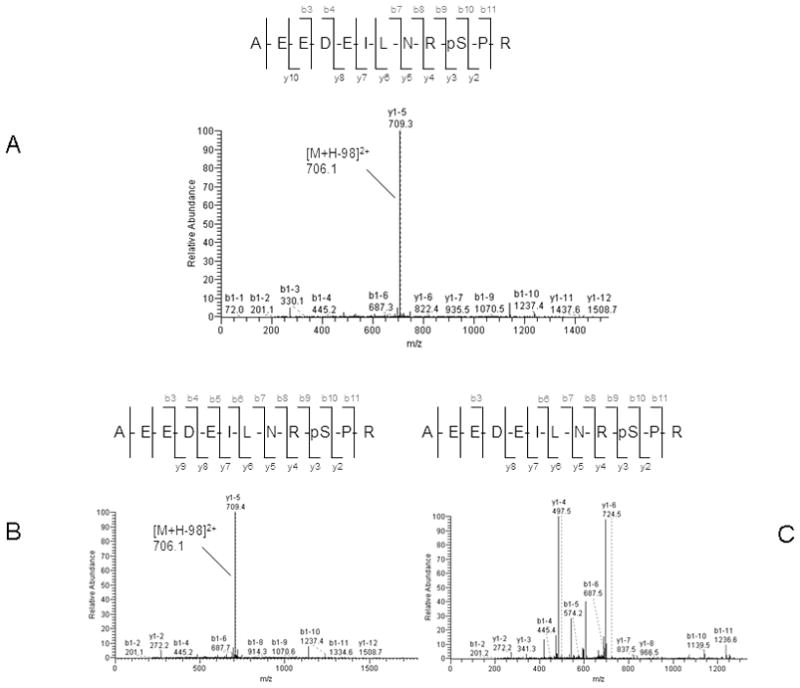
Representative spectra of singly phosphorylated peptide AEEDEILNRpSPR assigned to protein calnexin (CANX) identified in MS2-only scan (A) and in MS2 + MS3 scan (B and C). A. In the MS2-only scan, the MS/MS spectrum shows that the peak at m/z 706.1 represents the doubly charged form of the selected precursor ion at m/z 754.95 with loss of one H3PO4 group B. In the MS2 + MS3 scan, the MS/MS spectrum show the peak at m/z 706.1 represents the doubly charged form of the selected precursor ion at m/z 754.4 with loss of one H3PO4 group. C. In the MS2 + MS3 scan, the MS/MS/MS spectrum for the fragment ion at m/z 706.1 corresponds to the neutral loss of the H3PO4 group.
Figure 7.
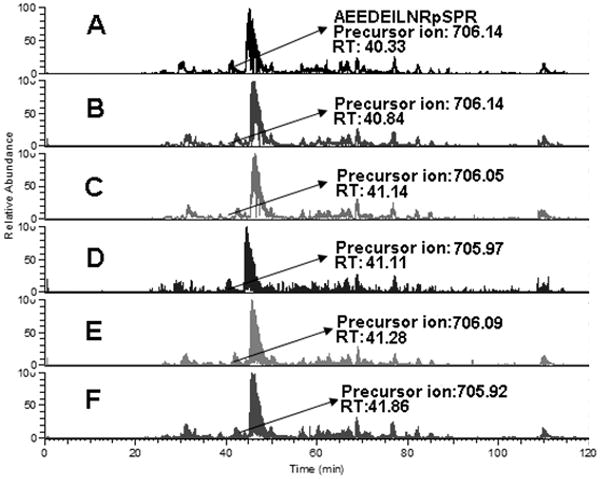
Recurrence of the same peptide in different MS2-only and MS2 + MS3 scans in the same sample. Shown is the precursor ion m/z and retention time (RT) of one identified peptide AEEDEILNRpSPR in 3 different MS2-only scans (A, B, C) and 3 different MS2 + MS3 scans (D, E, F) in the NM-2C5 cell sample enriched with ZrO2. The very similar retention time strongly supports the utility of integrated quantitative method. The arrow indicates the spectrum where the peptide was identified.
Although an increasing number of phospho-specific antibodies are emerging, the availability is still limited. We found 2 commercially available phospho-specific antibodies for proteins from our list of differentially expressed phosphoproteins. We used these antibodies in Western blotting to verify the spectral counting quantification of LMNA and G3BP1. Good agreement between the two methods was achieved (Fig. 8).
Figure 8.

Western blotting analysis of the expression of phosphoproteins LMNA and G3BP1 in M-4A4 and NM-2C5 cell line samples. Shown in the right panel is a comparison of the six replicates of spectral counts of these phosphoproteins identified by MS/MS.
4 Discussion
In this study, we have developed a novel strategy to identify 425 phosphorylation sites on 160 unique proteins with a FDR less than 3% in isogenic human breast cancer cell lines M-4A4 and NM-2C5. The approach uses TiO2 and ZrO2 particle enrichment of phosphopeptides and automatic validation by combining consecutive stage mass spectrometry data and target-decoy database searching. We have demonstrated the comparative application of the strategy by identifying 27 phosphoproteins that were deemed to be differentially expressed in the tumor metastasis model through spectral counting with cross-confirmation of MS2 + MS3 and MS2-only scans.
Although spectral counting approaches have been employed for the quantitative measure of phosphoprotein abundance by several groups, especially for differential profiling of phosphotyrosine-containing proteins in cancer tissues and cells [9], a generalizable quantitative spectral counting method for enriched phosphoprotein analysis including phosphoserine and phosphothreonine-containing proteins has been lacking. A remaining challenge is that MS2-only scans are often used to implement spectral counting in label-free quantitative proteomics. Many large-scale phosphorylation studies rely solely on MS2 scan and report error rates < 1% FDR. In those cases, data filtering is accomplished by using high mass accuracy data for the precursors and/or higher cutoff values on scores derived from searching algorithms. However, for low mass accuracy mass spectrometers, the manual or automatic validation using the combination of MS2 and MS3 scan is often undertaken to assure accurate peptide and phosphorylation site assignment [13, 15, 22]. These reports indicate that cross-validation of phophopeptide assignment by MS2 and MS3 scans result in the high confidence in identification [13]. Therefore, we developed an integrated quantitative method combining spectral counting of MS2-only scans and phosphopeptide identification achieved with MS2 + MS3 scans. The phosphopeptide sequence and site assignments reported from MS2-only scans were validated by the MS2 + MS3 neutral loss method. Only those proteins identified by both MS2 + MS3 scans and with a p value less than 0.05 in statistical analysis with spectral counts, after normalization in MS2-only scans, can be considered for further analysis. Finally, 27 phosphoproteins met the criteria out of 33 proteins, where the latter group was found to have a p value less than 0.05 by MS2-only scan. The pitfall of this approach is that the stringent criterion might fail to detect peptides for which MS3 are not triggered because of low intensity (or absent) neutral loss fragment ions, such as phosphotyrosine-containing peptides.
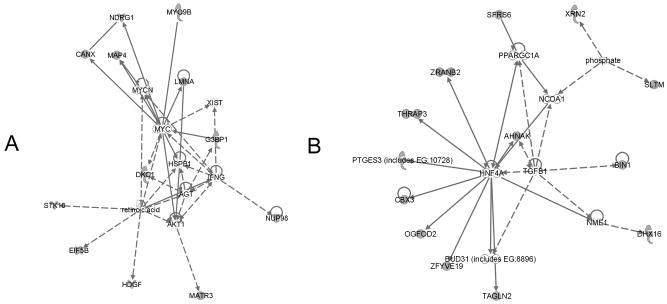
In this study, we used the integrated strategy to identify 27 phosphoproteins that were differentially expressed in human cells with distinct metastatic phenotypes. Of these, 16 were up-regulated and 11 were down-regulated in metastatic M-4A4 cells relative to non-metastatic NM-2C5 cells. The phosphorylation expression change of LMNA and G3BP1 reported from spectral counting was validated with good agreement by Western blotting. Using the Ingenuity Pathways Analysis (IPA) we observed that the majority of the differentially expressed phosphoproteins were highly interconnected and belong to two major intracellular signaling pathways.
Twelve of the 27 identified phosphoproteins were revealed to be interconnected through one signaling pathway (Fig. 9A). LMNA and G3BP1 are involved in this pathway. They are all connected, directly or indirectly through 3 signaling hub proteins, v-myc myelocytomatosis viral oncogene homolog (c-myc), interferon gamma (IFNG), and retinoic acid, a signal molecule involved in cellular differentiation and response to extracellular stimuli. These factors are well-known to influence the behavior of breast cancer cells through multiple mechanisms, including progression [23], inflammation [24], proliferation, and apoptosis [25]. In another regulatory pathway, another 13 of the identified phosphoproteins are interconnected directly, or indirectly, through hepatocyte nuclear factor 4 alpha (HNF4A) or transforming growth factor beta 1 (TGFB1), a signaling molecule that controls proliferation, differentiation, and other functions in many cell types (Fig. 9B). The interconnection between proteins identified in this study with known cancer-associated factors implies a role for these proteins in cancer progression or metastasis.
Figure 9.
Pathway network models 1 (A) and 2 (B). A solid line indicates direct interaction; a dashed line indicates indirect interaction; a line without arrowhead indicates binding; an arrow from protein A to protein B indicates that A acts on B. Node shapes are indicative: triangle, kinase; diamond, enzyme; hexagon, translation regulator; trapezoid, transporter; oval (horizontal), transcription regulator; oval (vertical), transmembrane receptor. Proteins identified in this screen are marked in shadow.
Lamins are components of the nuclear lamina, a fibrous layer on the nucleoplasmic side of the inner nuclear membrane, which is thought to provide a framework for the nuclear envelope and may also interact with chromatin. Functional analysis of phosphorylation sites in human lamin A indicates the phosphorylation of T19 (Threonine), S22, S403, and S404 in controlling lamin disassembly, nuclear transport and assembly [26]. In a pathogenesis study, lamin A phosphorylation was reported to be associated with myoblast activation and involved in the pathogenic mechanism of Emery-Dreifuss muscular dystrophy and limb girdle muscular dystrophy 1B [27]. Furthermore, studies have demonstrated that lamin A Ser404 is a nuclear target of Akt phosphorylation in C2C12 cells and implicated Akt phosphorylation of lamin A in the correct function of the nuclear lamina (Fig. 9A) [28]. The irregularity of the nuclear envelope, whose framework is supported by lamin, has been observed to significantly correlate with lymph node metastases in breast cancers [29]. These findings suggest that the phosphorylation of LMNA might play a role in the decoration of the nuclear envelope in the cancer cell during metastasis. Our results show a marked difference in the phosphorylation status of nuclear lamins between the two cell lines under study. Previous reports have shown that in some models, cells with greater metastatic propensity display more mesenchymal properties than their less metastatic counterparts. One such property can be slower proliferation and cell cycle progression, which could be reflected in a difference in the phosphorylation state of nuclear lamins. We have previously performed comprehensive characterization of our model [2–4] and very little difference between proliferation rate or cell cycle progression is observed. In fact, the metastatic cell line M4A4 proliferates at a rate approximately 20% faster than NM2C5 cells.
G3BP1 is an hnRNA-binding protein and an element of the Ras signal transduction pathway. It is a DNA-unwinding enzyme which can unwind partial RNA/DNA and RNA/RNA duplexes in an ATP-dependent fashion. It binds specifically to the Ras-GTPase-activating protein by associating with its SH3 domain. In quiescent cells, G3BP1 is hyperphosphorylated on serine residues, and this modification is essential for its activity. G3BP1 harbors a phosphorylation-dependent RNase activity which specifically cleaves the 3′-untranslated region of human c-myc mRNA (Fig. 9A) [30]. C-myc is a multifunctional oncogene and it plays a role in cycle progression, apoptosis and cellular transformation. Its overexpression is found during progression and distant metastasis of hormone-treated breast cancer [31]. It is possible that (de)phosphorylation of G3BP1 regulates interaction with c-myc, supporting a role for differential phosphorylation of this protein in the metastatic process. In addition, the growth factor heregulin beta 1 stimulation of breast cancer cells promotes phosphorylation of G3BP1 and increased the association of G3BP1 with GTPase-activating protein, again suggesting a role for G3BP1 in cancer progression [32].
5 Conclusion
This study describes a novel comparative phosphorylation strategy and application of this analysis to a human cell line model of tumor metastasis. The model consists of a pair of monoclonal cell lines derived from the same tumor source, but that have opposite metastatic propensity in murine xenograft models. LC-MS/MS based spectral counting analysis leads to the reliable identification of altered phosphorylation events in cells of distinct phenotype. This label-free, relative quantification of the phosphoproteome of complex samples enabled us to find new connections between the ability of cancer cells to establish metastasis in distant organs and altered expression levels of specific phosphorylated proteins. Biological interpretation of our data suggests that the phosphorylation of isoform A of lamin A/C and GTPase activating protein binding protein 1 may be involved in the metastatic behavior of human breast cancer. Further investigations using this strategy hold promise for elucidating mechanisms involved in tumor progression and identifying novel therapeutic targets for potentially ameliorating the fatal spread of disease.
Supplementary Material
Acknowledgments
This work was supported in part by the National Cancer Institute under grant R01CA100104 (D.M.L) and R01CA108597 (S.G) and the National Institutes of Health under grant R01GM49500 (D.M.L). We also thank Dr. Alexei Nesvizhskii and Damian Fermin for assistance in the spectral count work.
Abbreviations
- DDNL
data-dependent neutral loss
- FDR
false discovery rate
- GO
Gene Ontology
- IPA
Ingenuity Pathways Analysis
- MS
mass spectrometry
- MS2
MS/MS
- MS3
MS/MS/MS
- NSAF
normalized spectral abundance factor
- TiO2
titanium dioxide
- TPP
Trans-Proteomic Pipeline
- ZrO2
zirconium dioxide
Footnotes
The authors have declared no conflict of interest.
References
- 1.Kreunin P, Urquidi V, Lubman DM, Goodison S. Proteomics. 2004;4:2754–2765. doi: 10.1002/pmic.200300767. [DOI] [PMC free article] [PubMed] [Google Scholar]
- 2.Urquidi V, Sloan D, Kawai K, Agarwal D, et al. Clin Cancer Res. 2002;8:61–74. [PubMed] [Google Scholar]
- 3.Goodison S, Yuan J, Sloan D, Kim R, et al. Cancer Res. 2005;65:6042–6053. doi: 10.1158/0008-5472.CAN-04-3043. [DOI] [PMC free article] [PubMed] [Google Scholar]
- 4.Goodison S, Kawai K, Hihara J, Jiang P, et al. Clinical Cancer Research. 2003;9:3808–3814. [PubMed] [Google Scholar]
- 5.Leth-Larsen R, Lund R, Hansen HV, Laenkholm AV, et al. Molecular & Cellular Proteomics. 2009;8:1436–1449. doi: 10.1074/mcp.M800061-MCP200. [DOI] [PMC free article] [PubMed] [Google Scholar]
- 6.Montel V, Huang TY, Mose E, Pestonjamasp K, Tarin D. American Journal of Pathology. 2005;166:1565–1579. doi: 10.1016/S0002-9440(10)62372-3. [DOI] [PMC free article] [PubMed] [Google Scholar]
- 7.Krueger KE, Srivastava S. Mol Cell Proteomics. 2006;5:1799–1810. doi: 10.1074/mcp.R600009-MCP200. [DOI] [PubMed] [Google Scholar]
- 8.Mueller LN, Brusniak MY, Mani DR, Aebersold R. J Proteome Res. 2008;7:51–61. doi: 10.1021/pr700758r. [DOI] [PubMed] [Google Scholar]
- 9.Rikova K, Guo A, Zeng Q, Possemato A, et al. Cell. 2007;131:1190–1203. doi: 10.1016/j.cell.2007.11.025. [DOI] [PubMed] [Google Scholar]
- 10.Ishihama Y, Oda Y, Tabata T, Sato T, et al. Mol Cell Proteomics. 2005;4:1265–1272. doi: 10.1074/mcp.M500061-MCP200. [DOI] [PubMed] [Google Scholar]
- 11.Old WM, Meyer-Arendt K, Aveline-Wolf L, Pierce KG, et al. Mol Cell Proteomics. 2005;4:1487–1502. doi: 10.1074/mcp.M500084-MCP200. [DOI] [PubMed] [Google Scholar]
- 12.Ulintz PJ, Bodenmiller B, Andrews PC, Aebersold R, Nesvizhskii AI. Mol Cell Proteomics. 2008;7:71–87. doi: 10.1074/mcp.M700128-MCP200. [DOI] [PubMed] [Google Scholar]
- 13.Yu LR, Zhu Z, Chan KC, Issaq HJ, et al. J Proteome Res. 2007;6:4150–4162. doi: 10.1021/pr070152u. [DOI] [PubMed] [Google Scholar]
- 14.Stulemeijer IJE, Joosten M, Jensen ON. Journal of Proteome Research. 2009;8:1168–1182. doi: 10.1021/pr800619h. [DOI] [PubMed] [Google Scholar]
- 15.Jiang X, Han G, Feng S, Jiang X, et al. J Proteome Res. 2008;7:1640–1649. doi: 10.1021/pr700675j. [DOI] [PubMed] [Google Scholar]
- 16.Liu H, Sadygov RG, Yates JR., 3rd Anal Chem. 2004;76:4193–4201. doi: 10.1021/ac0498563. [DOI] [PubMed] [Google Scholar]
- 17.Zybailov B, Mosley AL, Sardiu ME, Coleman MK, et al. J Proteome Res. 2006;5:2339–2347. doi: 10.1021/pr060161n. [DOI] [PubMed] [Google Scholar]
- 18.Paoletti AC, Parmely TJ, Tomomori-Sato C, Sato S, et al. Proc Natl Acad Sci U S A. 2006;103:18928–18933. doi: 10.1073/pnas.0606379103. [DOI] [PMC free article] [PubMed] [Google Scholar]
- 19.Xie X, Li S, Liu S, Lu Y, et al. Biochim Biophys Acta. 2008;1784:276–284. doi: 10.1016/j.bbapap.2007.11.008. [DOI] [PubMed] [Google Scholar]
- 20.Hunter T, Sefton BM. Proc Natl Acad Sci U S A. 1980;77:1311–1315. doi: 10.1073/pnas.77.3.1311. [DOI] [PMC free article] [PubMed] [Google Scholar]
- 21.Olsen JV, Blagoev B, Gnad F, Macek B, et al. Cell. 2006;127:635–648. doi: 10.1016/j.cell.2006.09.026. [DOI] [PubMed] [Google Scholar]
- 22.Lu B, Ruse C, Xu T, Park SK, Yates J., 3rd Anal Chem. 2007;79:1301–1310. doi: 10.1021/ac061334v. [DOI] [PMC free article] [PubMed] [Google Scholar]
- 23.Chen Y, Olopade OI. Expert Rev Anticancer Ther. 2008;8:1689–1698. doi: 10.1586/14737140.8.10.1689. [DOI] [PMC free article] [PubMed] [Google Scholar]
- 24.Calogero RA, Cordero F, Forni G, Cavallo F. Breast Cancer Res. 2007;9:211. doi: 10.1186/bcr1745. [DOI] [PMC free article] [PubMed] [Google Scholar]
- 25.Simeone AM, Tari AM. Cell Mol Life Sci. 2004;61:1475–1484. doi: 10.1007/s00018-004-4002-6. [DOI] [PMC free article] [PubMed] [Google Scholar]
- 26.Haas M, Jost E. Eur J Cell Biol. 1993;62:237–247. [PubMed] [Google Scholar]
- 27.Cenni V, Sabatelli P, Mattioli E, Marmiroli S, et al. J Med Genet. 2005;42:214–220. doi: 10.1136/jmg.2004.026112. [DOI] [PMC free article] [PubMed] [Google Scholar]
- 28.Cenni V, Bertacchini J, Beretti F, Lattanzi G, et al. J Proteome Res. 2008;7:4727–4735. doi: 10.1021/pr800262g. [DOI] [PubMed] [Google Scholar]
- 29.Bussolati G, Marchio C, Gaetano L, Lupo R, Sapino A. J Cell Mol Med. 2008;12:209–218. doi: 10.1111/j.1582-4934.2007.00176.x. [DOI] [PMC free article] [PubMed] [Google Scholar]
- 30.Tourriere H, Gallouzi IE, Chebli K, Capony JP, et al. Mol Cell Biol. 2001;21:7747–7760. doi: 10.1128/MCB.21.22.7747-7760.2001. [DOI] [PMC free article] [PubMed] [Google Scholar]
- 31.Planas-Silva MD, Bruggeman RD, Grenko RT, Smith JS. Exp Mol Pathol. 2007;82:85–90. doi: 10.1016/j.yexmp.2006.09.001. [DOI] [PubMed] [Google Scholar]
- 32.Barnes CJ, Li F, Mandal M, Yang Z, et al. Cancer Res. 2002;62:1251–1255. [PubMed] [Google Scholar]
Associated Data
This section collects any data citations, data availability statements, or supplementary materials included in this article.


