

Abstract
Mini-chromosome maintenance proteins (Mcm’s) are components of the DNA replication licensing complex. In vivo, reduced expression or activity of Mcm proteins has been shown to result in highly penetrant early onset cancers (Shima et al., 2007; Pruitt et al., 2007 and stem cell deficiencies (Pruitt et al., 2007). Here we use MEFs from an Mcm2 deficient strain of mice to show by DNA fiber analysis that origin usage is decreased in Mcm2 deficient cells under conditions of HU mediated replication stress. DNA damage responses (DDR) resulting from HU and additional replication dependent and independent genotoxic agents were also examined and shown to function at wild type levels. Further, basal levels of many components of the DNA damage response were expressed at wild type levels demonstrating that there is no acute replicative stress under normal growth conditions. Only very modest, 1.5–2 fold increases in the basal levels of γ-H2AX, p21cip1 and 53bp foci were found, consistent with a slight chronic elevation in DDR pathways. The one condition in which a larger difference between wt and Mcm2 deficient cells was found occurred following UV irradiation and may reflect the role of Chk1 mediated suppression of dormant origins. In vivo, abrogating p53 mediated DDR in Mcm2 deficient mice results in increased embryonic lethality and accelerated cancer formation in surviving mice. Further, p53 mutation rescues the negative effect of Mcm2 deficiency on the survival of neural stem cells in vitro; however, the enhanced survival correlates with increased genetic damage relative to Mcm2 wt cells carrying the p53 mutation. Together these results demonstrate that even relatively minor perturbations to primary or dormant replication origin usage contribute to accelerated genetic damage in vivo. Additionally, these studies demonstrate that tumor types resulting from Mcm2 deficiency are strongly affected by interaction with both genetic background and p53.
Keywords: mini-chromosome maintenance protein, p53, licensing factor, cancer tumor spectrum, loss of heterozygosity
Introduction
It has been hypothesized that the accumulation of genetic damage in somatic stem cells results in both age related tissue decline and cancer. Much of the support for this hypothesis is derived from mouse models where it has been shown that there is high degree of overlap in the genes that affect the rate of aging generally and the rate of cancer incidence. Specifically, studies of mutations in the genes responsible for mediating cell cycle arrest following DNA damage and repairing damaged DNA suggest that common mechanisms affect both processes (e.g. Lombard et al., 2005; Rossi et al., 2008). It has further been suggested that, in mammals, the target for this damage is somatic stem cells since, although such damage can be eliminated from the differentiated components of a replenishing tissue, genetic damage within the stem cell is permanent.
The mechanisms leading to genetic damage initially have been less well defined and may have multiple causes. However, one potential source that is likely to play a significant role in organisms such as mammals, which depend heavily on tissue replacement, is errors occurring during DNA replication. This hypothesis is supported by the phenotypes of two lines of mice, Mcm4Chaos3 and Mcm2IresCreERT2, each of which carry an allele of a component of the DNA replication machinery resulting in hypomorphic or deficient expression (Shima et al., 2007; Pruitt et al., 2007). In each case, the mice carrying these alleles exhibit an elevated rate of cancer incidence.
Mcm’s (minichromosome maintenance proteins) consist of a family of 6 proteins (Mcm2-7), which are components of the DNA replication licensing complex that binds to origins of replication early in the G1 phase of the cell cycle (reviewed in Blow and Dutta, 2005; Forsburg, 2004; Lei, 2005; Tye, 1999). This complex is required for initiation of DNA replication during the subsequent S-phase but is displaced from origins on initiation of replication; hence, one role of the Mcm’s is in preventing multiple rounds of replication from a single origin and suppression of endo-reduplication. One consequence of reduced Mcm activity or concentration could then be a reduction in the number of origins that are used during S-phase. Many more origins are licensed during G1 than normally initiate during S phase (reviewed in Hyrien et al., 2003). However, when the movement of replication forks is inhibited, initiation occurs at otherwise dormant origins. Initiation from these origins is thought to help ensure that S phase is completed. Consistent with this role, studies using siRNA mediated suppression of Mcm’s in conjunction with DNA fiber analysis have shown that it is possible to reduce the number of MCM proteins loaded onto DNA to levels that do not impair DNA replication under normal growth conditions but which result in reduced dormant origin usage under conditions of replicative stress (Ge et al., 2007, Ibarra et al., 2008). Finally, Mcm’s have been implicated as mediators of the DNA damage response when the replisome encounters a genetic lesion (Cortez et al., 2004). These multiple roles of the Mcm proteins complicate the interpretation of the phenotypes of Mcm hypomorphic or deficient mice.
Here we have examined the effect of the Mcm2IresCreERT2 allele (which is referred to as Mcm2def in the present report), that is known to result in expression of Mcm2 at a level that is ~1/3 of wild type, on the DNA damage response in MEFs in vitro and the interaction of this Mcm deficiency allele with a p53 null allele by genetic crosses in vivo.
Results
1. DNA fiber analysis confirms reduced dormant origin usage in Mcm2 deficient MEFs
Prior studies using siRNA to suppress expression of various Mcm’s have shown, by DNA fiber analysis, that origin usage is suppressed under conditions of replicative stress (Ge et al., 2007, Ibarra et al., 2008). Here, we have utilized fiber analysis of MEFs, pulsed with CldU followed by IdU, to determine if a similar reduction in origin usage is observed in genetically modified Mcm2 deficient cells the presence of HU. Figure 1A shows an example of a double labeled fiber. Figure 1B demonstrates that the inter-origin distance is not significantly different in untreated Mcm2wt and Mcm2def MEFs (59.2 kb, sem +/− 5.5, and 58.5 kb, sem +/− 2.0, respectively; p = 0.85). In contrast, following treatment with 200 μM HU, the inter-origin distance in wt cells decreases to significantly to 42.0 kb (sem +/− 1.6, p = 3.9 × 10⁻⁶ relative to wt no HU), whereas HU treated Mcm2def cells show a minimal decrease to 56.1 kb (sem +/− 2.4, p = 0.42, relative to Mcm2def no HU). These observations confirm that replication stress results in recruitment of dormant origins in wt cells and that this recruitment is compromised in Mcm2 deficient cells.
Figure 1.

Passage 3 MEFs derived from Mcm2wt/wt and Mcm2def/def embryos, either untreated or treated with 200 μM HU for 4 h were pulsed with CldU followed by IdU. DNA was spread on glass slides, and labeled tracks were detected by immuno-fluorescence (e.g. panel A; CldU = green, IdU = red). The distribution of origin-to-origin distances for origins initiating during the CldU labeling phase were determined and are plotted for untreated cells (panel B) and HU treated cells (panel C) were open bars indicate Mcm2wt/wt and filled bars indicate Mcm2def/def cells. The mean inter-origin distance and s.e.m. in kb is: Mcm2wt/wt no HU, 59.2 +/− 5.5; Mcm2def/def no HU, 58.5 +/−2.0, Mcm2wt/wt plus HU, 42.0 +/− 1.6; Mcm2def/def plus HU, 56.1 +/− 2.4.
2. DNA damage response in Mcm2 deficient cells in vitro
Prior studies have suggested that the failure to initiate DNA replication from primary or dormant origins causes an increase in basal levels of genetic damage (Pruitt et al., 2007, Ge et al., 2007, Ibarra et al, 2008). Alternatively, Mcm’s may play a role in mediating the DNA damage response leading to an inefficient response to any source of genetic damage (reviewed in Forsburg, 2004). Here, components of the DNA damage response were characterized following treatment of Mcm2wt and Mcm2def MEFs with non-replication and replication related genotoxic agents (γ-irradiation or UV-irradiation and campthotecin, CPT, or hydroxyurea, HU, respectively; Figure 2A and B, data not shown). γH2AX, p-ATM, p21, p-p53(ser15), pChk1(ser345), and hyper-phosphorylated RPA all show essentially equivalent levels of induction in response to each of these genotoxic stresses with the exception that pChk1(ser345) and subsequently total p53 levels are induced to even higher levels in Mcm2 deficient, relative to wt, MEFs following UV irradiation. Similarly, cell cycle analysis by FACS shows that Mcm2 deficient cells retain a robust ability to arrest following treatment with CPT (Figure 2, panel D), HU, or γ-irradiation (data not shown). In contrast, cell cycle analysis of UV treated cells showed a significant and dose dependent increase in G1-arrest in Mcm2wt/def and Mcm2def/def cells relative to wt (Figure 3). These observations demonstrate that the DNA damage response remains intact when Mcm2 is reduced to the levels occurring in the genetically modified Mcm2def line of mice. The enhanced response of Mcm2 deficient cells to UV (elevated pChk1, total p53 and G1 arrest) may reflect a specific role of Chk1 in suppressing the activity of dormant origin usage (e.g. Ge et al., 2007; Ibarra et al., 2008).
Figure 2.

Panels A-C are western blot analyses of Mcm2wt/wt and Mcm2def/def MEFs either untreated (−) or following γ-irradiation (γ, 1 Gy), hydroxyurea (HU, 200 μM), camptothecin (CPT, 1 μM) or ultra-violet (UV, 100 J) at various times of treatment in the case of HU and CPT or following irradiation in the case of γ and UV. Assays for Mcm2, p-p53-ser15, pChk1-ser345, total p53, and RPA 32, where hyper- and low-phosphorylated forms of RPA are marked, where performed as indicated in the figure. Panel D shows the cell cycle distribution of Mcm2wt/wt and Mcm2def/def MEFs following CPT treatment as assayed by FACS. For FACS, passage 3 MEFs were harvested and fixed either untreated or after 7 hr 500 nM CPT treatment or CPT following 40 minute 5 mM caffeine (Caff) pretreatment as indicated. FACS was performed on 70% ethanol fixed cells following propidium iodide (PI) staining of DNA and RNase treatment.
Figure 3.

Cell cycle distribution of Mcm2wt/wt, Mcm2wt/def and Mcm2def/def MEFs following UV irradiation. Passage 3 MEFs, either untreated or treated with 5, 10, or 50 mJ of UV irradiation, were harvested 7 hours following treatment and analyzed as in Figure 2. FACS analyses for samples treated with 10 mJ are shown in the upper portion of the figure and the proportion of cells in G1, S and G2/M phases of the cell cycle is plotted as a function of UV dose for each genotype in the lower portion of the figure.
These studies also demonstrate the basal levels of components of the DNA damage response are also largely unaffected. Only a marginal increase (~1.5X) in the basal levels of p21, and in some experiments γH2AX, is observed in untreated Mcm2 deficient relative to wt cells. A small increase, ~1.5 fold, of 53bp foci was also seen in untreated Mcm2 deficient cells (supplementary information) which is consistent with the prior observation of an ~1.5 fold increase in γH2AX foci in satellite cells derived from Mcm2 deficient mice (Pruitt et al., 2007). These observations are consistent with marginal elevation in the DNA damage response in Mcm2 deficient cells that could reflect a small constitutive elevation in the rate of genetic damage in these cells.
3. Interaction of Mcm2 deficiency and p53 null alleles in vivo
Even a small increase in the basal rate of replication related damage could have important consequences in the animal. To examine the interaction of Mcm2 deficiency with the p53 mediated DNA damage response in vivo, F1 Mcm2wt/def; p53wt/null mice resulting from a cross of 129Sv:Mcm2wt/def with BALB/c:p53wt/null mice were intercrossed. Progeny of the cross were genotyped for the Mcm2 and p53 alleles using PCR and cohorts of 12 mice carrying each of the 9 possible genotypes were established for longevity studies, with the exception of the Mcm2def/def;p53null/null genotype. At weaning, the Mcm2def/def;p53null/null genotype was severely under-represented relative to the expected Mendelian ratio (Figure 4) and of 255 mice genotyped only three progeny carrying this genotype were found. Reduced recovery of the Mcm2def/def;p53null/null genotype apparently results from a late embryonic lethal phenotype since this genotype was found at normal Mendelian ratios in E14.5 embryos (5 of 84). No gross morphological defects could be found at this stage.
Figure 4.
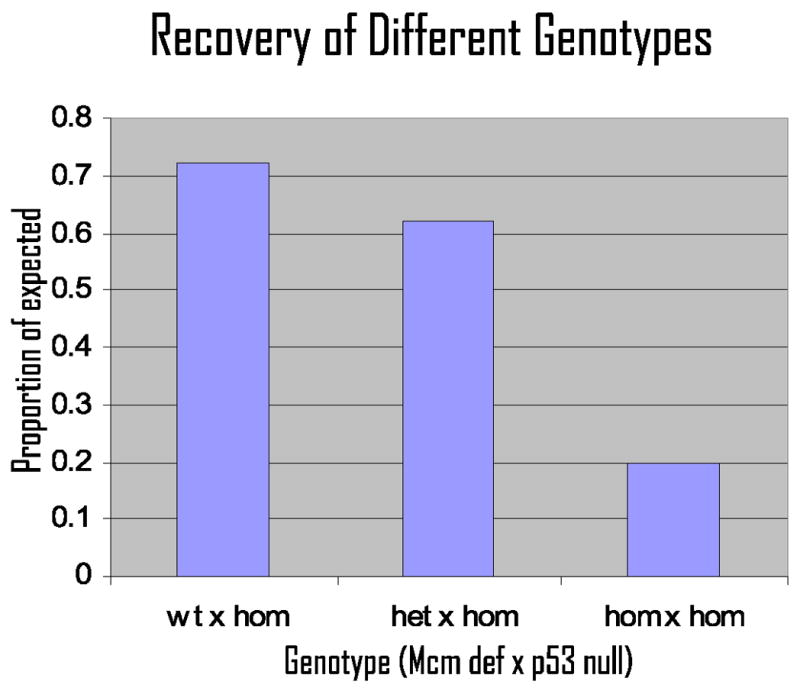
Mcm2def/def;p53null/null genotype is severely under-represented relative to the expected Mendelian ratio. Genotypes of 255, 6–8 month old, progeny from a cross between 129Sv;BALB/c:Mcm2wt/def;p53wt/null x same mice were determined and the proportion of mice with the indicated genotypes, relative to the expected number, is plotted as indicated in the figure.
Survival of mice of all of the different genotypes is shown in Figure 5a and subsets of these data are shown in figures 5b, and 5c. Figure 5b shows mice that are homozygous for the Mcm2 deficiency allele but carry different levels of p53 and demonstrates that the absence of the p53 mediated DNA damage response further accelerates the already early lethality observed Mcm2 def/def mice in the presence of wt p53 activity. There is, however, no apparent effect of p53 dosage since mice that are wt or heterozygous for the p53 null allele show similar longevity. Figure 5c shows the effect of Mcm2 dosage in the context of animals lacking p53. In this case a clear effect of Mcm2 dosage on longevity is seen where p53 null mice expressing ~1/3 (Mcm2def/def), 2/3 (Mcm2wt/def) or wt levels of Mcm2 have a median life span of ~9 weeks, 18 weeks or 53 weeks respectively.
Figure 5.

Survival of mice of different Mcm2 deficiency and p53 genotypes.
Panel A: Survival plot for mice of 9 different Mcm2 and p53 geneotypes on mixed 129/Sv:BALB/c genetic backgrounds. In the key the genotype indicated is (Mcm2 x p53). The y-axis is the fraction of mice surviving plotted against weeks of survival on the x-axis. Each cohort consists of 12 mice except the hom x hom class for which only 3 animals were identified.
Panel B: The subset of data from panel A representing mice homozygous for the Mcm2 deficiency allele and wt, heterozygous or homozygous for the p53 null allele.
Panel C: The subset of data from panel B representing mice homozygous for the p53 null allele and wt, heterozygous or homozygous for the Mcm2 deficiency allele.
4. p53 mutation rescues neurosphere growth
Prior studies of Mcm2def/def mice have shown that neural stem/progenitor cells are reduced relative to wild animals by both in situ analyses of the SVZ and clonogenic neurosphere assays (Pruitt et al., 2007). One explanation for this effect is that it is a secondary consequence of the DDR to elevated levels of genetic damage in Mcm2 deficient mice. To test this idea, we sought to determine if the absence of a p53 mediated DNA damage response would allow rescue of neural stem/progenitor cells in Mcm2def/def mice. However, Mcm2def/def:p53null/null mice are rare and when they occur they succumb to tumors at very early times and prior to the point at which Mcm2def/def mice exhibit a reduction in neurogenesis relative to wt (data not shown). Hence, to address the effect of p53 mutation in Mcm2 deficient neural stem/progenitor cells we have recovered neurospheres from E14.5 day embryos, a time at which no reduction in representation of the Mcm2def/def:p53null/null genotype has yet occurred. An initial experiment, in which neurospheres were derived from Mcm2wt/wt, Mcm2wt/def, and Mcm2def/def E14.5 embryos and assessed in a clonogenic assay on day 10 of culture (Maslov et al., 2004; Maslov 2007), demonstrated that the number and size of neurospheres recovered at this stage was similar. However, by 20 days in vitro with re-feeding but without passaging, the proportion of the initial cultures that survived was reduced relative to wt in Mcm2wt/def and to a greater degree in Mcm2def/def cultures (not shown). A similar assay of neurospheres derived from Mcm2wt/wt;p53wt.wt, Mcm2def/def;p53wt/wt Mcm2wt/wt;p53null/null and Mcm2def/def;p53null/null E14.5 day embryos from was performed to determine whether the reduced survival of Mcm2def/def neurospheres was dependent on p53 except that beginning at day 10 of culture cells were passaged 1:2 every two to three days. As previously no difference in the recovery or size of neurospheres was apparent at day 10. Survival of individual cultures with additional passaging is show in Figure 6. Results from this experiment confirm that Mcm2 deficiency results in reduced ability of neurospheres to re-grow following passage in the context of wild-type p53 activity. However, neurospheres carrying the p53 null mutation show no reduction in their ability to passage, and show improved survival over p53 wt neurospheres, even when Mcm2 is deficient.
Figure 6.

Effect of genotype on neural stem cell survival in vitro and accumulation of genetic damage. Survival of clonal neurosphere cultures from E14.5 day Mcm2wt/wt;p53wt/wt (◇), Mcm2def/def;p53wt/wt (□), Mcm2wt/wt;p53null/null (x) and Mcm2def/def;p53null/null (△) embryos with increasing numbers of passages in vitro is plotted in panel A. Panel B shows an example of Mit marker analysis where agarose gels show PCR products from D3Mit14 for 10 neurospheres each derived from Mcm2wt/wt;p53null/null and Mcm2def/def;p53null/null embryos as indicated. M is a marker lane where sizes are shown to the left and 129/Sv and BALB/c control lanes are shown on the right of each gel. Panel C shows a summary of Mit marker analysis for neurospheres derived from embryos of each of four genotypes as indicated. The number of LOH events/the total neurospheres analyzed is given for each Mit marker and corresponding genotype.
To directly measure the effect of Mcm2 deficiency on the accumulation of genetic damage, we have assessed loss of heterozygosity (LOH) at a variety of Mit markers in neurospheres derived from embryos of each of the four genotypes described above (Figure 6, panel C). No LOH was detectable in Mcm2wt/wt neurospheres regardless of p53 status. In contrast, 1.4% (one event in 72 assays) and 7.8% (7 events in 90 assays) LOH was found in Mcm2def/def; p53wt/wt and Mcm2def/def;p53null/null neurospheres, respectively.
4. Interaction of Mcm2 deficiency and genetic background
The mixed genetic background of mice resulting from the backcross described above has allowed an assessment of the effects of genetic background on the phenotype resulting from Mcm2 deficiency in comparison to the effects of this allele on the pure 129Sv background on which it was originally derived. Mcm2wt/wt, Mcm2wt/def and Mcm2def/def mice on the 129Sv background have now been followed for 100 weeks. Previous studies have shown that Mcm2def/def mice on the 129Sv background are short-lived with a median lifespan of only ~12 weeks (Pruitt et al., 2007). A similar value of ~15 weeks was observed here for a slightly larger cohort. Further 100% of these mice exhibit thymomas on necropsy, although additional secondary polyps in the small intestine or colon and enlarged spleens are observed in a subset of these mice. The survival of Mcm2def/def;p53wt/wt mice on a mixed 129Sv x BALB/c background is shown in comparison to that of Mcm2def/def mice on the 129Sv background in figure 7. Initially, the survival of Mcm2def/def mice on the mixed genetic background tracks with that of the 129Sv background such that by 15 weeks half of the mice on each genetic background have succumbed. However, for mice that survive beyond 15 weeks there is a substantial difference in longevity where mice on a mixed genetic background have substantially longer life-spans.
Figure 7.

Comparison of survival of mice that are wt, heterozygous and homozygous for the Mcm2 deficiency allele and wt for p53 on 129Sv and mixed 129Sv x BALB/c genetic backgrounds.
Tumorigenesis is also affected by background (Table 1). Mcm2 deficiency on the 129Sv genetic background results in a remarkably high specificity and penetrance of tumor formation where all of the Mcm2def/def mice on this background in a prior study (Pruitt et al., 2007) and in the present study succumbed to thymomas. Remarkably, necropsies performed on Mcm2def/def;p53wt/wt mice of mixed 129Sv:BALB/c genetic background revealed that, only 3 of 10 of these mice exhibited thymomas. Spleen involvement without evidence of thymoma was found in three additional mice. Although spleen is a site where tumors have been found on the 129Sv genetic background, these were always observed in mice in which the primary cause of morbidity was thymoma. Three liver tumors and one lung tumor were also observed on the mixed genetic background, which are sites at which tumors have not been found on the 129Sv background. Tumor spectrum is also affected by the interaction of Mcm2 deficiency and loss or reduction of p53 activity. A variety of tumors that have not been observed in mice carrying either mutant Mcm2 or p53 alleles alone are found in mice carrying at least one mutant allele in both genes.
Table 1. Sites of Tumor Occurring on Different Mcm2 Deficient x p53 Null Genotypes.
Sites of tumors occurring on different Mcm2 deficiency x p53 null allele combinations. Necropsies were performed on moribund mice of various geneotyes as indicated. The number of mice carrying overt tumors in each of the indicated tissue types is shown where red highlights indicate tumor types that were not observed on the 129/Sv genetic background.
|
Mcm(def) p53 (null) |
wt wt |
het wt |
hom wt |
wt het |
het het |
hom het |
wt hom |
het hom |
hom hom |
|---|---|---|---|---|---|---|---|---|---|
| Thymus | 0 | 0 | 3 | 0 | 0 | 8 | 1 | 1 | 3 |
| Lymph | 0 | 0 | 0 | 1 | 0 | 0 | 4 | 4 | 0 |
| Spleen | 0 | 0 | 3 | 0 | 1 | 0 | 0 | 0 | 0 |
| Lung | 0 | 0 | 1 | 0 | 0 | 0 | 0 | 0 | 0 |
| Liver | 0 | 0 | 3 | 0 | 1 | 0 | 0 | 0 | 0 |
| Spinal | 0 | 0 | 0 | 0 | 0 | 1 | 0 | 0 | 0 |
| Colon | 0 | 0 | 0 | 0 | 0 | 0 | 0 | 1 | 0 |
| Kidney | 0 | 0 | 0 | 0 | 1 | 0 | 0 | 1 | 0 |
| Testes | 0 | 0 | 0 | 0 | 0 | 0 | 0 | 1 | 0 |
Discussion
Mcm deficiencies on defined genetic backgrounds result in increased cancer incidence where the tumors show a high degree of penetrance and remarkable specificity in the types that are formed. Mcm4 deficiency resulting from the Chaos3 allele yields a >80% penetrance of mammary adenocarcinomas with a mean latency of 12 months in female C3H:Mcm4Chaos3/Chaos3 mice (Shima et al., 2007). In the case of the Mcm2 deficiency allele studied here and previously (Pruitt et al., 2007), there is a 100% penetrance of thymoma in 129Sv:Mcm2def/def affecting both males and females with a mean latency of less than 4 months. It is clearly important to understand the mechanisms by which Mcm deficiencies enhance tumorigenesis and result in profound bias toward specific tumor types in these animals.
In vitro studies have identified several potential mechanisms by which deficiencies in Mcm proteins could result in genetic damage. In different studies, Mcm levels were suppressed in human cell lines, to between nearly undetectable through ~25% of wt, via RNA interference. Severe reduction of Mcm7 or Mcm2 has been shown to impair entry into G1 mediated by cyclin D (Liu et al., 2009) and/or Cdk2 (Nevis et al., 2009) and to result in entry of cells into a “pseudo-quiescent” state. However, wild type levels of Mcm expression are in significant excess of what is required for licensing of most origins and reduction of Mcm levels to as little as 10% of wt levels allows entry into S-phase, efficient replication fork progression and cellular proliferation at the rate of control cells for at least several divisions (Ibarra et al., 2008). Nonetheless, cells grown under these conditions are hypersensitive to genotoxic agents, exhibit an enhanced DDR, accumulate genetic lesions and, over a period of ~5 days, activate a checkpoint response that prevents continued division (Ibarra et al., 2008). Somewhat less severe reduction in Mcm levels to ~25% of wt (Ge et al., 2007), similar to the level of Mcm2 expression in the Mcm2def/def MEFs used here, allows more prolonged cell proliferation and alleviates much of the hypersensitivity to genotoxic agents. However, studies by both Ibarra et al., 2008 and Ge et al., 2007 show that, although origin usage in the absence of agents that induce replication fork arrest is similar between Mcm knockdown and control cells, in the presence of such agents the Mcm knockdown cells exhibited a greatly reduced ability to reinitiate DNA replication through the recruitment of dormant origins.
Here we show, by DNA fiber analysis, that MEFs derived from Mcm2 deficient mice exhibit a reduction in secondary origin usage under conditions of HU induced replication stress, similar to the results of Ge et al. (2007) and Ibarra et al. (2008). Further, Mcm2def/def MEFs show little difference from wt cells in their DNA damage response following treatment with genotoxic agents that act independently of replication (γ-irradiation) or to agents that depend on replication to generate genetic damage (CPT, HU).
Although the DDR is intact in Mcm2 deficient cells, basal levels of γ-H2AX and p21, and the frequency of 53bp foci, are marginally elevated in Mcm2def/def cells in the absence of genotoxic agents. One explanation for these observations is that Mcm2def/def cells have a slightly higher, but chronic, intrinsic rate of genomic damage relative to wild-type.
The major difference in DNA damage response between wt and Mcm2 deficient cells observed here occurs following UV irradiation. These differences include elevated phosphorylation of Chk1 (at two hours following treatment), elevated total p53 (at 8 hours following treatment) and enhanced G1 arrest (at 7 hours following treatment) where the G1 arrest is shown to be Mcm2 dose dependent. It is unlikely that this UV induced response is a direct result of slightly elevated basal levels of genetic damage. Rather, it may reflect an interaction between ATR, Chk1 and Mcm’s that is involved in mediating dormant origin usage. Prior studies have shown that dormant origin usage is suppressed by p-Chk1 under conditions of wt levels of Mcm proteins (Ge et al., 2007; Ibarra et al., 2008). Further, UV irradiation is known to result in ATR dependent phosphorylation of Chk1 (Heffernan et al., 2007). The observations presented here suggest that availability of Chk1 for ATR mediated phosphorylation is constrained by the level of Mcm’s, such that reduced Mcm concentration results in a hyper-activation of Chk1 following UV treatment. We speculate that suppression of Chk1 phosphorylation by chromatin bound Mcm’s could play a role during S-phase progression. Early in S-phase stalled replication forks may be overcome by initiation at dormant origins and a robust DNA damage response and cell cycle arrest is unwarranted. Suppression of Chk1 phosphorylation by Mcm proteins bound at dormant origins during early S-phase would result in dampening of Chk1 mediated cell cycle arrest. In contrast, late in S-phase the ability to overcome a stalled replication fork through initiating replication at an adjacent origin may become progressively more limited, requiring a more robust checkpoint response. Loss of chromatin bound Mcm’s as replication proceeds would then facilitate Chk1 phosphorylation. Consistent with this role, the phosphorylation of Chk-1 in response to UV in yeast is cell cycle dependent, increasing as cells progress through S-phase (Martinho et al., 1998; Miao et al., 2003).
Despite the limited evidence that Mcm2 deficiency results in replication stress in vitro, the interaction between the Mcm2def allele and a p53 null allele in vivo supports the possibility that Mcm2 deficient cells undergo an elevated level of replication related genetic damage. Mcm2def/def;p53null/null mice show a synergistic increase in embryonic lethality and reduction of longevity in the surviving mice. Additionally, whereas there is little phenotypic consequence observed in Mcm2wt/def heterozygotes in the context of wt p53 activity, in the absence of p53 Mcm2wt/def mice die at an accelerated rate relative p53 null Mcmwt/wt mice. This observation suggests that even a modest reduction of Mcm2 levels to ~2/3 of wt levels results in elevated genomic damage that is masked by the p53 mediated DDR. The observation that neurosphere cultures from Mcm2def/def embryos show reduced ability to passage relative to wt and that this reduction is dependent on p53 activity, is again consistent with an elevated basal level of genetic damage in Mcm2 deficient mice. Finally, direct measurement of genetic damage in the form of LOH, using clonally derived embryonic neurospheres, confirms this interpretation. In the absence of p53 activity no LOH was detectable in neurospheres that express wt Mcm2 levels whereas ~ 8% of the loci assayed showed LOH in Mcm2 deficient cells.
Elevation in the rate of random mutations throughout the genome would explain the increased cancer incidence observed in Mcm deficient mice but does not provide an adequate explanation for the striking specificity in the tumor types found in studies where Mcm deficiency occurred on an inbred genetic background (Shima et al., 2007; Pruitt et al., 2007). The present studies demonstrate that this specificity is not a result of Mcm2 deficiency per se but, rather, is tightly linked to genetic background. These observations are consistent with the finding that mice carrying the Mcm4Chaos3 mutation show non-mammary adeno-carcinoma tumor types on mixed genetic backgrounds (Shima et al., 2007). It is likely that polymorphisms in genes that affect the outcome of Mcm deficiency mediated genetic damage contribute to whether tumors will ultimately occur. The present study provides support for this possibility in that some effect of p53 status on tumor type is observed. The expanded spectrum of tumors occurring on Mcm2def/def;p53wt/wt mice on a mixed 129/Sv;BALB/c genetic background, relative to the same genotype on a straight 129/Sv genetic background could similarly reflect polymorphisms in genes that determine the outcome of Mcm2 deficiency mediated genetic damage. Nonetheless, polymorphic function of such genes seems unlikely to account for the remarkable specificity of tumor type on specific genetic backgrounds.
An explanation which can account for both the high penetrance of specific tumor types on defined genetic backgrounds, and the observation that this specificity is dependent on genetic background, is suggested by the effect of Mcm deficiency on the activity of primary or dormant origins. Since all potential origins in a cell are in competition for binding of components of the replication machinery, under conditions where this machinery is limiting the specific subset of origins with the weakest affinity for these components will be preferentially affected. These “weakest links” would then be expected to present sites at which damage is more likely to occur due to increased distance between origins or the inability to recovery from replication fork failure. Although replication origins are likely to be even more polymorphic than coding sequences, on a defined genetic background both chromosomal copies would be subject to accelerated genetic damage at the same subset of weakest origins. Under this circumstance, proximity of these sites to tumor suppressors that act preferentially in a particular cell type could account for the high penetrance of specific tumor types. In contrast, on a mixed genetic background, the weakest origins may differ between chromosomes resulting in delayed tumor onset and differences in tumor type.
Materials and Methods
MEF isolation and culture
Mouse embryonic fibroblasts were isolated from E12.5 or E13.5 embryos resulting from a cross between 129Sv:Mcm2wt/IRES-CreERT2 x same mice. MEFs were cultured in DMEM + 10% FBS and utilized at passage 3 following isolation.
Fiber Analysis
DNA fiber analysis was performed essentially as described in Jackson and Pombo (1998) and Ge et al., (2007). Passage 3 MEFs were labeled for 10 minutes with CldU, washed, and labeled for 10 minutes with IdU in the absence of HU or treated with 200 μM HU, labeled for 20 minutes with CldU, washed, and labeled for 20 minutes with IdU. CldU and IdU were detected as described previously (Maslov et al., 2004, 2007). Images of stained fibers were obtained by fluorescence microscopy using a 100X emersion lens. Origins initiating during the CldU portion of the labeling protocol were identified (based on the location of IdU) and the distances between these origins was measured.
FACS
Control MEFs, MEFs treated with 1μM CPT for 7h, MEFs pretreated with 5 mM caffine for 40 minutes followed by CPT, or MEFs exposed to 5, 10 and 50 milli-Joules (mJ) of UV irradiation followed by a 6hr incubation were prepared. After treatment, the cells were harvested by trypsinization, washed with PBS and fixed in 70% ethanol at −20°C. The following day the pellet was washed with 1% BSA in PBS and resuspended in Krishan Buffer (0.1% sodium citrate; 0.02 mg/ml RNaseA; 0.2% NP40; 0.05 mg/ml propidium iodide; 1N HCl). FACS (FACScan-Becton-Dickinson flow cytometer, FL2-A channel) was performed after two hours incubation in dark at room temperature.
Neurosphere analysis
Brains removed from 14.5 day-old embryos were minced in 1 ml DMEM/F12 (1/1) (GIBCO) containing L-glutamine (2 mM, GIBCO), human epidermal growth factor and human fibroblast growth factor-basic (20 ng/ml each, Sigma-Aldrich), B27 serum-free supplement (GIBCO) and gentamicin (50 μg/ml, GIBCO) followed by incubation with trypsin (0.25% trypsin-EDTA) for 15 min at 37°C. The material was then mixed with a pipet 20 times followed by incubation with 75 units DNaseI (Invitrogen) for 15 min at 37°C. Following thorough mixing with a pipet tip (15 times) 100 μl of a 1/333 dilution was added to 100 ml medium (described above) in 96 well flat bottom plates (Linbro/Titertek, MP Biomedicals, Inc.) Two plates were set up for each embryo representing a particular genotype determined by PCR. Cultures were fed on days 2, 4, 6, and 8 by removal of 100 μl medium and addition of fresh 100 μl medium. On day 10 the total number of neurospheres corresponding to each genotype was counted, wells containing single colonies were resuspended and half of the cells were transferred to individual wells of a new 96 well plate. Plates were examined every 2–3 days, the number of wells containing living cells was recorded and cells were passaged as described above.
For LOH analysis DNA was isolated from wells of day 10 neurosphere cultures containing a single neurosphere (Bailey et al., 2004). Sufficient DNA was recovered to permit ~20 PCR analyses. LOH was measured by PCR using informative Mit markers (see supplementary information).
Immuno-blotting
MEFs were treated with 1μM camptothecin, 200μM HU, or 1 Gy γ-irradiation as indicated in the text, lysed in cold RIPA Buffer containing protease inhibitors (Sigma Cat# S8820) and phosphatase inhibitors (Sigma Cat#’s P5726 and P2850) and protein concentrations were determined. Immunoblots were performed using the following primary antibodies: anti-Mcm2 (BM28, BD Biosciences, Cat# 610701), anti-p21Cip1/Waf1 (Santa Cruz, Cat# sc6426), anti-γH2AX-ser139 (Upstate, Cat# 05-636), anti-pATM-ser1981 (Cell Signaling, Cat# 21526), anti-p53 (Santa Cruz, Cat# sc6243), anti-p-p53-ser15 (Cell Signaling, Cat#9284S), anti-p-chk1-ser345, (Cell Signaling, Cat#2341S), anti-RPA32/RPA2 (Abcam, Cat#ab2626) and anti-actin (Sigma Cat#A2066). Secondary antibodies used were the following: goat anti-rabbit IgG (H+L) HRP (Millipore, Cat# AP132P) and anti-mouse IgG (H+L) HRP (Bio-Rad, Cat# 170-6516). Detection by chemi-luminescence was performed using appropriate primary and secondary antibodies with Super Signal West Pico Chemiluminescent Substrate from Thermo Scientific.
Genetic Crosses and Phenotype Analysis
129Sv:Mcm2wt/IRES-CreERT2 (Pruitt et al., 2007) and BALB/c:p53wt/null mice (a gift of P. Demant) were used to establish the crosses described in the results section.
Supplementary Material
Acknowledgments
BALB/c:p53null/wt mice were a generous gift of Peter Demant. This work was supported by grants from the NIH-NCI, the Ellison Medical Foundation, and NYSTEM to SCP. Cost of animal maintenance and flow cytometry was supported in part by an NCI-CCS grant to RPCI.
Support: NIH-NCI, Ellison Medical Foundation, NYSTEM
Footnotes
Conflict of Interest
S.C.P. is an owner of the Buffalo Molecular Target Laboratories, LLC.
References
- Bailey KJ, Maslov AY, Pruitt SC. Accumulation of mutations and somatic selection in aging neural stem/progenitor cells. Aging Cell. 2004;3(6):391–397. doi: 10.1111/j.1474-9728.2004.00128.x. [DOI] [PubMed] [Google Scholar]
- Blow JJ, Dutta A. Preventing re-replication of chromosomal DNA. Nature reviews. 2005;6(6):476–486. doi: 10.1038/nrm1663. [DOI] [PMC free article] [PubMed] [Google Scholar]
- Cortez D, Glick G, Elledge SJ. Minichromosome maintenance proteins are direct targets of the ATM and ATR checkpoint kinases. Proceedings of the National Academy of Sciences of the United States of America. 2004;101(27):10078–10083. doi: 10.1073/pnas.0403410101. [DOI] [PMC free article] [PubMed] [Google Scholar]
- Forsburg SL. Eukaryotic MCM proteins: beyond replication initiation. Microbiol Mol Biol Rev. 2004;68(1):109–131. doi: 10.1128/MMBR.68.1.109-131.2004. [DOI] [PMC free article] [PubMed] [Google Scholar]
- Ge XQ, Jackson DA, Blow J. Dormant origins licensed by excess Mcm2-7 are required for human cells to survive replicative stress. Genes & Dev. 2007;21:3331–3341. doi: 10.1101/gad.457807. [DOI] [PMC free article] [PubMed] [Google Scholar]
- Heffernan TP, Unsal-Kaçmaz K, Heinloth AN, Simpson DA, Paules RS, Sancar A, Cordeiro-Stone M, Kaufmann WK. Cdc7-Dbf4 and the human S checkpoint response to UVC. J Biol Chem. 2007;282(13):9458–9468. doi: 10.1074/jbc.M611292200. [DOI] [PMC free article] [PubMed] [Google Scholar]
- Hyrien O, Marheineke K, Goldar A. Paradoxes of eukaryotic DNA replication: MCM proteins and the random completion problem. Bioessays. 2003;25(2):116–125. doi: 10.1002/bies.10208. [DOI] [PubMed] [Google Scholar]
- Ibarra A, Schwob E, Méndez J. Excess MCM proteins protect human cells from replicative stress by licensing backup origins of replication. Proc Natl Acad Sci U S A. 2008;105(26):8956–61. doi: 10.1073/pnas.0803978105. [DOI] [PMC free article] [PubMed] [Google Scholar]
- Jackson DA, Pombo A. Replicon clusters are stable units of chromosome structure: evidence that nuclear organization contributes to the efficient activation and propagation of S phase in human cells. J Cell Biol. 1998;140(6):1285–1295. doi: 10.1083/jcb.140.6.1285. [DOI] [PMC free article] [PubMed] [Google Scholar]
- Lei M. The MCM complex: its role in DNA replication and implications for cancer therapy. Curr Cancer Drug Targets. 2005;5(5):365–380. doi: 10.2174/1568009054629654. [DOI] [PubMed] [Google Scholar]
- Liu P, Slater DM, Lenburg M, Nevis K, Cook JG, Vaziri C. Replication licensing promotes cyclin D1 expression and G1 progression in untransformed human cells. Cell Cycle. 2009;8(1):125–36. doi: 10.4161/cc.8.1.7528. [DOI] [PMC free article] [PubMed] [Google Scholar]
- Lombard DB, Chua KF, Mostoslavsky R, Franco S, Gostissa M, Alt FW. DNA repair, genome stability, and aging. Cell. 2005;120(4):497–512. doi: 10.1016/j.cell.2005.01.028. [DOI] [PubMed] [Google Scholar]
- Miao H, Seiler JA, Burhans WC. Regulation of cellular and SV40 virus origins of replication by Chk1-dependent intrinsic and UVC radiation-induced checkpoints. J Biol Chem. 2003;278(6):4295–4304. doi: 10.1074/jbc.M204264200. [DOI] [PubMed] [Google Scholar]
- Martinho RG, Lindsay HD, Flaggs G, DeMaggio AJ, Hoekstra MF, Carr AM, Bentley NJ. Analysis of Rad3 and Chk1 protein kinases defines different checkpoint responses. EMBO J. 1998;17(24):7239–7249. doi: 10.1093/emboj/17.24.7239. [DOI] [PMC free article] [PubMed] [Google Scholar]
- Maslov AY, Bailey KJ, Mielnicki LM, Freeland AL, Sun X, Burhans WC, Pruitt SC. Stem/progenitor cell-specific enhanced green fluorescent protein expression driven by the endogenous Mcm2 promoter. Stem Cells. 2007;25(1):132–8. doi: 10.1634/stemcells.2006-0032. [DOI] [PubMed] [Google Scholar]
- Maslov AY, Barone TA, Plunkett RJ, Pruitt SC. Neural stem cell detection, characterization, and age-related changes in the subventricular zone of mice. J Neurosci. 2004;24(7):1726–33. doi: 10.1523/JNEUROSCI.4608-03.2004. [DOI] [PMC free article] [PubMed] [Google Scholar]
- Nevis KR, Cordeiro-Stone M, Cook JG. Origin licensing and p53 status regulate Cdk2 activity during G(1) Cell Cycle. 2009;8(12):1952–63. doi: 10.4161/cc.8.12.8811. [DOI] [PMC free article] [PubMed] [Google Scholar]
- Pruitt SC, Bailey KJ, Freeland A. Reduced Mcm2 expression results in severe stem/progenitor cell deficiency and cancer. Stem Cells. 2007;25(12):3121–32. doi: 10.1634/stemcells.2007-0483. [DOI] [PubMed] [Google Scholar]
- Rossi DJ, Jamieson CH, Weissman IL. Stems cells and the pathways to aging and cancer. Cell. 2008;132(4):681–96. doi: 10.1016/j.cell.2008.01.036. [DOI] [PubMed] [Google Scholar]
- Shima N, Alcaraz A, Liachko I, Buske TR, Andrews CA, Munroe RJ, Hartford SA, Tye BK, Schimenti JC. A viable allele of Mcm4 causes chromosome instability and mammary adenocarcinomas in mice. Nat Genet. 2007;39(1):93–8. doi: 10.1038/ng1936. [DOI] [PubMed] [Google Scholar]
- Tye BK. MCM proteins in DNA replication. Annual review of biochemistry. 1999;68:649–686. doi: 10.1146/annurev.biochem.68.1.649. [DOI] [PubMed] [Google Scholar]
Associated Data
This section collects any data citations, data availability statements, or supplementary materials included in this article.