

Abstract
We present a detailed investigation of the performance of lens-free holographic microscopy toward high-throughput on-chip blood analysis. Using a spatially incoherent source that is emanating from a large aperture, automated counting of red blood cells with minimal sample preparation steps at densities reaching up to ~0.4 × 10⁶ cells/μL is presented. Using the same lens-free holographic microscopy platform, we also characterize the volume of the red blood cells at the single-cell level through recovery of the optical phase information of each cell. We further demonstrate the measurement of the hemoglobin concentration of whole blood samples as well as automated counting of white blood cells, also yielding spatial resolution at the subcellular level sufficient to differentiate granulocytes, monocytes, and lymphocytes from each other. These results uncover the prospects of lens-free holographic on-chip imaging to provide a useful tool for global health problems, especially by facilitating whole blood analysis in resource-poor environments.
Together with several recent contributions, lens-free imaging1–11 is now becoming more and more important, especially for cytometry and microscopy applications. Among others, one field that would enormously benefit from lens-free on-chip digital imagers is the field of microfluidics.12,13 Over the past decade, microfluidics has revolutionized the available toolset to handle cells by significantly reducing the required device and reagent volumes, as well as the associated costs. Lens-free on-chip imaging could provide further reduction in the size and the cost of these microfluidic systems, while, at the same time, improving the throughput of imaging and/or characterization. To complement these advances in lens-free imaging and microfluidics, recently, we have introduced an on-chip holographic microscopy platform with subcellular resolution over a large field of view (~24 mm2).8–11 In this technique, by controlling the spatial coherence of the illumination source (which can be a simple light-emitting diode), we record the two-dimensional (2D) holographic diffraction signature of each cell or microparticle on an opto-electronic sensor array without the use of any lenses or lasers (see Figure 1). This recorded holographic pattern is then rapidly processed using a custom-developed algorithm9,10 to perform wide field-of-view (FOV) microscopy of semitransparent objects such as blood cells on the chip.
Figure 1.
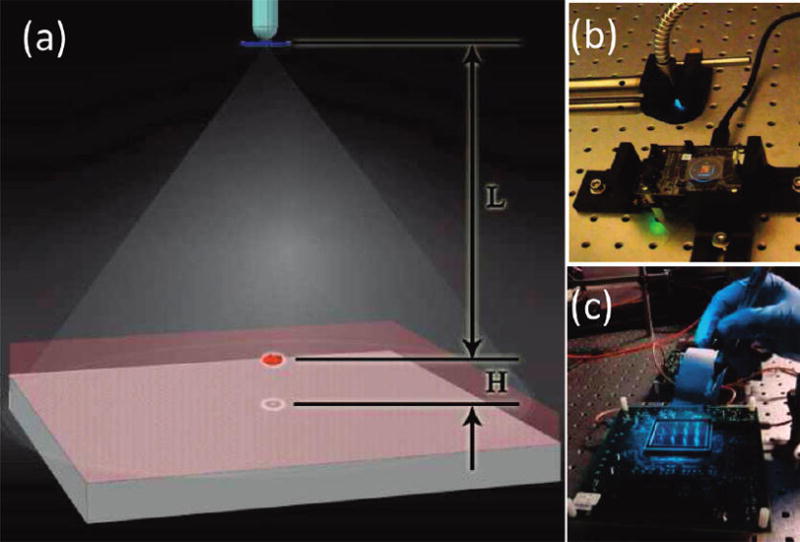
(a) Schematic diagram of the lensless holographic imaging platform is shown. (b) The corresponding experimental setup, which uses a xenon lamp coupled to a monochromator for tuning of the illumination wavelength, is illustrated. The source is filtered by an aperture size of D ≈ 50–100 μm before illuminating the cells. The FOV of the CMOS sensor in panel (b) is ~24 mm2, as further illustrated in Figure 1 in the Supporting Information. (c) A holographic imaging platform that has a significantly larger FOV (~18 cm2) is shown (see Figure 9 for further information). L and H denote the aperture-to-cell-plane distance and the cell-plane-to-detector-plane distance, respectively. Typically, L = 2–20 cm, and H < ~ 1–2 mm.
Providing a spatial resolution of ~1.4–1.5 μm,9,11 which is comparable to a 10× objective-lens with a numerical aperture of ~0.1–0.2 at ~500–600 nm, but with an order-of-magnitude-larger FOV (e.g., 24 mm2 vs ~2 mm2), our lens-free microscopy platform is capable of imaging a large number of cells simultaneously. As a result, this system meets the requirements and needs of whole blood analysis applications, which inevitably necessitate high-throughput imaging and characterization. Toward this end, here, we present a detailed investigation of the performance of this on-chip imaging modality for high-throughput whole blood analysis. In specific, we demonstrate automated counting of red blood cells (RBCs) at densities reaching up to ~0.4 × 10⁶ cells/μL. Using the same lens-free holographic microscopy platform, we also characterize the volume of the red blood cells at the single cell level through recovery of the optical phase information of each cell. Furthermore, we demonstrate the performance of this lens-free technique for the imaging and automated counting of white blood cells (WBCs) with minimal sample preparation steps, also yielding spatial resolution at the subcellular level sufficient to differentiate granulocytes, monocytes, and lymphocytes from each other. This is a major step forward to enable three-part differential WBC imaging using lens-less on-chip microscopy. Finally, to show the versatility of this platform for whole blood analysis, we also illustrate hemoglobin concentration measurements, which is one of the critical elements in clinical diagnostics with minimal modification of the lens-free on-chip imaging setup.
The compact and mechanically robust architecture of this lens-free microscopy and cytometry platform, together with its ease of use, may offer a highly sensitive and lower-cost alternative to existing whole blood analysis tools, especially for point-of-care diagnostics in resource-limited settings.
RESULTS AND DISCUSSION
We initially tested the effectiveness of the presented cytometry approach by imaging various cells and microparticles on a chip. Figures 1–3 in the Supporting Information illustrate the holographic imaging results of a heterogeneous solution that contains RBCs, yeast cells (S. pombe), and 3-μm-, 5-μm-, and 10-μm-sized particles all imaged using the lens-free holographic imaging setup of Figure 1b. For these images, we utilized L = 10 cm, H = 0.7 mm, an aperture size of D = 50 μm, and a spatially incoherent source (from a xenon-lamp-based monochromator) at 550 nm with a full width at half maximum (fwhm) spectral bandwidth of ~15 nm (see Figure 1). As illustrated in these figures, the raw holographic signatures of cells and particles exhibit unique oscillations that are characteristic of each cell/particle type, based on its size, shape, subcellular elements, and refractive index. As we have already demonstrated in an earlier study,8 using this two-dimensional (2D) amplitude hologram, it is feasible to distinguish different cells from each other using pattern analysis techniques (see, e.g., Figure 3 in the Supporting Information). More importantly, the amplitudes of these cell holograms also permit digital reconstruction of microscopic images of the cells, as well as their phase signatures, complementing the cytometric information that is embedded in the cell hologram texture. (See Figures 1–3 in the Supporting Information and ref 9 for further details.)
To demonstrate and quantify the cytometry performance of our lens-free holographic setup (shown in Figure 1b), we imaged whole blood samples at various dilution levels, spanning <50 000 cells/μL up to ~0.4 × 10⁶ cells/μL. Figures 2 and 3, as well as Figure 4 in the Supporting Information, illustrate the lens-free RBC hologram amplitudes, as well as their reconstructed images for various cell density levels, which clearly indicate the strength of the digital holographic reconstruction to handle highly dense cell solutions. Note that the same holographic reconstruction process also permits digital separation of cell holograms from each other. Considering Figure 3a, where all of the lens-free RBC holograms are completely overlapping (because of a high cell density of ~0.4 × 10⁶/μL), using the complementary information of the reconstructed cell images, one can individually separate the 2D holographic signature (both phase and amplitude) of any given cell within the hologram crowd, as also illustrated in Figure 5 in the Supporting Information. This duality between cell hologram texture and the digitally reconstructed cell images is especially useful for characterization of dense cell solutions such as whole blood samples.
Figure 2.
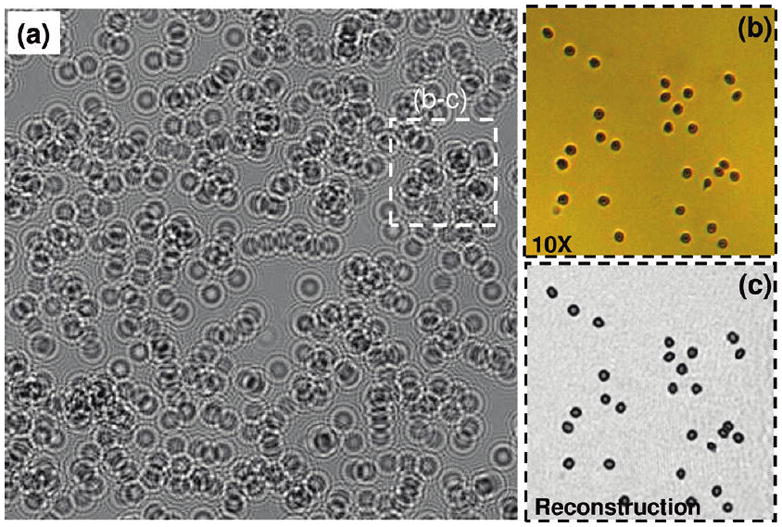
Measured cell hologram amplitudes at an RBC concentration of 102 000 cells/μL, using the setup of Figure 1b; L = 10 cm, H = 0.7 mm, and D = 50 μm. In this case, cell shadow overlap probability on the chip is quite high for the raw holographic image of panel (a). The lens-free holographic image of panel (a) is digitally cropped from a much larger field of view of ~24 mm2. (b) Matching microscope image acquired with a 10× objective lens (NA = 0.2) showing RBCs. (c) For the same FOV of panel (b), digital holographic reconstruction results are illustrated, which match the microscope image very well.
Figure 3.
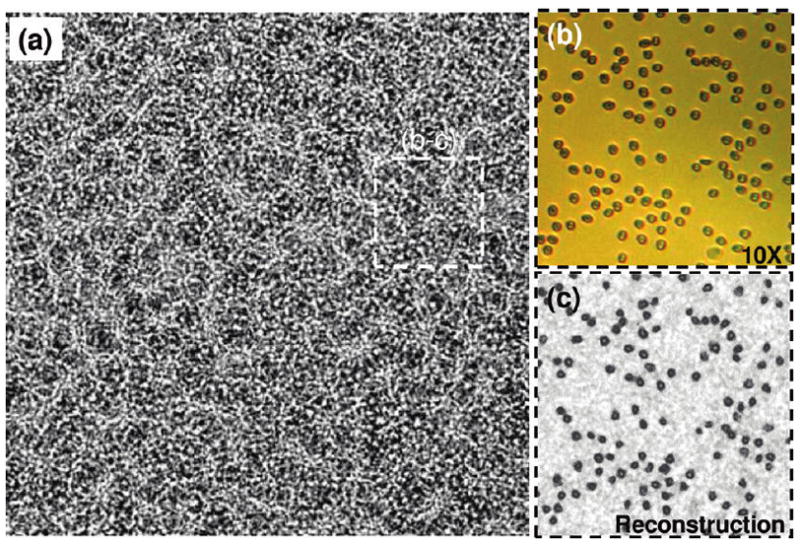
Same as in Figure 2, except for an RBC concentration of ~394 000 cells/μL. At such high cell densities, the individual holographic signatures of the cells (as you would normally find in, e.g., Figure 2) get completely washed out by a noise-like speckle pattern, which fortunately still contains all the phase information of the cells. By digital recovery of this phase information, microscopic image of the cells on the chip can be recovered as illustrated in panel (c).
Next, for each dilution level, we measured the density of RBCs based on automated counting of digitally reconstructed cell images (see the Experimental Methods section for details). The counting results (Figure 4) revealed that the reconstructed cell images yielded an absolute error rate of <5%, up to a cell density of ~0.4 × 10⁶ cells/μL, when compared to counting results of the same FOV obtained using a conventional lens-based microscope. To further validate our holographic characterization results, the inset in Figure 4 also illustrates a comparison of RBC volume histogram that is estimated based on the same digital reconstructions against a commercially available Coulter Counter, which showed a good fit to our results. In these cell volume calculations, we assumed that RBCs are phase-only objects with an average refractive index of ~1.4. Under these assumptions, the thickness of each RBC becomes proportional to its recovered and unwrapped optical phase, and the base area of each RBC can be estimated by simple thresholding of the recovered phase images. The cell volume of each RBC was then estimated by the product of its thickness and base area.
Figure 4.
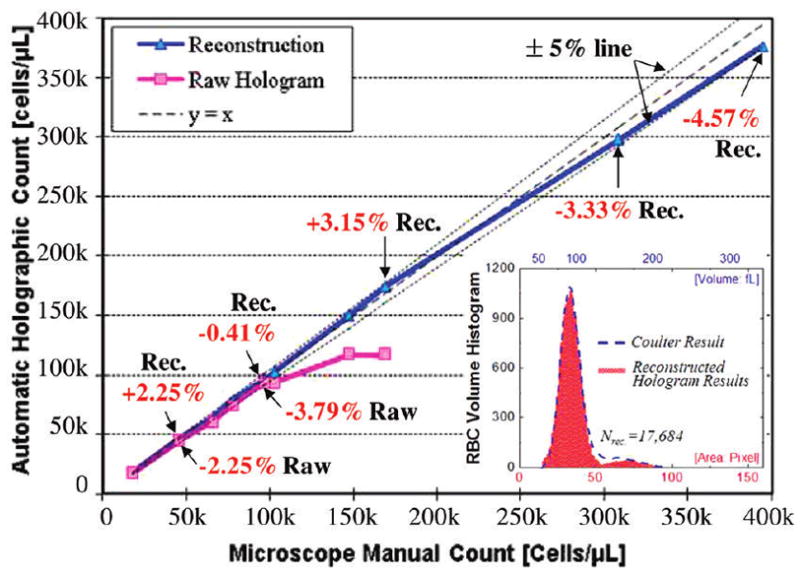
Automated cell counting accuracy of the lens-free imaging technique is illustrated at various RBC densities, ranging from <50 000 cells/μL up to ~0.4 × 10⁶ cells/μL. For each dilution level, at least 500 cells were automatically counted to estimate the cell density in each case. The reconstructed cell images yielded an absolute error rate of <5%, up to a cell density of ~0.4 × 10⁶ cells/μL. The inset also illustrates a comparison of RBC volume histogram that is estimated based on holographic reconstructions against a commercially available hematology analyzer (Model Coulter LH750, Beckman Coulter), which showed a very good fit to our results.
In addition to automated RBC count and cell volume measurements, the hemoglobin concentration (HGB) of blood samples was also measured using our lens-less imaging platform with a simple modification of the experimental setup, as shown in Figure 5. According to the Beer–Lambert model,14 the amount of the photon transmission through a cuvette containing hemolyzed RBCs decreases exponentially with the hemoglobin concentration and the path length of the incident light. Based on this model, using a cuvette thickness of ~8.9 mm and an illumination wavelength of ~420 nm, we measured the HGB concentration of six different patients’ blood samples, using lens-free transmission images. Our results were also compared against a commercially available hematology analyzer (Model Coulter LH750, Beckman Coulter). As described in Figure 5, the average light intensity collected from ~18K pixels of each lens-free image showed a good fit to the Beer–Lambert model,14 yielding a maximum error of ~2.9%, compared to the hematology analyzer (refer to the Experimental Methods section for details).
Figure 5.
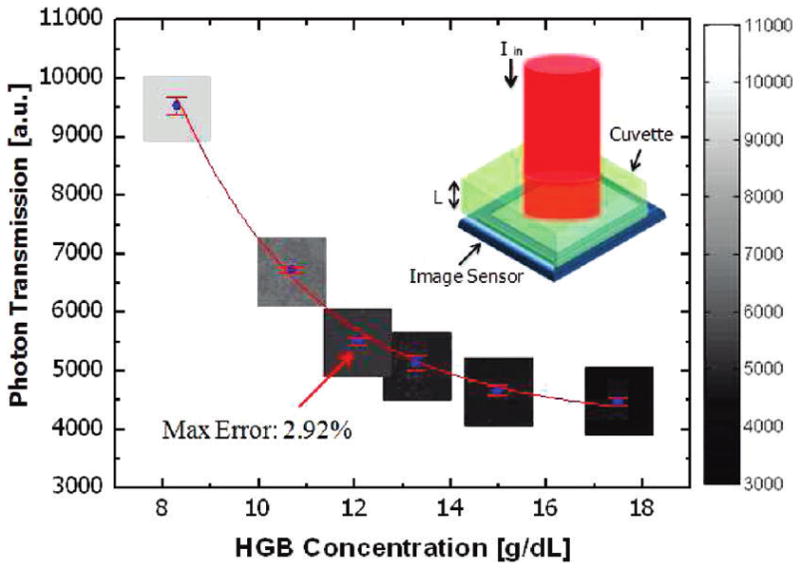
Hemoglobin (HGB) measurement results for six different patients’ whole blood samples, using lens-free on-chip imaging, are compared to the results of a commercially available hematology analyzer (Model Coulter LH750, Beckman Coulter). Average light intensity collected from ~18 000 pixels of each lens-free image showed a good fit to the Beer–Lambert model,14 yielding a maximum error of ~2.9%, compared to the hematology analyzer. The top-right inset illustrates the experimental apparatus, which uses a cuvette (8.9 mm thick) containing hemolyzed RBCs under 420 nm illumination.
Using the same lensless holographic microscopy platform, we also tested the imaging of WBCs in diluted whole blood samples. For this purpose, we used an aqueous staining protocol to label the WBCs (detailed in the Experimental Methods section). Holographic imaging results of such a whole blood solution are illustrated in Figure 6. For comparison purposes, in the same sample solution, we also included nonstained WBCs, as indicated in Figure 6d with an arrow. Notice that the raw holographic signatures of WBCs and their reconstructed phase holograms are uniquely different from other blood cells, as illustrated in Figures 6a and 6b, respectively. Figure 6c illustrates the reconstructed microscopic image of the same field of view, which matches very well with the 40× objective-lens image of the same region, clearly showing the stained and the nonstained WBCs.
Figure 6.
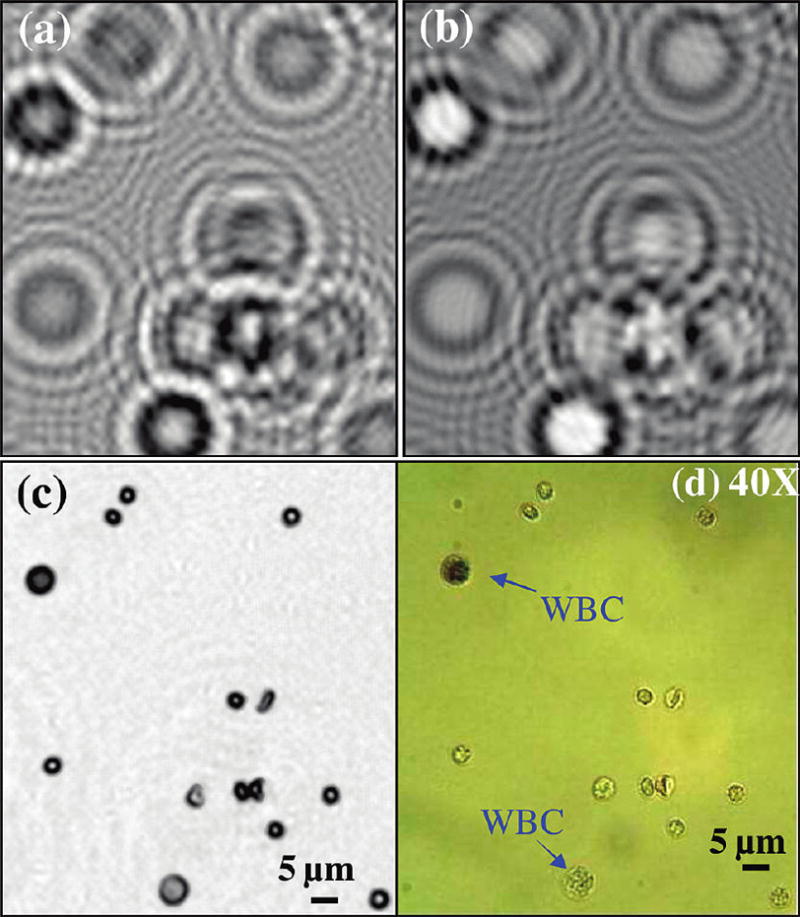
Holographic imaging results of WBCs within a diluted whole blood sample are illustrated. The sample contained stained WBCs (see the Experimental Methods section) and, for comparison purposes, in the same solution, we also included nonstained WBCs, as indicated in (d) with an arrow. (a) Raw holographic image. (b) The recovered phase of the lens-less hologram for the same FOV as in panel (a). Notice that the amplitude and phase holograms of WBCs are uniquely different from the rest of the blood cells. (c) Reconstructed holographic image of the cells; (d) A 40× objective-lens (NA=0.6) image of the same FOV is shown for comparison.
Next, using our holographic imaging platform, we automatically counted the number of WBCs from a patient’s blood sample that is already characterized by a Coulter Counter. For this experiment, we diluted the whole blood sample by factors of 8, 12, and 16 to create three different batches from the same source. For each one of these batches, we took 24 samples (a total of 72 samples) and imaged them for automated counting of the WBCs using the setup of Figure 1b. The counting results are summarized in Figure 7, as a function of the whole blood dilution factor. For 8× and 12× dilution levels, we have counted, on average, ~119 and ~78 WBCs per each holographic image, whereas for the 16× dilution level, this number dropped to a mean count of ~52 WBCs per image. The standard deviations of the WBC counts per image for these three dilution factors were 16.55, 17.70, and 8.42, respectively. Based on our counts, for dilution factors of 8, 12, and 16, we estimated the original WBC density of the patient to be 4875, 4805, and 4251 WBCs/μL, respectively. These results agree well with the Coulter Counter result, which showed a density of 4700 WBCs/μL for the same patient. Except for the 16× dilution level, our results indicate a mean error of <3.72% for the WBC count, and for the 16× dilution level, our error increased to <10%.
Figure 7.
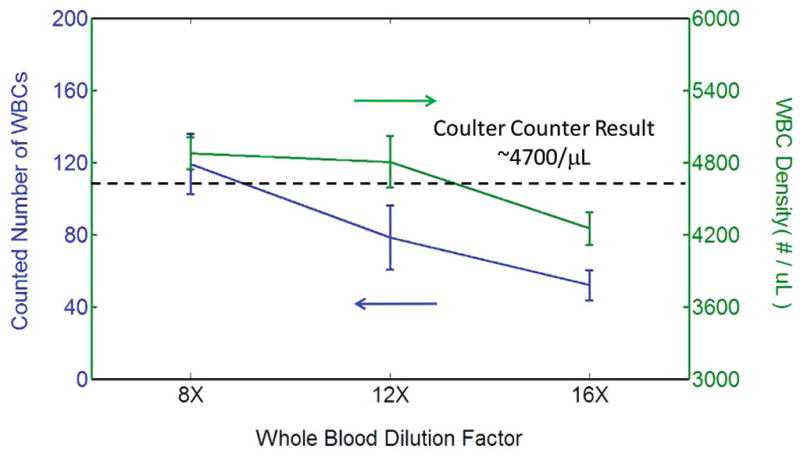
Automated WBC count results are demonstrated using the lens-free holographic imaging platform shown in Figure 1b, as a function of the whole blood dilution factor (8×, 12×, and 16×). For each dilution level, 24 samples were imaged (i.e., a total of 72 measurements were made). For 8× and 12× dilution levels, we have counted, on average, ~119 and ~78 WBCs per each holographic image, whereas for the 16× dilution level, this number decreased to a mean count of ~52 WBCs per image. The standard deviations of the WBC counts per image for these three dilution factors were 16.55, 17.70, and 8.42, respectively. Based on our counts, for dilution factors of 8, 12, and 16, we estimated the original WBC density of the patient’s whole blood to be 4875, 4805, and 4251 WBCs/μL, respectively. These results agree very well with the Coulter Counter result, which reported a density of 4700 WBCs/μL for the same patient.
The above illustrated results (Figures 2–4) and Figures 6–8 were all imaged while the cells were floating within a solution. We also tested the performance of the presented on-chip cytometry scheme on blood smear samples that are prepared in accordance with conventional staining protocols (see the Experimental Methods section). Figure 8, and Figure 6 in the Supporting Information, illustrate the holographic imaging results of these blood smear samples, focusing specifically on the holographic signatures (both amplitude and phase) and the reconstructed microscopic images of various blood cells such as granulocytes, lymphocytes, monocytes, platelets, and RBCs. These results, and their comparison to 40× objective-lens microscope images (NA = 0.6), indicate that the reconstructed holographic images can be used to discriminate subcellular differences among three major types of white blood cells (i.e., granulocytes, lymphocytes, and monocytes), and have the potential to provide three-part differential WBC analysis within the same lens-free digital platform. Note also that some of the platelets in these images are located at a different depth of field than the WBC, which is why they do not appear in some of the reconstructed images. Figure 7 in the Supporting Information illustrates this fact by digitally zooming to another depth layer to bring the signatures of the platelets back, while defocusing the granulocyte image. This highlights the well-known digital zooming capability of holography, which is another major advantage, when compared to conventional optical microscopes for imaging and characterization of samples in three dimensions.15,16
Figure 8.
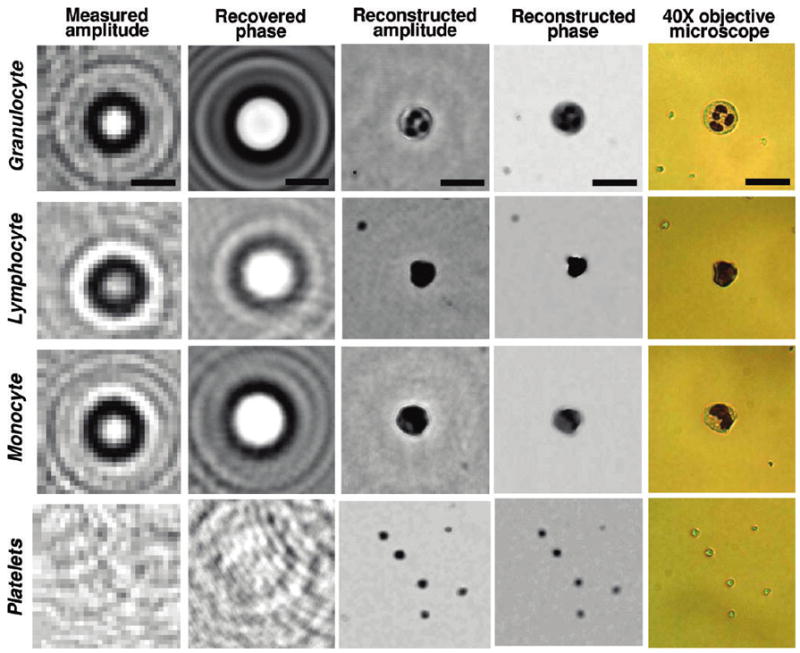
Holographic imaging results of a blood smear sample, illustrating the lens-free shadow signatures of three major types of WBCs (i.e., granulocytes, lymphocytes, and monocytes) and platelets. Different than Figure 6, these stained cells are imaged in a dry smear condition. Through iterative holographic processing, the lost phase information of each cell hologram is recovered (second column), which then leads to reconstruction of amplitude and phase images of the cells (third and fourth columns on the right). The same field of view in each case is also imaged using a 40× objective lens (NA = 0.6) for comparison purposes (fifth column on the right). Scale bars = 20 μm.
All the cell holograms that are discussed so far illustrate the complementary nature of the hologram texture to the reconstructed microscopic images, both for phase and amplitude domains. The textural signature of each cell hologram, before a holographic reconstruction is performed, can reveal important variations among different cell types such as a granulocyte versus lymphocyte (see, e.g., Figure 8). This is also an important source of digital information that may potentially permit diagnosis of an infectious disease (such as malaria), based on, e.g., inspection of the infected RBC hologram textures and detection of textural asymmetries against a library of healthy blood cells. In addition, this pattern analysis approach (further discussed in the Experimental Methods section) may simplify the computational complexity to significantly improve the speed of diagnosis. However, such a pattern-matching approach would also suffer from spatial overlapping among cell holograms and, therefore, could significantly benefit from holographic reconstruction9 (see e.g., Figures 2–4) to better handle highly dense cell solutions such as whole blood samples.
The total field-of-view in these earlier images is ~24 mm2, which is ~10 fold larger than the imaging field-of-view of a typical 10× objective lens (see Figure 1 in the Supporting Information). A much larger FOV can also be obtained using other types of sensor arrays. For instance, the results in Figure 9 illustrate an imaging FOV of ~18 cm2, which offers a >500-fold larger FOV, when compared to an optical microscope (e.g., 10× objective lens). This figure is obtained using the setup of Figure 1c under ~600 nm illumination. Figures 9c and 9d also illustrate the recovered phase holograms and the corresponding reconstruction images of RBCs for a zoomed region of interest over this 18 cm2 FOV. Note that, in this case, the success of the phase recovery step is quite evident in the comparison of Figures 9b and 9c. The tradeoff to achieve a larger FOV is a reduction in spatial resolution that is primarily affected by the large pixel size at the sensor array,9,11 which, in this case, is 6.8 μm for the sensor-array utilized in Figure 9.
Figure 9.

Ultrawide FOV imaging of RBCs (over 18 cm2) using the holographic imaging platform of Figure 1c is illustrated. This constitutes a >500-fold larger FOV, when compared to an optical microscope using a 10× objective lens. Panel (b) illustrates a digitally cropped region of interest taken from panel (a). Panels (c) and (d) illustrate the recovered hologram phase and the reconstructed image of the cells, respectively. A 10× microscope image of the same FOV is also shown in panel (e) for comparison.
EXPERIMENTAL METHODS
Pattern Matching to Cell Holograms: Recognizing Cell Signatures from Their Holographic (Phase and Amplitude) Fingerprints
The measured cell hologram amplitude and the recovered hologram phase constitute 2D fingerprint signatures that are unique to each cell type under the same illumination conditions. Therefore, in the interest of properly discriminating different cell types present in a heterogeneous sample, pattern analysis is performed in a variety of image domains, including the reconstructed microscopic image, measured hologram amplitude image, and the reconstructed hologram phase image (see Figure 3 in the Supporting Information). In this process, first, the generic locations of undetermined cell types are identified in the reconstructed microscopic image, which provides better thresholding performance, since each cell’s energy is focused to a smaller region of interest. Using this location information, each unknown particle’s pixel area, circularity index, and signal-to-noise ratio (SNR) are determined for both the reconstructed microscopic image and the cell hologram images. This information provides a statistical prescreening tool for narrowing of cell types of interest within the imaging FOV. Following this step, a basic pattern matching algorithm is performed on each particle of interest that passed this prescreening step by computing the mean-square-error (MSE) between its (phase and/or amplitude) hologram texture and a well-defined template/library hologram image for each cell type of interest imaged under the same known conditions. A lower MSE indicates a higher match probability for that given cell type. Consequently, by computing the minimum mean-square-error (MMSE) between the holographic signatures of each cell to the predefined library templates for different cell types of interest, we maximize the probability of making a correct identification for each cell present within the field-of-view. In the final step, as illustrated in Figure 3 in the Supporting Information, a characterization decision for each particle of interest is made based upon a variety of parameters including the MMSE, as well as the previously determined area, circularity, and SNR values taken from both the reconstructed microscopic image and the (amplitude and/or phase) 2D hologram textures.
Digital Reconstruction and Phase Recovery from Holographic Images
For digital reconstruction of the object images from their lens-free holograms, there are two numerical approaches9–11 that we took: Method 1, which involves back-propagation of the Fourier components of the intensity of each cell hologram; and Method 2, recovery of the 2D phase of the amplitude of each hologram. These two techniques independently enabled twin-image free reconstruction of the micro-objects from their raw holograms, as already illustrated in the previous section. These digital reconstruction approaches can actually be considered to be part of a broader umbrella of interferometric and noninterferometric phase-retrieval techniques.17,18 In both of these methods, the transfer function of the Rayleigh–Sommerfeld integral19 without any approximations has been used to back-propagate the fields. Specifically, we used the following complex transfer function to propagate the fields back and forth between the detector and the object planes:
where z is the forward propagation distance; λ is the illumination wavelength; fx and fy are the spatial frequencies along the x- and y-directions, respectively; and n is the refractive index of the propagation medium.19 Further details of these two holographic image reconstruction methods can be found in refs 9–11. For blood cells, both of these reconstruction approaches yield very similar recovery results (see Figure 6 in the Supporting Information) within less than ~15–20 iterations. However, for larger-scale cells or multicellular organisms, the 2D phase recovery approach discussed above has certain advantages. For a large organism, the scattered light fields cannot always effectively interfere with the background light, such that the holographic diffraction terms start to lose their relative strengths. However, the phase recovery approach treats the detected quantity as the amplitude of a complex diffraction field and tries to iteratively recover its phase for digital reconstruction. Therefore, the phase-recovery-based reconstruction approach is especially useful for lens-free imaging of highly scattering cells or larger-scale organisms where the cross-interference terms start to dominate over holographic diffraction. As a trade-off, the space-bandwidth product that is required at the detector end is increased by 2-fold for the phase recovery technique, when compared to the first approach, since the latter one invovles not only the holographic diffraction term, but also self-interference terms.
The microscopic reconstruction results presented in this manuscript utilize successive fast Fourier transform (FFT) operations, where, after the initial FFT of each iteration, the transfer function of the Rayleigh–Sommerfeld integral without any approximations has been applied to the Fourier components of the cell hologram. Because FFT is used, the presented recoveries are also quite fast, in terms of digital computation time, with a convergence time of less than a few seconds, using, for example, a 1.6 GHz CPU with a Pentium processor. We also achieved a >40× improvement in our computation time using a graphics processing unit (GPU) (CUDA-enabled NVIDIA GeForce GTX 285), which achieved an image reconstruction time of <1 s, up to an image size of ~20 megapixels.
Holographic Imaging Setup for Whole Blood Analysis
All the holographic imaging experiments, except those reported in Figure 9, were performed with a complementary metal-oxide-semiconductor (CMOS) (Model MT9P031, Micron) image sensor (see Figure 1b). The ultralarge field-of-view in Figure 9 was achieved using a charge-coupled device (CCD) (Model KAF-39000, Kodak; see Figure 1c). Pixel size for the CMOS and CCD was 2.2 and 6.8 μm, respectively, with an active imaging area of 24.4 mm2 and 18 cm2, respectively. As for the source, to be able to test different colors of illumination, we utilized a monochromator with a xenon lamp (Model Cornerstone T260, Newport Corp.). The spectral bandwidth (fwhm) of the illumination, as well as the center wavelength, was controlled to be ~10–20 nm and ~400–600 nm, respectively. A circular pinhole of 50–100 μm diameter, located 2–20 cm above the sensor surface was used to filter the incoherent illumination before shining it on the sample of interest, as illustrated in the Figure 1. The distance between the incoherent source and the pinhole was kept to be minimum through simple butt-coupling of the source to the pinhole.
Sample Preparation Steps
Blood Smear Preparation and Staining
For blood smear imaging experiments, whole blood samples were treated with 2.0 mg EDTA/mL, and 1 μL of sample was dropped on the top of a type 0 glass coverslip and another type 0 coverslip was used for spreading and smearing the blood droplet over the entire coverslip with a smearing angle of ~30°. The smeared specimen was air-dried for 5 min before being fixed and stained, using a HEMA 3 Wright-Giemsa staining kit (Fisher Diagnostics). Dipping dried samples into three Coplin jars that contained methanol-based HEMA 3 fixative solution, eosinophilic staining solution (HEMA 3 solution I), and basophilic solution (HEMA 3 solution II), respectively, was performed five times in a row for a duration of 1 s for each step. The specimen then was rinsed with deionized water and air-dried again before being imaged by our lens-free holographic microscope. After holographic on-chip imaging, each sample was also imaged using a conventional lens-based microscope, to provide a comparison.
Hemoglobin Concentration Measurements
For hemoglobin concentration measurements, we first hemolyzed 40 μL of whole blood with 4 mL of 2% acetic acid (Fisher Scientific) for 3 min. After 1 min of gentle agitation, an optically transparent cuvette (~8.9 mm thick) was filled with 4 mL of this hemolyzed blood solution. To minimize imaging artifacts, the physical area of the cuvette was chosen to be much larger than the active area of the image sensor. Monochromatic illumination at a wavelength of 420 nm was incident on the cuvette, while the CMOS sensor automatically averaged 100 frames with a frame rate of >5 fps. To quantify the intensity of the transmitted light, within the averaged lens-free transmission image, we randomly chose 20 different regions of interest (ROI), which had 30 × 30 pixels each, such that a total of ~18 000 pixels were used for each hemoglobin concentration measurement.
Whole Blood Dilution and Aqueous Imaging
We used RPMI 1640 classic liquid media with L-glutamine (Fisher Scientific) as a diluent to achieve various desired dilution factors. To achieve accurate dilution, we followed the international standard established by the International Council for Standardization in Hematology (ICSH).20 For the aqueous cell staining reagent, we used a mixture of 0.1% buffered eosin Y solution and diluted new Methylene Blue (NMB) solution with a volume ratio of 2:1. To make the 0.1% buffered eosin Y solution, we dissolved 0.1 g of powder-type pure eosin Y (molecular weight of MW = 691.85, Acros Organics) in 100 mL of distilled water at 70 °C on a hot plate with gentle agitation. Diluted NMB was prepared by dissolving 1.0 g of zinc-free pure NMB dye (MW = 347.90, Acros Organics) and 3.2 g of potassium oxalate monohydrate (99.0%, Reagent ACS, Acros Organics) in 200 mL of distilled water. After dissolving all ingredients, each solution was purified using 0.45-μm pore size syringeless filters (Whatman). The aqueous cell staining reagent then was mixed with whole blood samples at a volume ratio of 1:1 and blood cells were stained for an incubation time of 5 min. Finally, stained blood cells were further diluted with RPMI 1640 to achieve desired dilution factors.
CONCLUSIONS
In this manuscript, we have presented a detailed investigation of the performance of lens-free holographic microscopy toward high-throughput on-chip blood analysis. Specifically, we have demonstrated automated counting of red blood cells with minimal sample preparation steps for densities reaching up to ~0.4 × 10⁶ cells/μL. This lens-free measurement also permitted characterization of the red blood cell volumes at the single cell level through recovery of the optical phase information of each cell. Furthermore, we have also demonstrated on-chip characterization of whole blood samples toward hemoglobin concentration measurements, as well as accurate counting of white blood cells, also yielding spatial resolution at the subcellular level sufficient to differentiate granulocytes, monocytes, and lymphocytes from each other. These results uncover the prospects of this lens-free imaging system to provide a useful tool for global health problems, especially by facilitating whole blood analysis in resource-poor environments.
Supplementary Material
Acknowledgments
A.O. gratefully acknowledges the support of the Office of Naval Research (ONR) (under the Young Investigator Award 2009). The authors also acknowledge the support of the Okawa Foundation, Vodafone Americas Foundation, DARPA DSO (under 56556-MS-DRP), NSF BISH program (under Award Nos. 0754880 and 0930501), NIH (under 1R21EB009222-01 and the NIH Director’s New Innovator Award, Award No. DP2OD006427 from the Office of The Director, National Institutes of Health), AFOSR (under Project No. 08NE255).
Footnotes
SUPPORTING INFORMATION AVAILABLE
Supplementary figures as noted in text. (PDF) This material is available free of charge via the Internet at http://pubs.acs.org.
References
- 1.Haddad WS, Cullen D, Solem JC, Longworth JW, McPherson A, Boyer K, Rhodes CK. Appl Opt. 1992;31:4973–4978. doi: 10.1364/AO.31.004973. [DOI] [PubMed] [Google Scholar]
- 2.Xu W, Jericho MH, Meinertzhagen IA, Kreuzer HJ. Proc Natl Acad Sci, USA. 2001;98:11301–11305. doi: 10.1073/pnas.191361398. [DOI] [PMC free article] [PubMed] [Google Scholar]
- 3.Pedrini G, Tiziani HJ. Appl Opt. 2002;41:4489–4496. doi: 10.1364/ao.41.004489. [DOI] [PubMed] [Google Scholar]
- 4.Repetto L, Piano E, Pontiggia C. Opt Lett. 2004;29:1132–1134. doi: 10.1364/ol.29.001132. [DOI] [PubMed] [Google Scholar]
- 5.Garcia-Sucerquia J, Xu W, Jericho MH, Kreuzer HJ. Opt Lett. 2006;31:1211–1213. doi: 10.1364/ol.31.001211. [DOI] [PubMed] [Google Scholar]
- 6.Heng X, Erickson D, Baugh LR, Yaqoob Z, Sternberg PW, Psaltis D, Yang C. Lab Chip. 2006;6:1274–1276. doi: 10.1039/b604676b. [DOI] [PubMed] [Google Scholar]
- 7.Cui X, Lee LM, Heng X, Zhong W, Sternberg PW, Psaltis D, Yang C. Proc Natl Acad Sci, USA. 2008;105:10670–10675. doi: 10.1073/pnas.0804612105. [DOI] [PMC free article] [PubMed] [Google Scholar]
- 8.Seo S, Su T, Tseng DK, Erlinger A, Ozcan A. Lab Chip. 2009;9:777–787. doi: 10.1039/b813943a. [DOI] [PMC free article] [PubMed] [Google Scholar]
- 9.Mudanyali O, Tseng D, Oh C, Isikman SO, Sencan I, Bishara W, Oztoprak C, Seo S, Khademhosseini B, Ozcan A. Lab Chip. 2010 doi: 10.1039/C000453G. [DOI] [PMC free article] [PubMed] [Google Scholar]
- 10.Isikman SO, Sencan I, Mudanyali O, Bishara W, Oztoprak C, Ozcan A. Lab Chip. 2010;10:1109–1112. doi: 10.1039/c001200a. [DOI] [PMC free article] [PubMed] [Google Scholar]
- 11.Oh C, Isikman SO, Khademhosseinieh B, Ozcan A. Opt Express. 2010;18(5):4717–4726. doi: 10.1364/OE.18.004717. [DOI] [PMC free article] [PubMed] [Google Scholar]
- 12.Squires TM, Quake SR. Rev Mod Phys. 2005;77:977–1026. [Google Scholar]
- 13.Whitesides GM. Nature. 2006;442:368–373. doi: 10.1038/nature05058. [DOI] [PubMed] [Google Scholar]
- 14.Ingle JDJ, Crouch SR. Spectrochemical Analysis. Prentice Hall; Englewood Cliffs, NJ: 1988. [Google Scholar]
- 15.Javidi B, Moon I, Yeom SK, Carapezza E. Opt Express. 2005;13:4492–4506. doi: 10.1364/opex.13.004492. [DOI] [PubMed] [Google Scholar]
- 16.Moon I, Javidi B. J Biomed Opt. 2006;11:064004. doi: 10.1117/1.2397576. [DOI] [PubMed] [Google Scholar]
- 17.Situ G, Sheridan JT. Opt Lett. 2007;32:3492–3494. doi: 10.1364/ol.32.003492. [DOI] [PubMed] [Google Scholar]
- 18.Sherman GC. J Opt Soc Am. 1967;57:546–547. doi: 10.1364/josa.57.000546. [DOI] [PubMed] [Google Scholar]
- 19.Goodman JW. Introduction to Fourier Optics. Roberts & Company Publishers; Greenwood Village, CO: 2005. [Google Scholar]
- 20.England JM. Clin Lab Haematol. 1994;16:131–138. [Google Scholar]
Associated Data
This section collects any data citations, data availability statements, or supplementary materials included in this article.