

Abstract
Neurobiological studies using primary neuronal cultures commonly employ fetal-derived neurons, but much less often adult brain-derived neurons. Our goal is to perform morphological and molecular characterization of primary neuronal cultures from adult rat brain, including the relative expression of neuronal and glial cell markers at different time points. We tested the hypothesis that long-term neuronal viability is compatible with glial proliferation in adult neuron culture. We examined neuron culture from adult rat brain, which was maintained at steady state up to 24 days, and characterized them on the basis of cellular, molecular and biochemical properties at different time points of the culture. We identified neuronal and glial cells by both immunocytochemical and western immunoblotting techniques using NSE and Tau as neuronal markers and GFAP as glial protein marker, which revealed the presence of predominantly neuronal cells in the initial phase of the culture and a rise in glial cells from day 12 onwards. Notably, neuronal cells were preserved in the culture along with the glial cells even at day 24. Transfection of the cultured cells with a GFP expression vector and plasmids containing a luciferase reporter gene under control of two different gene promoters demonstrated DNA transfectability. Taken together, these results suggest a differential expression of neuronal and glial cells at different time points and long-term neuronal viability in the presence of glial proliferation. Such adult neurons serve as a suitable system for the application of neurodegenaration models and for drug target discovery in various brain disorders including Alzheimer’s disease.
Keywords: Adult neuron culture, neuron, glia, transfection, amyloid precursor protein
1. Introduction
Current neurobiological and neuropharmacological research depends on the use of well-characterized primary neuron culture models. For this purpose, embryonic rat and mouse neuron cultures are widely used but similar cultures from adult animals are not commonly used, perhaps due to the greater perceived difficulty in obtaining and culturing adult neurons and a lack of methodical molecular characterization. Our goal is to understand the evolution and role of neuronal and glial cells in primary brain cultures from adult rat. Our hypothesis is that long-term viability of cultured neurons is possible in the presence of glial proliferation. Furthermore, studying interactions of neuronal and glial cells and of synapse and synaptic proteins would enable us to decipher their roles in brain disorders, such as Alzheimer’s disease (AD), which is characterized by severe synaptic loss and glial proliferation in key areas of the brain involved in cognition and memory.
In vitro culture of primary neurons has become an important tool in the field of neuroscience research, particularly in the areas of neurotoxicity and neuropharmacology. Further, primary neuron culture has a great utility in validating various drug targets and the discovery of novel pathways for central nervous system (CNS) disorders. Cell culture offers the valuable opportunity to study the action of pharmacological agents on neuronal cells in the absence of many additional complications, e.g., distribution and elimination, present in whole animals. Indeed, absence of proper formation of axons, dendrites and synapses in the continuous cell lines increases the importance of primary cultures (Kaech and Banker, 2006). In this context, embryonic neuron cultures are routinely performed because the methods of extraction of embryonic neurons is relatively simple when compared to adult neurons (Banker and Cowan, 1977). Adult neuron cultures possess some distinct advantages over embryonic neuron cultures for the following reasons. Adult animals are relatively inexpensive and can be obtained within a very short period of time compared to timed-pregnancy animals. Experiments on the neuron culture obtained from one adult animal are more homogenous than an embryonic neuron culture, which is a mixture of brain tissue obtained from several pups. For fetal neuron culture, total yield of neurons depends on the number of fetuses, which is greatly unpredictable. However, there is no adequate report of molecular characteristics of adult neuronal cells. We bridge this gap of knowledge by reporting molecular and immunocytochemical characterization of neuronal cultures prepared from adult rats at different times in vitro.
Herein, we report the preparation of cortical neuron cultures from the adult rat brain and studies of cell viability, morphology and differential expression of neuronal and glial cells in a time dependent manner for up to 24 days. We identified neurons using antibodies raised against two neuron specific proteins, Tau and neuron specific enolase (NSE). Tau protein is a microtubule associated protein found primarily in neuronal tissue (Lee and Rook, 1992) that promotes microtubule assembly in vitro (Olmsted, 1986), and NSE is a dimeric isoenzyme of the glycolytic enzyme enolase-γ found in the cytoplasm of neuronal and neuroendocrine cells (Barone et al., 1993). Similarly, glial cells were identified using an antibody against glial fibrillary acidic protein (GFAP), a filament protein localized predominantly in astroglial cells (Brisby et al., 1999). Under the same conditions we also investigated presynaptic protein syntaxin 6, a protein of the synaptic SNARE complex that plays an important role in synaptic transmission (Brunger, 2005). Syntaxin 6 is a member of the syntaxin family of vesicular transport receptor and shows significant homology to syntaxin 3 and SNAP-25 (Bock et al., 1996). In our study, we have tested the levels of syntaxin 6 in western immunoblotting as synaptic marker. In addition to unraveling protein characteristics, DNA transfectability of the primary culture cells were also assessed by using a lipid based transfection reagent.
Aberrant biochemical and cellular changes in the CNS during aging are believed to result in several neurodegenerative disorders, such as AD, Parkinson’s disease (PD) and amyotrophic lateral sclerosis (ALS). Due to the relative inaccessibility to the brain, studying neuronal function and degeneration requires an appropriate in vitro model system of brain cultures. Ideally, such neuronal culture model would enhance drug target discovery. How neuronal and synaptic markers change overtime in culture was studied in mouse embryonic neuronal culture and was proposed as a model for neuronal development and aging (Lesuisse and Martin, 2002). A similar study can be performed by culturing neurons from animals from adolescence to old age which can eventually become a more realistic model of studying the neurobiology of aging. The aim of our study was to characterize a cortical neuron culture prepared from a young rat brain. Neuronal cultures are one of the important models to perform advance research in different neurodegenerative disorders (Muyllaert et al., 2008; Schonfeld-Dado and Segal, 2009).
Briefly, based on several immunocytochemical and western immunoblotting data, we show that neuronal cells predominate in the initial phase of the culture (day 0-11) and glial cells become prominent beginning at day 12. Neuronal cells were preserved in the culture along with the glial cells even at day 24, which were detectable by neuronal and pre-synaptic protein markers. These results suggest the involvement of neuron-glia interactions for the long-term viability of neurons.
2. Materials & Methods
For the preparation of adult rat cortical neuron culture we followed the previously described method (Brewer and Torricelli, 2007) with some minor modifications as mentioned herein.
2.1. Collection of brain tissue from adult rat
This protocol was approved by Indiana University School of Medicine Institutional Animal Care and Use Committee (IACUC). A sixteen week old female Sprague-Dawley rat was obtained from Harlan (Indianapolis IN, USA). After five minutes of anesthesia in CO2 tank, the head was removed and the brain was dissected out quickly from the skull. We have avoided isoflurane anesthesia because studies have shown that isoflurane can alter electrophysiological properties of the neurons (Ries and Puil, 1999) and induces caspase 3 activation in fetal guinea pig cortical neurons (Rizzi et al., 2008). Whereas, these effects have not been reported with CO2 anesthesia. Both the hemi cortices were separated from the whole brain and kept in a 60 mm tissue culture plate (Corning; New York, NY, USA) on ice containing 2ml dissection medium, which consists of: Hibernate A (Brainbits LLC, Springfield, IL), 1x serum-free B27 supplement (Invitrogen, Carlsbad, CA), and 0.5mM Glutamax (Invitrogen) (Brewer, 1997). Meninges and blood vessels were removed using blunt ended forceps and the hemi cortices were transferred to filter paper soaked with dissection medium. Coronal slices of approximately 0.5 mm thickness were cut by a scalpel. The slices were transferred quickly in a 15 ml polyethylene (PE) tube (Corning Inc, Long Island, NY) containing 5ml of dissection medium.
2.2. Processing of brain tissue
Tissues were transferred into a 15 ml PE tube containing 5 ml Hibernate A without calcium chloride (Brainbits LLC), 0.5 mM Glutamax and 2 mg/ml papain (Worthington Biochemical Corporation, Lakewood, NJ, USA) and the digestion of brain tissue was carried out in an oscillating water bath (30°C, 150 RPM) for 30 minutes. Digested brain tissue was triturated using a siliconized (Sigmacoat, Sigma Aldrich, St. Louis MO, USA), fire polished Pasteur pipette and triturated tissue was subjected to fractionation as described in the following section.
2.3. Fractionation and Isolation of neuronal cultures
The triturated tissue sample was slowly decanted onto a gradient liquid which was made by adding four different concentrations of Optiprep density gradient medium (Sigma) into a 15 ml PE tube. Different Optiprep concentrations were done as described previously (Brewer and Torricelli, 2007). The tube containing the optiprep gradient liquid and the tissue sample was centrifuged at 800 × g for 15 minutes. Four distinct layers were formed in the optiprep liquid after the centrifugation, fraction 1 at the top, fraction 2 and 3 at the middle and fraction four at the bottom. Fractions 2 and 3, which contained a majority of neurons and a few glia, were carefully removed from the gradient fluid and centrifuged at 400 × g for 2 minutes to remove cells from the Optiprep solution. Supernatant was aspirated and the cell pellet was resuspended in growth medium consisting of: Neurobasal A, 1x B27, and 0.5 mM Glutamax (all from Invitrogen).
2.4. Plating of primary neuronal cultures
The growth medium was supplemented with 0.5 ng/ml basic fibroblast growth factor (bFGF, Invitrogen) to enhance cell survival (Ray et al., 1993). After counting cells in hemocytometer by the Trypan Blue exclusion method, cells were plated at 50,000 cells / glass cover slips (12 mm diameter, Assistent, Sondheim, Germany). Cover slips were placed in 60mm cell culture plates (8 cover slips per 60 mm plate) containing 3 ml growth medium with bFGF and 1x Normocin (InvivoGen, San Diego, CA, USA). Culture plates were kept on incubator at 37°C with 5% CO2 and ambient oxygen. Growth of the neuronal cells and morphological development was satisfactory even though the original protocol (Brewer and Torricelli, 2007) suggests nitrogen gas supplement in the incubator. Eight cover slips with the cells were taken out from the 60 mm plate every 4th day (day 4, 8,12,16,20 and 24). Four out of eight cover slips were transferred into a 24-well plate (Corning Inc) and fixed by 4% paraformaldehyde (Electron Microscopy Sciences, Hatfield, PA, USA) for 15 minutes and stored at 4°C in PBS. Cells from the remaining four cover slips were lysed by adding 150 μl Mammalian Protein Extraction Reagent (M-PER, Pierce, Rockfield, IL, USA) and the lysate was quickly transferred to -80°C freezer. Immunucytochemical characterization, Cell Titer-Glo (CTG, Promega, Madison, WI) assay and western blotting experiments of the culture from all time points were performed at the same time as described in the following sections.
2.5. CellTiter-Glo (CTG) Assay
The luminescence based CTG assay was used to determine viable cell population in the culture as per the manufacturer’s protocol (Promega). CTG measures the ATP concentration in the lysed cells (in M-PER buffer) and shows a linear relationship with the cell number and measured luminescence signal (Crouch et al., 1993).
2.6. Preparation of fetal neuron culture from embryonic day 16 rats
To determine any differences in the progression of cell viability between adult and fetal cultures, cortical neurons were also isolated from the fetuses of the dam from which the adult neuronal cultures were prepared. Primary embryonic rat cortical cultures were performed using the procedures previously developed (Brewer, et al., 1993) after some modifications (Bailey and Lahiri, 2006). Collection of cells started at day 4 and continued up to day 20 at 4-day intervals. Cells were removed from the culture plate by scraping with a rubber-tipped spatula in Dulbecco’s phosphate buffered saline (DPBS, Mediatech, Herndon, VA) and aliquots of this cell suspension were subjected to the CTG assay (Promega).
2.7. Immunocytochemistry (ICC) with different neuronal and glial protein markers
Paraformaldehyde fixed cells (on glass cover slips) were washed three times with DPBS and permeabilized with 0.12% Triton X-100 (Sigma) for 10 minutes. The cover slips were again washed with DPBS three times. To reduce non-specific binding of the primary antibody, the cover slips were blocked 15 minutes with 10% normal horse serum (Sigma) in PBS and incubated in a mixture of primary antibodies diluted in 1% horse serum. We used mouse monoclonal anti-Tau (rPeptide, Bogart, GA, USA; 1:1000 dilution) as a neuronal marker and rabbit polyclonal anti-GFAP (Sigma; 1:100 dilution) as a glial marker. After overnight incubation, the cover slips were washed thoroughly with DPBS and incubated in biotinylated horse anti-mouse secondary antibody (Vector laboratories, Burlingame CA, USA) at 1: 250 dilutions for one hour. After washing three times with DPBS, the cover slips were incubated with a mixture of fluorescein (DTAF) conjugated streptavidin (Jackson Immunoresearch Laboratories, PA; USA) at 1: 300 dilutions of and Cy3 conjugated donkey anti rabbit IgG (Jackson Immunoresearch Laboratories, PA; USA) 1:250 dilution for one hour. After rinsing with DPBS, 500μl of fresh DPBS was added to each well of the 24-well plate containing individual cover slips. For nuclear staining, a drop of 4’, 6-diamidino-2-phenylindole (DAPI, Sigma, diluted 1.5μg/ml in water) was added to the PBS of each well and examined under Leica DMIL HC inverted fluorescent microscope (Leica Microsystems GmbH, Wetzler, Germany) using the following sets of filters: for FITC, excitation of 480-520 nm, band pass of 505 nm and emission of 535-585 nm; for Cy3 excitation of 560-615 nm, band pass of 595 nm and emission of 645-720 nm and for DAPI excitation of 350-400 nm, band pass of 400nm and emission of 460-510 nm. Combination of these filters resulted in minimum crosstalk between the signals from individual fluorochromes, so that there was no observable ‘bleed-through’ between any of these three signals. Images were captures with a SPOT RT-SE digital camera (Diagnostic Instruments, Sterling Heights MI, USA) and superimposed using the SPOT Advancee software (Diagnostic Instruments). The cells positive for Tau exhibited green fluorescence, GFAP containing cells exhibited red fluorescence and nuclei stained with DAPI appeared as blue under their respective filter sets.
2.8. Western blotting of cell lysates
Total protein concentration in each cell lysate (CL) was measured using a dye based colorimetric assay (Bradford, 1976) marketed by Bio-Rad(Hercules CA, USA). Equal amounts of protein (6 μg, except day 4 CL samples; see below) from day 4, 8, 12, 16, 20 and 24 (n=4, total 24 lanes) were subjected to SDS-PAGE in a precast 26-lane 12% bis-tris Criterion XT gel (Bio-Rad) at 180 V for 1.2 hours. Since the protein concentration from day 4 CL samples was too low to load 6 μg in an individual well, only 2 μg of day 4 samples were used in western blotting. Protein was transferred from the gel to a PVDF membrane (Bio-Rad) and the membrane was blocked overnight with 5% non-fat dry milk in Tris buffered saline (TBS, Amresco, Solon OH, USA) with 0.5% Tween-20 (TBST, Sigma). After blocking, the membrane was probed for 3 hours at room temperature with anti-NSE antibody (Abcam, Cambridge, MA, USA) diluted 1:1000 in 5% nonfat dry milk in TBST. After washing three times with TBST, the membrane was probed with horseradish peroxidase conjugated goat anti-rabbit secondary antibody (Santa Cruz Biotechnology, Santa Cruz, CA, USA) for one hour at room temperature. After washing the membrane three times with TBST, Amersham western blotting ECL detection reagent (GE Healthcare, Buckinghamshire, UK) was applied and the membrane was exposed to X-ray film (GE Healthcare). Bands were observed around 48 kDa range and the X-ray film was scanned and band density was calculated using the ImageJ software (Abramoff, 2004). Other proteins detected in the CL by western blotting along with their respective antibodies are shown in table1. Details of dilution and their use in western blot were described under the appropriate ‘Materials and Method’ section.
Table 1.
Brief description and source of different antibodies used in ICC and western immunoblotting experiments to analyze samples from adult rat neuronal culture.
| Proteins | Antibodies | Molecular weight of protein | Source |
|---|---|---|---|
| GFAP | Polyclonal anti-GFAP antibody | −48 kDa | Sigma |
| β actin | Monoclonal anti-β actin antibody | −42 kDa | Sigma |
| Syntaxin 6 | Monoclonal anti-syntaxin 6 antibody | −30 kDa | BD Bioscience, San Jose, CA, USA |
| APP | Monoclonal anti-APP antibody (Clone 22C11) | −130 to 110 kDa | Anti-APP (Clone 22C11) Millipore, Billerica, MA, USA |
| APP | Polyclonal anti-APP antibody (OPA 01132) | −130 to 110 kDa | Affinity Bioreagents, Rockford, IL, USA |
2.9. DNA Transfection
A plasmid containing a green fluorescent protein gene under the control of the cytomegalovirus promoter (pmaxGFP, Amaxa, Walkersville, MD, USA) was transfected into the cells at day 12 using lipid-based transfection reagent (Transfectin®, Bio-Rad). Transfection was carried out in a 60 mm plate containing eight cover slips with adult neuronal cells and 4 ml of antibiotic free media. Twenty (20) μl of transfectin was mixed with 480 μl of antibiotic free media (tube 1), and 8 μg of pmaxGFP plasmid was mixed with antibiotic free media to a final volume of 500 μl (tube 2). Contents of tube 1 and tube 2 were mixed together (total volume 1000μl) and kept at room temperature for 30 minutes to allow the formation of DNA-lipid complex. The DNA-lipid complex was added to the 60 mm plate to a final volume of 5 ml. Cells were observed under the microscope using the FITC filter set as described in Material and Methods section 2.7. Transfected cells appeared green and GFP protein expression was detectable starting at approximately after 36 hours of transfection and peaked at approximately 48 hours. Manual counting of the transfected cells and total cells from the phase contrast image from several visual fields was done to quantify transfection efficiency.
2.10. Plasmids
Cells were also transfected with pGL3-Basic (Promega) plasmid DNA as described in the following section. This plasmid contains a firefly luciferase reporter gene under the control of 1.2 kb of the upstream regulatory region of the human APP gene (Lahiri and Robakis, 1991). Another plasmid containing the 551 bp of the upstream regulatory region of the human β-site APP cleaving enzyme 1 (BACE1) gene (Sambamurti et al., 2004) was also used for transfection.
DNA transfections were carried out using the Transfectin® reagent as mentioned above. Forty-eight hours after transfection, cells were harvested using passive lysis buffer (Promega) and subjected to the reporter firefly luciferase gene assay (Promega). Luciferase signals were adjusted for protein concentration using the raw 595 OD value. Human APP and BACE 1 promoter activities are shown in figure 8.
Figure 8. DNA transfection of neuronal cultures and measured by reporter gene assay.
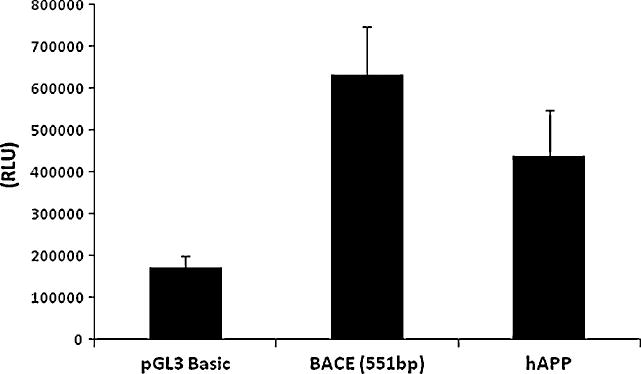
Culture cells were transfected with pGL3, BACE1- (551 bp) and hAPP (1.2 kb of upstream regulatory region) reporter plasmids at day 13. Signals were obtained by Luciferase based assay (normalization was done by raw protein OD-595). Results show that expression of both human BACE1 and human APP transfected promoter constructs are easily detectable.
1. Results
3.1. Yield of viable cells harvested from both hemispheres of the rat cortex
The Trypan Blue exclusion method was employed to count viable cells under phase contrast microscope. After harvesting brain cells as described in ‘Materials and Methods’, we obtained approximately 2 million cells from the combined hemispheres of a 350 gm adult rat at the day of plating the cells.
3.2. Increased viability of adult neuronal culture over a time period
The highly sensitive CTG assay shows a gradual increase in cell viability after day 4 (Figure 1a). This increase in the CTG can be divided into two phases. The first phase is from day 4 to day12 and the second phase is from day 16 to day 24. ICC and western blot data show that the increase in cell viability during the first phase was mainly due to maturation of neurons, which peaks at day 12 and remains in the culture up to day 24. The rise of CTG in the second phase was mainly due to an increase in the number of glial cells. In contrast, cultures from embryonic (E16) rats show maximum cell viability at day four but the viability abruptly dropped as days in culture progressed (Figure 1b).
Figure 1.
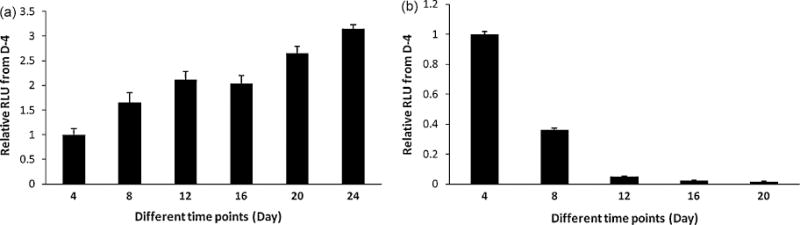
a: Culturing adult rat neurons and checking cell viability at different time points. Rat adult neurons were obtained from the healthy 14 week old female rat. Brain tissue was harvested and processed to make neuronal culture by plating on to glass cover slips (12 mm diameter) as described in ‘Materials and Methods’. Cells were harvested every fourth day and quantitative CTG assay was performed to measure cell viability at different time points. CTG data were plotted as relative percent value of day 4. Since CTG measures ATP concentration in the cell, a significant increase in CTG (relative luminescence units, RLU) value from day 0 and 24 is suggestive of increased metabolic activity, maturation and/or numbers of neuronal and glial cells in the culture. (n=4 for each time point)
b: Viability of rat embryonic neurons at different time points. Embryonic rat neuron culture was prepared from the fetuses of the same adult female rat. Cells were plated onto poly-D-lysine coated 12-well plates, and subsequently the attached cells from four wells were dissociated and harvested every fourth day followed by the CTG assay as described in the text. CTG data were plotted as relative percent value of day 4. Data showed that the embryonic neuronal cells had the maximum viability at day 4 and the viability abruptly decreased within next 8 days. While adult neuron culture was found to be viable even at day 24, the embryonic neuronal cells died by day 20. (n=3 for each time point).
3.3. Morphological evaluation of adult neuronal culture at different time points by phase contrast imaging
Morphology of the cells was observed under the phase contrast microscope (Leica) and recorded every fourth day. Few rounded cell bodies and short projections from a small number of cells were observed in the culture at day 4 (not shown). An increase in cell size was observed at day 8 with the development of distinct long neurite projections. From day 12 onwards, the number of cells in the culture markedly increased, which were found to be predominantly glial cells (Figure 2). In order to examine whether the cells contained intact nuclei, a sensitive DAPI based staining method was used, which showed a gradual increase of intact nuclei suggesting a concomitant increase in cell nuclei with cell viability (Figure 7).
Figure 2. Phase contrast picture of the neuronal culture at different time points.
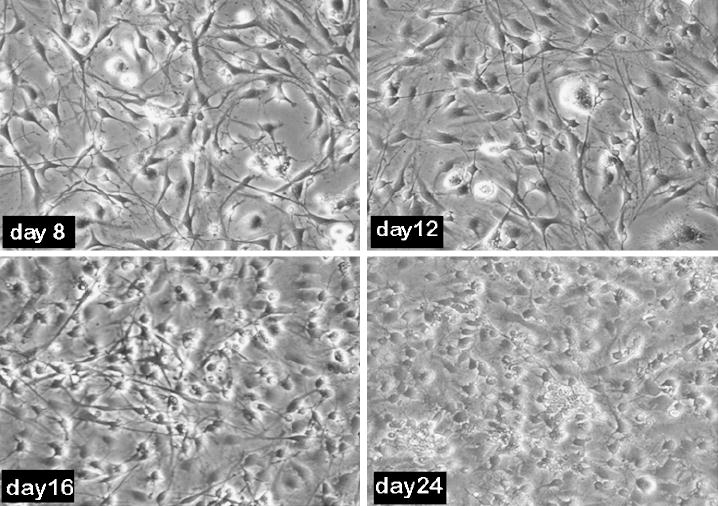
Adult rat brain cells were plated at 50,000 cells/ 100 mm2 and morphological evaluations were performed at different days. Neurons increased in size from day 8 onwards and neurites were quite prominent up to day 12 of the culture. Glial proliferation was visible starting at day 12 and an increase in the cell number was evident at day 24.
Figure 7.

a and b: Characterization of the cultured cells with neuronal and glial proteins by ICC: Cells from different days (Day 4, 8, 12, 16 and 24) were fixed in 4% Paraformaldehyde, ICC analysis was performed using DAPI to stain nucleus (blue), anti-tau antibody to stain neuron specific tau protein (green) and anti- GFAP to stain structural glial/astrocytic protein (red) as described in the text. Merged pictures show relative proportions and localization of neuronal and glial cells within a particular microscopic field. ICC pictures suggest that the culture cells become mature around day 12 (fig 7a) and their numbers (both neurons & glia) stay elevated till 24 days (fig 7b). There is also an increase in the number of DAPI positive nuclei (i.e. cell number) as the culture progresses.
3.4. Determination of neuronal and glial protein markers in adult rat brain neuronal cultures
Levels of neuron-specific protein markers, such as NSE, and glial cell-specific protein markers, such as GFAP, were measured periodically at fixed time intervals (day 4,8,12,16 and 20) using western immunoblotting and the intensity of specific protein bands were densitometrically quantified as described under ‘Material and Methods’. The signal of GFAP protein was found to be low at the early two time points, rapidly increased by several fold at day 12 and stayed high in the remaining days of the culture (Fig. 3). The signal of NSE protein was strong at day 4, probably due to neuronal fragments (e.g., broken neurites and detached synapses) plated on day 0. The signal at day 8 was found to be less than day 4, due likely to washing off the debris and neuronal fragments. At day 12 the signal increased rapidly and stayed elevated in the remaining time points of the culture. The results are very similar when the specific protein bands were analyzed in two different ways: adjusted with an equal amount of protein for each sample/lane or adjusted with the level of β-actin in each sample.
Figure 3. Determination of glial and neuronal markers (GFAP & NSE, respectively) at different time points of the culture by western immunoblotting.
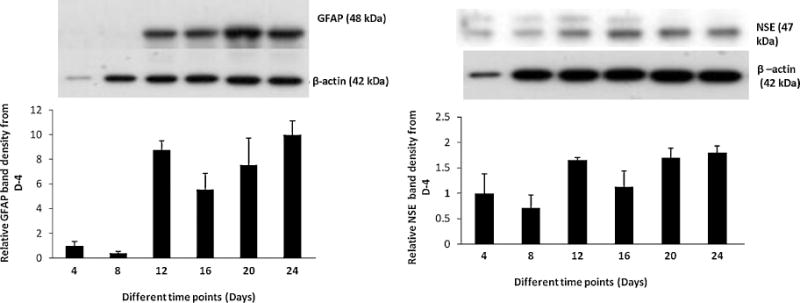
GFAP protein signal was found to be low at the initial two time points and rapidly increased to several folds at day 12 and stayed elevated in the remaining days of the culture. NSE signal was strong at day 4, weak at day 8 and increasing rapidly at day 12. The signal remains elevated in the remaining time points of the culture.
3.5. Differential expression of neuronal and glial cells at different time points of primary cultures
The relative expression of neurons and glia at various times of adult rat brain cultures was determined by measuring levels of neuronal and glial proteins as described above in 3.4. Ratio of levels of NSE to GFAP increased during the first two time points measured, and then the ratio abruptly reduced at later time points as shown in Fig. 4. This is suggestive of differential expression of neuronal and glial markers over time and of an increase in the proportion and maturation of glial cells over neurons from day 8 onwards of cultures.
Figure 4. Relative proportion of neuronal and glial proteins at various times of adult rat brain cultures.
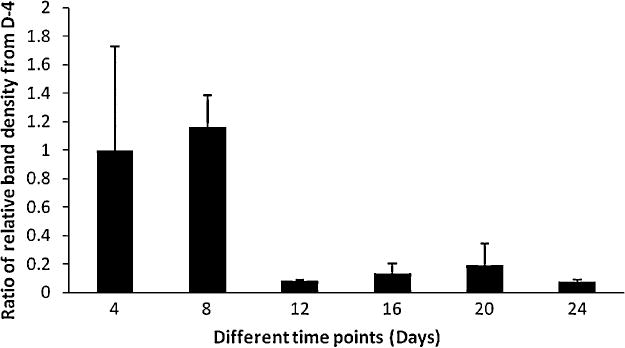
Ratio of levels of NSE to GFAP increased during the first two time points measured and then abruptly reduced at the latter time points, which indicates an increase in the proportion and maturation of glial cells over neurons.
3.6. Detection of syntaxin-6 protein in neuronal cultures at different time points
Levels of the presynaptic protein syntaxin-6 were determined in the cell lysate at the same fixed intervals using the western blotting technique. Densitometric analysis of the specific protein band shows a slight increase of syntaxin-6 levels at day 8 compared to day 4, and then an abrupt increase on day 12. This protein then remained elevated throughout the duration of the culture (Figure 5). Increase of syntaxin-6 level is indicative of synapse formation or maturation of synapses with a maximum peak around day 12.
Figure 5. Detection of syntaxin-6 protein in neuronal cultures at different time points.
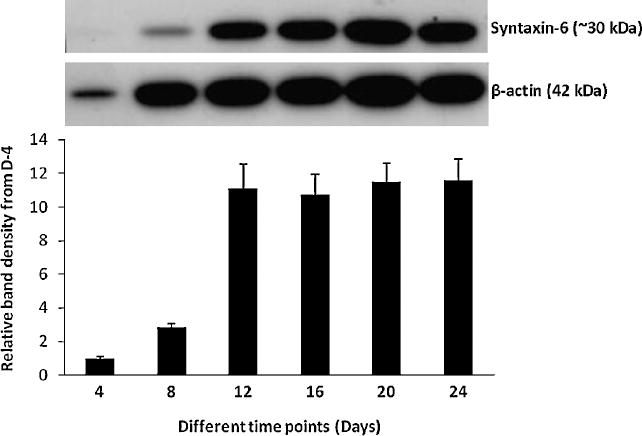
Western blot data shows a gradual increase of syntaxin 6 levels up to day 8 and then an abrupt increase on day 12 which stays elevated throughout the duration of the culture. Increase of syntaxin 6 level suggests synapse formation or maturation of synapses with a peak around day 12.
3.7. Detection of APP protein in neuronal cultures at different time points
Levels of total APP isoforms (as well as their post-translationally modified forms) were detected by the western blotting technique in an equal amount of cell lysate proteins as determined by the Bradford assay. The result is consistent with the other findings, i.e. several fold increase of total APP was observed at day 12 and this increase was maintained thereafter (Figure 6). Two distinct isoforms of APP (the top band at 128 kDa represents the mature/glycosylated and 121 kDa band represents the immature/deglycosylated form) was detected (Meziane et al., 1998).
Figure 6. Detection of APP protein in neuronal cultures at different time points.
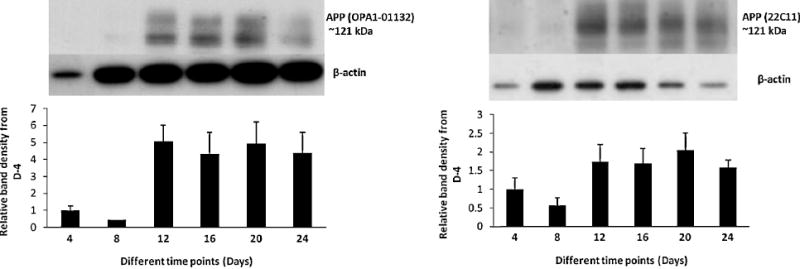
Levels of APP were detected by western blot from the cell lysate as described in the text. The result is consistent with the other findings, i.e., total APP levels are increased several fold at day 12 and stay elevated thereafter. Two distinct isoforms of APP (the top band at 128 kDa represents the mature/glycosylated and 121 kDa band represents immature/ deglycosylated form) was detected.
Levels of intracellular holo APP were measured by using two different antibodies. Clone 22C11 binds to the N-terminus APP (amino acid 66-81) and OPA1-01132 binds to amino acid residues 653-662 of human APP, which correspond to amino acid residues 1-10 of Aβ peptide, respectively. Both the antibodies detected similar immunoreactive protein bands in the time course CL samples and showed an increase in intracellular APP after day 8 (Figure 6). Like other markers, intracellular APP also stayed elevated throughout the duration of the culture. Soluble total APP species and those cleaved by α-secretase (sAPPα) were also detected using 22C11 and OPA1-01132 respectively in the conditioned media samples, and two distinct characteristic bands were observed (data not shown).
3.8. Detection of neuronal and glial markers by immunocytochemical (ICC) analysis
ICC data show that the number of neurons (labeled green with anti-Tau) gradually increased from day 8 and reached a maximum around day 12 (Figure 7). After that period the number of neurons remained relatively constant throughout the duration of the culture. This finding is consistent with the western blot data where the amount of NSE showed an increase at day 12 and thereafter remained elevated throughout the course (Figure 3). In contrast, the number of GFAP positive glial cells started increasing after day 8 and stayed elevated up to day 20. An increase in GFAP was observed (both by ICC and western blot) around day 24 (Figures 7 and 3).
3.9. Investigation of DNA transfection ability in adult neuron culture using GFP plasmid and other promoter constructs
Transfected cells started expressing GFP within 36 hours after the transfection and GFP expression peaked around 48 hours. Manual counting of transfected cells, when compared to the total cell count in the superimposed phase contrast image of the cells, provided an estimate of transfection efficiency of 25-30% (Figure 9). Luciferase signal for human BACE1 promoter gene expression was found to be the strongest (four-fold increase over the promoterless pGL3 vector). Furthermore, the human APP promoter was also produced considerably higher (approximately three-fold) signal than the empty vector (Figure 8). One way ANOVA analysis with Bonferroni adjustment was carried out by using SPSS v16 which showed the results to be significant (p=0.05).
Figure 9. DNA transfection of neuronal culture and visualization by fluorescence microscopy.
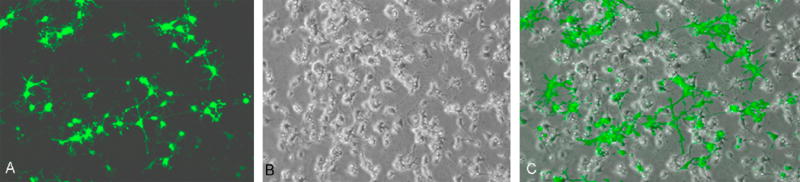
Cells were transfected with pmaxGFP at day 12. Transfection was carried out by lipid based transfection reagent (Transfectin®; Bio-Rad). Transfected cells started expressing ‘green fluorescent protein’ approximately after 36 hours of transfection and maximum expression was noticed after 48 hours. Percentage calculation after manual counting of green transfected cells and non-transfected cells revealed an approximate transfection efficiency of 25-30%.
4. Discussion
Our goal of this study was to establish and characterize an adult primary neuron culture at the morphological, biochemical and immunological level. Our ultimate aim is to study neuron-glia interaction and the basis of long-term viability of neurons. This was required because biochemical and molecular characterization of such adult neuron cultures were not previously reported even though the preparation of neuronal culture from the young rat was previously described (Brewer and Torricelli, 2007). Such work is significant, as an optimized and well-characterized adult neuronal culture would serve as a unique and useful model system to study neurodegenerative disorders, including AD, PD and ALS, as well as provide a tool for the study of a broad range of other topics in neuroscience.
The major strength of the present work lies in the judicious utilization of the available morphological, immunocytochemicals and molecular tools to i) characterize adult neurons over three weeks in vitro, ii) monitor the evolution of neuronal and glial cells along with their protein markers, and iii) examine the role of neuron-glia interaction on long-term neuronal viability, as described below.
Cellular characterization revealed that primary culture described herein also contained glial cells whose number steadily increases as the culture progresses with time in vitro. The presence of glial cells can affect overall neuronal survival which was reflected in the viability assay (CTG). Notably, previous work showed that the glial cells can support neurons in culture by secreting humoral factors (Banker, 1980) and protect cultured neurons from toxicity (Ye and Sontheimer, 1998). Astrocytes also play an important role in maintaining synaptic density and the neuronal network in cultured neurons (Boehler et al., 2007). Low concentrations of cysteine and glutamine in Neurobasal medium reduce glial proliferation (Brewer et al., 1993). However, we observed an increase in the number of GFAP positive glial cells from day 12 onwards and in the latter part of the culture the glial cells extended throughout the cover slip and created a ‘bed’ for the neurons (Figure 7). This was observed by phase contrast imaging as well and after day 16, it was difficult to trace neurites due to excessive proliferation of glial cells. After studying embryonic and adult cultures in parallel, we found that this glial proliferation is a fundamental difference between adult and fetal neuron cultures. For example, viability of fetal neurons was reduced by more than 50% from day 4 to day 8, and approximately 90% of the fetal cells die by day 12 from the original plating. Western blot analysis of primary fetal cultures with anti-GFAP suggested glial proliferation at day 16, around which time the majority of neurons died (data not shown).
Although ICC studies of adult neuronal culture with neuronal and glial markers have been performed (Brewer, 1997), a detailed molecular characterization of neuronal and glial proteins by western blot analysis has not been described in any of the previously published adult neuron culture protocols. Our western blot data, using NSE as neuronal and GFAP as glial markers is consistent with the ICC findings. After the initial increase of NSE at day 12, it remained elevated until day 24. However, glial proliferation, which started around day 12, was so rapid that the ratio of NSE and GFAP (Figure 4) dramatically reduced from day 8 to day 12 and remained approximately at the same level throughout the rest of the experiment. A similar finding was observed in the western blot analysis with syntaxin-6. At this point we are not sure whether or not the number of neurons actually increased. Previous research has shown that neurogenesis can occur in the adult brain from neuroprogenitor or neurospheres (Reynolds and Weiss, 1992), so there might be an increase in the number of neurons in the culture as it progresses. ICC analysis of neuronal stem cells is currently being studied.
The in vitro transfer of plasmid DNA constructs into mammalian cells provides a powerful tool for the analysis of basic cellular and genetic processes like promoter regulation, gene function and the control of cellular protein localization (Haag et al., 2008). Lipid carrier mediated gene transfection is a widely used method for transfection in various cell lines but unfortunately, the genetic manipulation of primary neuronal cultures remains a challenge given their resistance to lipid-mediated gene transfer using standard techniques (Halterman et al., 2009). Studies of gene transfection in the primary neurons have mainly been based on fetal primary neuron culture and data on gene transfer to the adult cortical neurons are scarce. Transfection of pmaxGFP plasmid to the adult neuron culture described herein, by lipid based transfection reagent resulted in a significant appearance of green fluorescent protein after thirty-six hours. Approximately 25-30% transfection efficiency was determined by manual counting of cells. However, transfectability of neurons and glial cells separately was not determined. The above-described transfection technique is not known to be selective for cell type and this technique has worked well in both glial- and neuron-based cell lines (data not shown). Therefore, it seems reasonable to assume that similar proportions of glial and neuronal cells were transfected in these cultures. Future experiments will be aimed at testing this assumption.
The implication of the present study in the field of neurodegenerative disease is many fold from studies related to drug target, biomarkers and gene expressions. AD is the most common cause of dementia in the elderly population in the world and is characterized by deposition of Aβ peptide, an enzymatic cleavage product of APP (Selkoe, 2001), one of the target molecules in the development of new drugs against AD (Lahiri et al., 2007). Western blotting of cell lysate of the culture showed distinct APP bands at 120-130 kDa. Secreted APP in the cell media was also detected by western blot (data not shown). Apart from the quantitative alteration of APP molecule, over expression of the APP gene can be an important factor in the pathophysiology of AD (Rumble et al., 1989). In this context, APP promoters of different species were characterized (Song and Lahiri, 1998). In our study, we were able to observe expression of both human APP (1.2 kb of the upstream regulatory region) and BACE1 (551bp) promoter activities in the culture cells (Figure 8) indicating that this culture can be used for gene regulation and DNA promoter studies in AD, and perhaps a wide range of other neurodegenerative disorders as well. Moreover, the yield of neurons from two hemi cortices was sufficient (approximately 2 million neuronal cells/ rat) to conduct several different experiments from one batch of cultured neurons, and their long term survival in vitro can make them suitable for a wide range of neuroscience research.
Acknowledgments
We thank Gregory Brewer for his advice in the preparation of adult neuron culture and Joseph DiMicco for allowing us to use the microscope. We also thank Bryan Maloney. This work was supported in part by grants from Alzheimer’s Associations (Zenith Award), and the National Institutes of Health (AG18379 and AG18884) to DKL.
Grant sponsor: Alzheimer's Association; Grant sponsor: National Institute of Health; Grant number: AG18379; Grant number: AG18884
Footnotes
Publisher's Disclaimer: This is a PDF file of an unedited manuscript that has been accepted for publication. As a service to our customers we are providing this early version of the manuscript. The manuscript will undergo copyediting, typesetting, and review of the resulting proof before it is published in its final citable form. Please note that during the production process errors may be discovered which could affect the content, and all legal disclaimers that apply to the journal pertain.
References
- Abramoff MD, Magelhaes PJ, Ram SJ. Image Processing with ImageJ. Biophotonics International. 2004;11:36–42. [Google Scholar]
- Bailey JA, Lahiri DK. Neuronal differentiation is accompanied by increased levels of SNAP-25 protein in fetal rat primary cortical neurons: implications in neuronal plasticity and Alzheimer’s disease. Ann N Y Acad Sci. 2006;1086:54–65. doi: 10.1196/annals.1377.001. [DOI] [PubMed] [Google Scholar]
- Banker GA. Trophic interactions between astroglial cells and hippocampal neurons in culture. Science. 1980;209:809–10. doi: 10.1126/science.7403847. [DOI] [PubMed] [Google Scholar]
- Banker GA, Cowan WM. Rat hippocampal neurons in dispersed cell culture. Brain Res. 1977;126:397–42. doi: 10.1016/0006-8993(77)90594-7. [DOI] [PubMed] [Google Scholar]
- Barone FC, Clark RK, Price WJ, White RF, Feuerstein GZ, Storer BL, Ohlstein EH. Neuron-specific enolase increases in cerebral and systemic circulation following focal ischemia. Brain Res. 1993;623:77–82. doi: 10.1016/0006-8993(93)90012-c. [DOI] [PubMed] [Google Scholar]
- Bock JB, Lin RC, Scheller RH. A new syntaxin family member implicated in targeting of intracellular transport vesicles. J Biol Chem. 1996;271:17961–5. doi: 10.1074/jbc.271.30.17961. [DOI] [PubMed] [Google Scholar]
- Boehler MD, Wheeler BC, Brewer GJ. Added astroglia promote greater synapse density and higher activity in neuronal networks. Neuron Glia Biol. 2007;3:127–40. doi: 10.1017/S1740925X07000440. [DOI] [PMC free article] [PubMed] [Google Scholar]
- Bradford MM. A rapid and sensitive method for the quantitation of microgram quantities of protein utilizing the principle of protein-dye binding. Anal Biochem. 1976;72:248–54. doi: 10.1016/0003-2697(76)90527-3. [DOI] [PubMed] [Google Scholar]
- Brewer GJ. Isolation and culture of adult rat hippocampal neurons. J Neurosci Methods. 1997;71:143–55. doi: 10.1016/s0165-0270(96)00136-7. [DOI] [PubMed] [Google Scholar]
- Brewer GJ, Torricelli JR. Isolation and culture of adult neurons and neurospheres. Nat Protoc. 2007;2:1490–8. doi: 10.1038/nprot.2007.207. [DOI] [PubMed] [Google Scholar]
- Brewer GJ, Torricelli JR, Evege EK, Price PJ. Optimized survival of hippocampal neurons in B27-supplemented Neurobasal, a new serum-free medium combination. J Neurosci Res. 1993;35:567–76. doi: 10.1002/jnr.490350513. [DOI] [PubMed] [Google Scholar]
- Brisby H, Olmarker K, Rosengren L, Cederlund CG, Rydevik B. Markers of nerve tissue injury in the cerebrospinal fluid in patients with lumbar disc herniation and sciatica. Spine. 1999;24:742–6. doi: 10.1097/00007632-199904150-00003. [DOI] [PubMed] [Google Scholar]
- Brunger AT. Structure and function of SNARE and SNARE-interacting proteins. Q Rev Biophys. 2005;38:1–47. doi: 10.1017/S0033583505004051. [DOI] [PubMed] [Google Scholar]
- Crouch SP, Kozlowski R, Slater KJ, Fletcher J. The use of ATP bioluminescence as a measure of cell proliferation and cytotoxicity. J Immunol Methods. 1993;160:81–8. doi: 10.1016/0022-1759(93)90011-u. [DOI] [PubMed] [Google Scholar]
- Haag J, Voigt R, Soeder S, Aigner T. Efficient non-viral transfection of primary human adult chondrocytes in a high-throughput format. Osteoarthritis Cartilage. 2008 doi: 10.1016/j.joca.2008.11.004. [DOI] [PubMed] [Google Scholar]
- Halterman MW, Giuliano R, Dejesus C, Schor NF. In-tube transfection improves the efficiency of gene transfer in primary neuronal cultures. J Neurosci Methods. 2009;177:348–54. doi: 10.1016/j.jneumeth.2008.10.023. [DOI] [PMC free article] [PubMed] [Google Scholar]
- Kaech S, Banker G. Culturing hippocampal neurons. Nat Protoc. 2006;1:2406–15. doi: 10.1038/nprot.2006.356. [DOI] [PubMed] [Google Scholar]
- Lahiri DK, Chen D, Maloney B, Holloway HW, Yu QS, Utsuki T, Giordano T, Sambamurti K, Greig NH. The experimental Alzheimer’s disease drug posiphen [(+)-phenserine] lowers amyloid-beta peptide levels in cell culture and mice. J Pharmacol Exp Ther. 2007;320:386–96. doi: 10.1124/jpet.106.112102. [DOI] [PubMed] [Google Scholar]
- Lahiri DK, Robakis NK. The promoter activity of the gene encoding Alzheimer beta-amyloid precursor protein (APP) is regulated by two blocks of upstream sequences. Brain Res Mol Brain Res. 1991;9:253–7. doi: 10.1016/0169-328x(91)90009-m. [DOI] [PubMed] [Google Scholar]
- Lee G, Rook SL. Expression of tau protein in non-neuronal cells: microtubule binding and stabilization. J Cell Sci. 1992;102(Pt 2):227–37. doi: 10.1242/jcs.102.2.227. [DOI] [PubMed] [Google Scholar]
- Lesuisse C, Martin LJ. Long-term culture of mouse cortical neurons as a model for neuronal development, aging, and death. J Neurobiol. 2002;51:9–23. doi: 10.1002/neu.10037. [DOI] [PubMed] [Google Scholar]
- Meziane H, Dodart JC, Mathis C, Little S, Clemens J, Paul SM, Ungerer A. Memory-enhancing effects of secreted forms of the beta-amyloid precursor protein in normal and amnestic mice. Proc Natl Acad Sci U S A. 1998;95:12683–8. doi: 10.1073/pnas.95.21.12683. [DOI] [PMC free article] [PubMed] [Google Scholar]
- Muyllaert D, Terwel D, Kremer A, Sennvik K, Borghgraef P, Devijver H, Dewachter I, Van Leuven F. Neurodegeneration and neuroinflammation in cdk5/p25-inducible mice: a model for hippocampal sclerosis and neocortical degeneration. Am J Pathol. 2008;172:470–85. doi: 10.2353/ajpath.2008.070693. [DOI] [PMC free article] [PubMed] [Google Scholar]
- Olmsted JB. Microtubule-associated proteins. Annu Rev Cell Biol. 1986;2:421–57. doi: 10.1146/annurev.cb.02.110186.002225. [DOI] [PubMed] [Google Scholar]
- Ray J, Peterson DA, Schinstine M, Gage FH. Proliferation, differentiation, and long-term culture of primary hippocampal neurons. Proc Natl Acad Sci U S A. 1993;90:3602–6. doi: 10.1073/pnas.90.8.3602. [DOI] [PMC free article] [PubMed] [Google Scholar]
- Reynolds BA, Weiss S. Generation of neurons and astrocytes from isolated cells of the adult mammalian central nervous system. Science. 1992;255:1707–10. doi: 10.1126/science.1553558. [DOI] [PubMed] [Google Scholar]
- Ries CR, Puil E. Ionic mechanism of isoflurane’s actions on thalamocortical neurons. J Neurophysiol. 1999;81:1802–9. doi: 10.1152/jn.1999.81.4.1802. [DOI] [PubMed] [Google Scholar]
- Rizzi S, Carter LB, Ori C, Jevtovic-Todorovic V. Clinical anesthesia causes permanent damage to the fetal guinea pig brain. Brain Pathol. 2008;18:198–210. doi: 10.1111/j.1750-3639.2007.00116.x. [DOI] [PMC free article] [PubMed] [Google Scholar]
- Rumble B, Retallack R, Hilbich C, Simms G, Multhaup G, Martins R, Hockey A, Montgomery P, Beyreuther K, Masters CL. Amyloid A4 protein and its precursor in Down’s syndrome and Alzheimer’s disease. N Engl J Med. 1989;320:1446–52. doi: 10.1056/NEJM198906013202203. [DOI] [PubMed] [Google Scholar]
- Sambamurti K, Kinsey R, Maloney B, Ge YW, Lahiri DK. Gene structure and organization of the human beta-secretase (BACE) promoter. FASEB J. 2004;18:1034–6. doi: 10.1096/fj.03-1378fje. [DOI] [PubMed] [Google Scholar]
- Schonfeld-Dado E, Segal M. Activity-dependent survival of neurons in culture: a model of slow neurodegeneration. J Neural Transm. 2009 doi: 10.1007/s00702-009-0256-3. [DOI] [PubMed] [Google Scholar]
- Selkoe DJ. Alzheimer’s disease: genes, proteins, and therapy. Physiol Rev. 2001;81:741–66. doi: 10.1152/physrev.2001.81.2.741. [DOI] [PubMed] [Google Scholar]
- Song W, Lahiri DK. Molecular cloning of the promoter of the gene encoding the Rhesus monkey beta-amyloid precursor protein: structural characterization and a comparative study with other species. Gene. 1998;217:151–64. doi: 10.1016/s0378-1119(98)00337-0. [DOI] [PubMed] [Google Scholar]
- Ye ZC, Sontheimer H. Astrocytes protect neurons from neurotoxic injury by serum glutamate. Glia. 1998;22:237–48. doi: 10.1002/(sici)1098-1136(199803)22:3<237::aid-glia3>3.0.co;2-2. [DOI] [PubMed] [Google Scholar]