

Abstract
It has become increasingly clear that the genome is dynamic and exquisitely sensitive, changing expression patterns in response to age, environmental stimuli and pharmacological and physiological manipulations. Similarly, cellular phenotype, traditionally viewed as a stable end-state, should be viewed as versatile and changeable. The phenotype of a cell is better defined as a “homeostatic phenotype” implying plasticity resulting from a dynamically-changing yet characteristic pattern of gene/protein expression. A stable change in phenotype is the result of the movement of a cell between different multi-dimensional identity spaces. Here, we describe a key driver of this transition and the stabilizer of phenotype: the relative abundances of the cellular RNAs. We argue that the quantitative state of RNA can be likened to a state memory, that when transferred between cells, alters the phenotype in a predictable manner.
Cell types and phenotypic classification
Phenotype is the collection of all features or measurements of an organism that arises through interpretation of the genotype. Cell morphology – for example in polarized neurons with distinct somatic, dendritic and axonal compartments – is one aspect of cellular phenotype. Classification and typing of cells are thus groupings of phenotypes, reflecting natural principles of phenotypic groups. Standard ideas of classification in fields like systematics have balanced the requirements of information conveyance with a reflection of the underlying biological principles [1-3]. Ideally, descriptions of cell type should reflect their functional roles or reveal the mechanistic and functional basis of how the types manifest their particular characteristics. We propose, based upon emerging evidence, that a cell's complex multigenic coding and non-coding RNA populations play a dominant role in eliciting and maintaining cellular phenotype.
Morphological observations of cells led to the hypothesis that “form underlies function”. Therefore, it has been thought that cell type classification from morphology reflects the fundamental biology of the cells. Follow up studies on morphologically distinct cell types [4] led to incontrovertible evidence that these cell types differ biochemically and physiologically, eventually leading to classification by biochemical and physiological markers. For example, the dopaminergic and serotonergic neuronal cell type classifications result from a biochemical feature, the most prominent neurotransmitter that they synthesize and release [5]. Moving beyond morphology increased the resolution of classification and brought closer connection to underlying mechanisms but the number of features used remained low until recently. The development of molecular profiling technology including transcriptome microarrays, proteomics, and other “omics” tools (Box 1) naturally led to using entire molecular profiles to type cells, tissues, and organs [6-18]. The use of such large-scale set of measurements dictates the use of computational techniques, especially from the sub-area of machine learning. In machine learning, pattern finding algorithms attempt to classify objects based on a large number of measurements either de novo or incorporating existing prior knowledge of types. Various machine-learning techniques such as clustering, neural networks, support vector machines, decision trees, etc. have all been used to classify cells or identify new types of cells [19-24].
An implicit assumption in using large scale profiling data is the idea that a sufficient amount of measurements will yield general and consistent patterns of types, invariant of what is measured. It seems unlikely that any “sufficient measurement” would be reflective of underlying biological principles--in fact, the idea of “non-specific measurement” has been tried and rejected in biological classification [2]. For any given multicellular organism, all with the same genome, classification of its cell types should reflect the mechanistic basis of how the suite of phenotypic traits is manifest in each cell. Types of cells are manifestations of distinct phenotypes generated through cellular differentiation as part of organismal development [25]. Developmental biologist C.H. Waddington emphasized that all living systems have a phenotype as well as a genotype and that a basic problem is characterizing the amount of phenotypic variety contained within a system—or what he called a “theory of the phenotype” [26]. Therefore, cell classification requires a theory of the cell phenotype; how it arises and how it is maintained. In this essay, we propose that the state1 of the coding and non-coding RNA in a cell, in fact, reflects the developmental generation of the cell and therefore can comprise the theory of cell phenotype.
Cell types can be modulated and inter-converted
All cellular phenotypes develop from an initial egg cell that upon fertilization starts to divide. With each division after the blastula stage, cells of distinct phenotypes are generated. Among the types of cells that are generated are embryonic stem cells, which are pluripotent in their ability to become any post-mitotic differentiated cell type [27]. The possibility of creating stem cells and regulating this differentiation process has been an area of intense investigation for decades [28-30]. Landmark studies by Gurdon et al. (1958) [31] demonstrated the generation of sexually mature adult cloned animals from the transfer of single somatic nuclei to Xenopus eggs that had been enucleated by UV irradiation. The success of nuclear cloning demonstrated the feasibility of “reprogramming” the somatic nucleus so that the genome's program for normal embryonic development could be reinitiated. An interesting observation arising from the early amphibian nuclear transfer experiments was the lower frequency of success when the experiments were performed with somatic nuclei from adults, as compared with somatic nuclei from early stages of development. It was thus clear that as the differentiation of adult cell types is established, it becomes more difficult to achieve correct reprogramming of the nucleus. The more recent nuclear transfer experiments in mammals likewise revealed that highly differentiated cells could be reprogrammed only at low frequency, typically 1% for fibroblasts, or 0.05% for T-cells[32]. Thus, a key feature of differentiation and cell types is the differential stability of the phenotypes in terms of their resistance to perturbation (reprogramming) factors.
The literature for stem cell biology is large and it is not our intention to review embryonic stem cell differentiation, but one emergent theme is that differentiation and maintenance involves a transcriptome program with key regulators and modulation of multiple molecular pathways whose program is executed dependent on both external signals and the order of execution (i.e., based on “cell competency”) [28, 33-36]. Of course, cell differentiation and maintenance are not solely driven by the transcriptional program (e.g. protein expression and post-translational modification are also involved in this process); but, the view that we pursue, in light of recent experiments described below, is that the state of the transcriptome represents a “snapshot memory” of the control program that governs competence states for signals and the maintenance of phenotypes [37].
Important data in support of the idea that transcriptional perturbation can induce cell phenotype changes comes from Takahashi & Yamanaka's demonstration of induction of pluripotent cells from mouse embryonic or adult fibroblasts by introduction of transcription factor encoding DNAs (Box 2). (Figure 1) [38]. The transduced cells, designated iPS (induced pluripotent stem) cells, exhibited the morphology and growth properties of ES cells and expressed ES cell marker genes. Subsequently, different combinations of factors have been used including combinations that increase efficiency [39-44]. These experiments have transformed the field, since for the first time the reprogramming of a human somatic cell to produce a cell with stem cell-like properties was achieved by DNA-directed expression of well-defined messenger RNAs.
Figure 1.
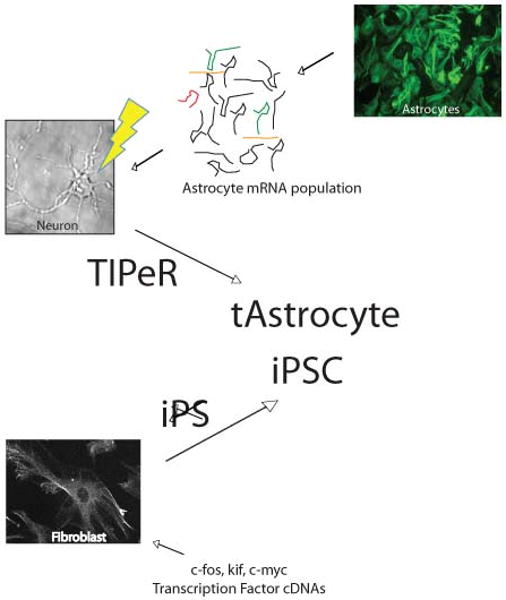
Schematic of the TIPeR and iPS processes. In both of these cell phenotype remodeling protocols, exogenous nucleic acids are introduced into the host cell. In TIPeR, previously it has been shown that after the RNA population is isolated from astroctes it can be introduced into individual neurons. The introduction of the astrocyte RNA population into the neuron (e.g. by phototransfection (lightening bolt)) facilitates the transdifferntiation of the neuron into a t-Astrocyte. For the iPS, various transcription factor cDNA clones are introduced into fibroblasts such that the transcription factor RNAs are synthesized from the exogenous promoters on the cDNA clones. These transcription factors induce a dedifferentiation from the fibroblast phenotype to that of an induced-Pluripotent Stem Cell, iPSC.
The ability of a fibroblast cell to dedifferentiate into a iPS cell underscores the view that a cell's phenotype is not immutable [cf.,45]. The experiments also demonstrate that transcriptional perturbation can initiate a yet-poorly-known cascade of events that lead to phenotype remodeling. In many of these experiments, the conversion efficiency is very low, which suggests the existence of variable cell states (either deterministic or stochastic) that determines switching probability. The increase in conversion efficiency in later experiments suggests that the conversion probability can be modulated—perhaps, by placing the cells within more dynamically critical parts of the molecular state space as discussed below. Finally, the elaboration of the original method into other factors and inducing signals demonstrates that even for seemingly identical conversion process there are multiple pathways to phenotypic remodeling. Despite their successes, we note that these studies and other studies still concentrate on the discovery of a small number of key factors that facilitate the remodeling. As in genetic studies that identify key genes for a phenotype, a small set of key factors may exist within any given context (i.e., cell state) that is especially effective for phenotype switching. But, just as a single gene product cannot be truly sufficient to support all the biochemical reactions for any phenotype, we suggest below that key regulatory factors are part of a larger space of control parameters primarily comprised of quantitative levels of RNA.
Transcriptome state determines cellular phenotype
Different cellular phenotypes are expected to be associated with particular abundances of the molecular components. But, experiments like the generation of iPS cells, elicits a reductionist view of “master regulation” where key molecules control or determine cell phenotypes. However, even the iPS experiments show that the response efficiency can be modulated and there are multiple ways to achieve the same conversion. In fact, variation in a cell's response and the existence of multiple kinds of differentiation factors, even physical factors such as the stiffness of the substrate, are well-known aspects of stem cell biology [46]. An alternate view to “master regulation” hypothesis is a system level view that each phenotypically distinct cell types represent a local “attractor” state within the possible molecular states of a cell (Box 3). This attractor should be viewed not as a point but rather as a collection of states that defines the distinct phenotype; a multi-dimensional cloud as defined by the quantitative level of a cell's molecules. We call this the molecular “equi-phenotype set” of a cell type; e.g., we may have the RNA equi-phenotype set of “rat CA1 hippocampal neurons”. Any cell whose molecular physiology that falls within a particular equi-phenotype set would be characterized as that particular cell type.
The molecular state space of a cell includes RNAs, proteins, lipids, chromatins, etc. It is clear that the relative ratios of the RNA (i.e., the transcriptomes) are not the only relevant variable set for determining phenotype of a cell. However, here we propose that the transcriptome is a key information set because it forms the lowest quantitative information in the cell that can be rapidly amplified (through translation). An underlying assumption of this idea is that the relative abundances of the RNA species in the RNA population should be viewed as providing a memory function that can drive both nuclear and cytoplasmic biochemistry to yield a particular cell type. This suggests that transfer of RNA populations between cells would change the cell's phenotype in a predictable and controllable manner. We call the process of RNA population (two or more types of RNAs in particular ratios) transfer Transcriptome-Induced Phenotype Remodeling (TIPeR) [47] (Figure 1). TIPeR permits us to test the hypothesis that targeted perturbation of the transcriptome towards a new RNA equi-phenotype set will lead to reprogramming a differentiated post-mitotic cell into the phenotypic state of a different differentiated cell type. In particular, rather than a combinatorial exploration of viable perturbations, the whole-transcriptome transfection method allows us to directly “point the transcriptome” towards the target state by introduction of the target transcriptome itself. A cell's phenotype is associated with many other molecules as well as RNA, but, repeated perturbation of the RNA in the target direction can lead to dynamic reorganization of all other molecular factors eventually reaching the target equi-phenotype attractor.
TIPeR has been used to convert a post-mitotic differentiated neuron into an astrocyte-like cell by the introduction of astrocyte RNA population into the host neuron. Figure 3a shows a figure adapted from the original paper where the transcriptome measurement of individual cells (acquired through single-cell linear amplification) is projected into a three dimensional representation. The cloud of phenotypic identity points (RNA equi-phenotype sets) for astrocytes, neurons, control transfected cells (cell transfected with neuronal transcriptome), and various TIPeR treated cells. As described in the original paper, a group of cells called astro-TIPeR display expression profiles close to astrocyte profiles.
Figure 3.
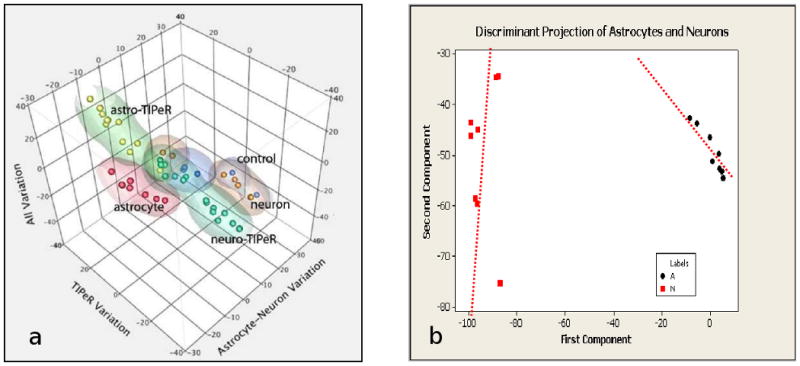
The cellular transcriptome provides a measure of cellular phenotype. a. A 3D projection of individual cell transcriptomes measured by linear amplification of single cell RNA. The points indicate rat neurons, astrocytes, neurons transfected with neuronal transcriptomes (labeled control), neurons transfected with astrocyte transcriptomes (TIPeR; see text) that show similarity to astrocytes (labeled astro-TIPeR) and those that are still similar to neurons (labeled neuro-TIPeR). The three projection axes were obtained from genes informative for distinguishing neurons from astrocytes as well as phototransfection (see Sul et al. [62]). b. A 2D projection of the single-cell transcriptomes of rat hippocampal neurons (red squares) and astrocytes (black circles). Neurons show almost as much dispersal amongst themselves as the mean difference with astrocytes. The overlaid lines show that the cell types differ more by their direction of variation (representing certain ratios of gene expression) than particular levels of expression.
These results demonstrate that single-cell manipulation of the whole transcriptome can lead to stable transformation of differentiated post-mitotic cell phenotype. A ∼40% efficiency of transformation was achieved, which is orders of magnitude greater than previous methods of cell transformation. This highly significant gain in efficiency may be due to much more precise delivery but it may also indicate that quantitative manipulation of the whole transcriptomes is important to bring the cells close to the dynamically critical states for transdifferentiation. These data demonstrated proof-of-principle that the transcriptome can be sufficient control variable for cell phenotype remodeling.
It is important to note that the RNA used in the TIPeR procedure would contain mRNA, long non-coding RNAs and miRNAs. While the mRNAs encode proteins the other RNAs are thought to be involved in various gene regulatory functions including inhibiting RNA translation for selected mRNAs. The complex interplay between stimulation and inhibition of mRNA translation as well as other non-translational regulatory roles of RNA all likely play a role in generating and maintaining cellular phenotype. In the model that we put forth, regardless of the mechanism of action it is still RNA population mediated and regulated. Also it is worth noting that the described TIPeR experiments are RNA augmentation not replacement experiments. The fact that phenotype remodeling does occur in this experimental scenario further supports the idea that particular ratios of RNAs are critically important for manifestation of cellular phenotype.
Genomes, Cells and Dynamical States
The dominant role of the RNA memory in eliciting phenotype adds significantly to the growing awareness within genomics of the roles of complex interactions of molecular components in biological function. Recent conceptualizations of genome-wide molecular processes include pathways, networks and modules (e.g., [48-52]). Networks and pathways emphasize the interaction of the molecular components and the regular motifs that often emerge, but they represent a static view of what is a dynamic process where multiple molecules collide, catalyze, induce and inhibit each other. Thus, a natural conceptualization of genomic functions (e.g., phenotype) is as the output of a complex dynamical system (Box 3) [53-57]. Waddington was one of the first to propose a connection between concepts of differentiation and dynamical systems with his conceptual model of the epigenetic landscape (Box 4) [25, 26]. The most prominent concept from Waddington's metaphor is that developmental trajectories are established by a potential like force (the height of the hill) that create a dynamic flow and fate choices are determined by differences in initial positions, positions that increasingly diverge with development. Thus, if one wanted to reprogram a cell, the easiest path would be to push the cell back to the initial position as with embryonic stem cells or the iPS cells.
Originally, Waddington saw the epigenetic landscape as fixed for a particular organism but proposed the epigenetic landscape may change through evolution of regulation. But, another possibility is that normal development involves continuous changes in the epigenetic landscape, modulated by either inductive or autonomous changes in the control parameters that determine the landscape. This idea was explored by R. Thom [58] and his modeling framework provides a more full conceptualization of the possible dynamical phenomena of development. From this point of view, reprogramming can occur not by pushing the ball back up the hill but by changing the landscape such that the ball now moves in a different direction. In fact, the bifurcating fate choice metaphor of the epigenetic landscape can be understood as the bifurcation of dynamical flow mediated by passage through certain special states (called singular states) in the control parameters.
A model of differentiation dynamics by continuous time-evolution of the epigenetic landscape has several key characteristics. The first is that molecular states are seen to change continuously; if there are abrupt distinct phenotypes that seem irreversible– as in differentiated cells – then such phenotypes are not “locked-in” per se, but represent dynamical states whose reversibility and accessibility is governed by some control parameter. These controlling parameters might be intrinsic factors such as a subset of proteins or RNA, or extrinsic factors such as mechanical cues or small signaling molecules. The second is that these stable phenotypes “attract” the dynamical trajectories of the molecular components in the sense that if a cell is placed in their basin of attraction (Box 3; Figure 2), the cells naturally evolves toward the attractors [59]. Each attractor would then have multiple possible molecular paths that can all equivalently develop to, say, a neuron or a fibroblast. Finally, cells can be induced to switch from one stable state to another stable state by appropriate perturbations that either change the molecular state or change the control parameters. These considerations of a dynamical systems framework for understanding cell differentiation suggests that the key to cell remodeling requires understanding the nature of the attractors (the molecular equi-phenotype sets) and the controlling parameters that determine the qualitative switch of the dynamical flow (i.e., bifurcations in the epigenetic landscape).
Figure 2.

Energy minima model of how cellular phenotype is determined. In this model a particular cellular phenotype is represented as the shaded circle on the energy minima graph. There are two such phenotypes (Phenotype 1 and Phenotype 2). The dotted lines represent hypothetical contours of phenotypic areas that develop and tend to produce more stable states eventually leading to the stable shaded sphere phenotype (e.g. the dynamic flow of phenotype). The vertical axis labeled xm represents the transcriptome while the horizontal axis labeled xc represents all other molecular states including the proteome. Both axes are simplified as one dimensional rather than thousands of dimensions to aid visualization. A host cell (Phenotype 1) might be characterized by a particular combination of the transcriptome and other states and when its transcriptome is replaced or augmented with that of phenotype 2 (the destination cell), the state of the cell is moved in the transcriptome direction (denoted, Xinit,2). Subsequently, other molecular processes adjust following the contours of the hypothetical potential function until they settle around the molecular state of phenotype 2. This schematic also indicates that transcriptome perturbation may result in a cell being trapped at a certain intermediate phenotypic state and that repeated perturbations may help to avoid such traps by pushing the cell through an intermediate stable phenotype(s).
A “region of phenotypic identity”
We propose that phenotypically distinct cells—i.e., cells whose distinct measurements induce researchers to classify them into distinct types, map to specific attractors of cell system dynamics. These attractors are reached through development and differentiation through a dynamic evolution of the cell's epigenetic landscape. An important question is whether each distinct phenotypes map uniquely to a single attractor or whether each phenotype may map to multiple attractors at the molecular level. While the answer is unknown, back-of-the-envelop consideration of the number of distinct cell types versus the number of molecular variables and dynamic complexity suggests that it is highly likely that multiple attractors will map to the same cell phenotype. In fact, even for a single attractor, if we measure a subset of variables such as the RNA population, it is highly likely that the attractor is not a particular fixed point of RNA ratios but a whole family of possible RNA ratios. The TIPeR results shown in Sul et al. [47] and Figure 3a here show single-cell transcriptomes measured for both astrocytes and neurons as well as for the TIPeRed cells. The results of the transcriptomes measured for multiple cells of the same type suggest a broad but distinct scatter of transcriptomes. Figure 3b shows a more focused plot using a 2-dimensional projection of the single-cell transcriptomes for just the neurons and astrocytes. A prominent feature is that the scatter of transcriptomes levels within each cell is up to 80% of the variability between neurons and astroctyes. However, Figure 3 also shows that neurons and astrocytes are clearly differentiated not so much by their mean RNA levels as by their pattern of spread. That is, the “RNA region of phenotypic identity”—what we call RNA equi-phenotype sets, for neurons and astrocytes differ. We propose that RNA equi-phenotype sets is established by biochemical or physiological constraints of a particular cell phenotype—e.g., stochiometric relationships required by a cell in a given phenotypic state. Furthermore, we also propose that the set of constraints that need to be satisfied for a particular phenotype need not completely constrain the levels of all RNA species; RNA levels may drift in many ways without affecting the phenotype (cf. neurons in Figure 3b). We emphasize that this is different from the view of inherent stochastic noise [e.g.,60]. Our view is that the attractors that comprise the RNA equi-phenotype sets of a given cell type may be naturally under determined by the system—more precisely, that the attractor has higher dimensions than a single point. Such case is the norm rather than the exception in complex system dynamics. Thus, variability in single cells is because the cell's function is agnostic to that variability—not everything needs to be controlled at a particular level to be a neuron; but they do have to satisfy certain constraints. The heterogeneity of molecular states that underlie cell types may explain such phenomena as incomplete penetrance of genetic effects, variable disease outcomes, and the lack of resolution in genomic measurements [61-69]. The pliability of cellular phenotype and the associated genomic plasticity suggest that the state of the host cell (cell whose phenotype is to be changed) will be an important factor in dictating the final phenotypic state of any reprogrammed cell. For example, the age of a potential host cell, it's local environment, and simple chance will modulate gene expression levels within the cell's RNA level set. Dependent upon where the cell is in this cloud of phenotypic identity, it may be easier or harder to transdifferentiate into a desired cellular phenotype.
While the RNA state of a cell is an important component of phenotype determination obviously there are other cell biological parameters that also influence phenotype. Post-translational modification of proteins is one that readily stands out. For example, the phosphorylation state of a protein is a key determinant of many cell processes including signaling, cell cycle, clocks, etc. The phenotype of a cell may be modulated, in part, by the phosphorylation state of a few to 100's of distinct cellular proteins. The hundreds of epigenetic modifications of the chromatin and DNA also plays an obvious role in determining cell phenotype; and, of course, transcription factors and their proteomic state is the classic known determinant of the cell phenotype. However, we propose that these phenotypic determinants all work at a different time scale. Post-translational modification of a protein as well as small molecule interactions or work at a fast time scale—the time scale that determines the local flow of the attractors. The epigenetic modifications and the transcriptional regulation program acts at a longer term time scale—the time scale that changes the qualitative flow such as bifurcations described above. RNA contains the already quantitatively elaborated state of the genomic program and its information can be rapidly amplified through translation. Thus, RNA acts at an intermediate time scale mediating the larger scale structure of the locations and relationships of multiple attractors and multiple regions of phenotypic identity. At the risk of over-analogizing, one might think of a cell as a computer where DNA is storage, proteins are peripherals (e.g., the screen) and RNA is the CPU that executes the program retrieved from the DNA.
Conclusions
While it is attractive to think of being able to dissect a cell into some kind of molecular pathway components that are assembled together bottom-up into a working “cell machine” or even that there is a programming logic that is established by such components, our current measurement ability falls considerably short of being able to validate such models at the whole cell level. It is likely that such detailed understanding of a cell's molecular systems will require real-time single molecule measurement of large number of molecular components—if not all the components. Nevertheless, a multi-stable dynamical systems view of cell systems has several potentially useful implications. First, they suggest that cells can be transformed from one type to another without needing to find the exact conditions; an approximate condition that puts it in the attraction basin may be sufficient. Second, they also suggest that the first step in understanding these molecular dynamics is to map out the attraction basins and the transitional pathways between such multiple stable states. Such a map obtained from single cell profiling and perturbation experiments will have practical applications in designing experiments and theoretical applications in model building. Finally, not all of the relevant quantities, i.e., molecular components, need to be set to induce cell remodeling. Manipulating the transcriptome may induce reprogramming and reorganization of other cellular components such as proteins, chromatin, etc.
In our view, the transcriptome represents a tunable part of the state space that can be quantitatively manipulated with tools like laser transfection to effect a system-level cell phenotype transition. The transcriptome has the advantage that we have effective tools for its measurement, synthesis, and delivery. For example, once we know the transcriptomes of various cells by RNA sequencing or array measurements, the right quantitative ratios can be in vitro created from an expression library, much like mixing paints. And, unlike DNA based constructs with uncertain expression regulators, quantitative mixtures can be externally specified and delivered with the TIPeR procedure. Other tunable variables also effect state transitions such as the classic signaling molecules in cell culture [27] and more recently investigated factors like adhesion matrices [70, 71]. The transcriptome and the mechanical stimulation especially represent a set of tunable variables that can be parametrically manipulated—i.e., in continuous quantitative manner, making them especially amenable to systematic optimization studies. The idea that cells can be manipulated into desired phenotype by parametric manipulation of tunable variables suggests a new paradigm of cell and tissue engineering where rather than trying to delineate individual molecular pathways and components for bottom-up assembly of desired control, a top-down control can be implemented through parametric optimization of state perturbations that result in the desired cell remodeling. We propose that the transcriptome represents one of the most effective pathways for such a program.
With this dynamic model in place, it becomes clear that the relative RNA abundances of the RNAs that comprise epistatic units act to establish, maintain and change cellular phenotype. Such a view suggests it is necessary to know the control RNA dynamics of the cell, what might be called the RNA memory or code (in a dynamic sense), to understand the cellular phenotype. Such a code includes knowledge of the absolute and relative abundances of transcribed RNAs as well as the abundances and affinities of the RBPs that then modulate the functionality of the RNAs. As this RNA code is purposeful with regard to cellular phenotype and is easily manipulated by the cellular surroundings, we believe that there is no such entity as a “terminally differentiated cell.” As depicted in Figure 4, various cell types are better thought of as “a place on the arc of a see-saw” with particular RNA epistatic units being the opposing force that dictates where the see-saw stops thereby dictating the cellular phenotype. These epistatic units elicit the RNA memory function of RNA populations in establishing and maintaining cellular phenotype.
Figure 4.
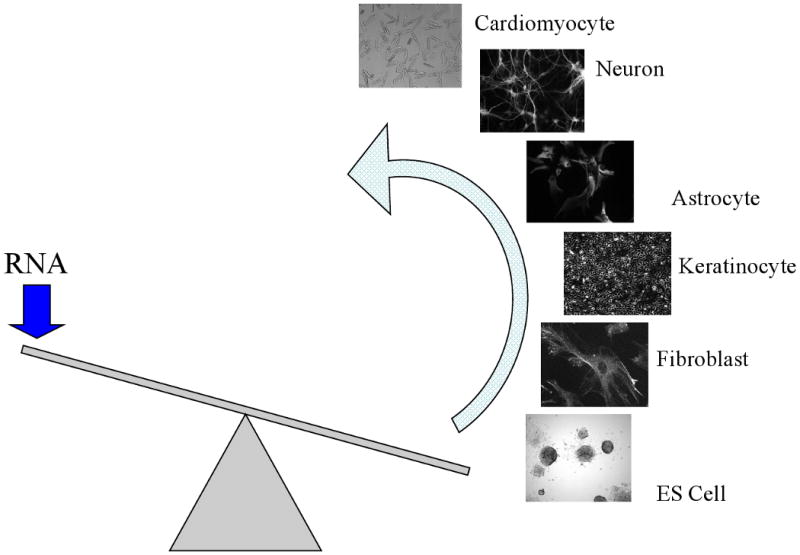
The “see-saw” of cellular phenotype. The interconversion of cellular phenotypes can be viewed as an arc of phenotype where any cell on the arc can be converted to another cell type. This may take a single or several steps of transcriptome modification, including TIPeR RNA replacement or other RNA abundance modulators, such as siRNA. The depiction of the cells on the see-saw highlights that energy is required to interconvert phenotypes and that any particular position on the arc can be viewed as a stable energy state that can be tipped in one or another direction.
Box 1: Omics phenotyping
Recent advances in high-throughput technology have led to the ability to measure a large number of variables for cells and tissues. Microarrays and RNAseq techniques yield quantitative measurements of RNA levels while proteomics techniques yield qualitative or quantitative measurements of protein levels and, to a limited extent, modification status of proteins. Somatic genomic modifications including chromatin changes can be also assayed using sequencing and targeted arrays. These measurements form a molecular feature space for cells where each measured variable (e.g., RNA level of gene A) forms an axis. Samples in this feature space can be computationally analyzed for shared patterns—e.g., clusters. An area of computer science called machine learning specializes in finding meaningful patterns in large-scale data and many techniques have been borrowed from this field. Clusters of samples that shared certain patterns are interpreted as forming distinct biological types.
Box 2: Induced Pluripotent Stem (iPS) cells
In 2006, Takahashi & Yamanaka's first demonstrated the induction of pluripotent cells from mouse embryonic or adult fibroblasts. They introduced four transcription factors – Oct3/4, Sox2, c-Myc, and Klf4 by retroviral transduction – under ES cell culture conditions. The transduced cells, designated iPS (induced pluripotent stem) cells, exhibited the morphology and growth properties of ES cells and expressed ES cell marker genes. The expression of a few transcription factors is hypothesized to reprogram a more general cell-phenotype determining program. Subsequent work produced viable chimera, selecting for nanog and then demonstrated feasibility using human fibroblasts [REF]. The field has bloomed with additional improvements in transfection methods, reprogramming effectors, and applications. The genes used as effectors of iPS include Oct-3/4, nanog, LIN28, and members of the Sox, Klf, Myc family.
Box 3: C.H. Waddington's view of development
The British developmental biologist Conrad Hal Waddington developed a view of organismal development that underlies many of the concepts in development today [REF]. Waddington called development “epigenesis” and separated it into two distinct parts: cell differentiation and morphogenesis. He introduced the metaphor of the “epigenetic landscape” in which development is likened to a marble starting at the top of a rugged hill and rolling down making left-right path decisions at the ridges of the hill. The marble is seen to eventually end up in one of many possible valleys at the foot of the hill, representing possible differentiation states. The height of the ridges separating valleys represent canalizing forces (i.e., forces that stabilize a developmental path). Waddington also hypothesized that the form of the hill—the placement of ridges and valleys, is determined by regulators, suggesting evolution of development by changes in regulation. He also introduced the concept of “chreod” as a developmental trajectory (the path down the hill) and the term “homeorhesis” as the tendency of the trajectory to return to a particular chreod (a time-dependent analog to homeostasis). The epigenetic landscape strongly influences current concepts including the implication that there is a top-down sequence of events, that early decisions have large effects while later decisions have smaller effects, and that modifying the final state requires “pushing” the marble back up the hill to get over to another chreod (a la iPS cells).
Reference B.K. Hall Amer. Zool. 32:113.
Box 4: Dynamical systems models
The goal of dynamical systems models is to specify the trajectories of time-dependent state changes. Objects of interest, say a cell, are considered a point in a “state space” whose position changes as a function of time. The state space depicts all variables that are relevant to the object, e.g., the levels of RNA of a cell. The model of time-dependent trajectories is specified by providing a “flow map” that determines incremental changes in position from any given position. Thus the flow map determines future positions for all points in the state space. There are many different ways to model the flow. For example, the flow of a rock thrown in air is modeled as a process that minimizes the gravitational potential energy. The flow of a dynamical system can lead to certain subsets of points in the state space being a “steady state” in that once those points are reached, no more changes happen (zero flow). Some subset of points form an “attractor” in the sense that the flow near the attractor points towards the attractor inducing the trajectories to “fall towards” the attractor. A steady state that is also an attractor is called a stable steady state. A dynamical system may have multiple attractors and multiple steady states and these attractors and steady states may be a set of points in the state space (e.g., a line) rather than just a single points.
Acknowledgments
We thank members of the Kim and Eberwine labs for stimulating discussions. This work was funded in part by NIH grants MH088849, AG09900 and a NIH Director's Pioneer Award, DP004117. We gratefully acknowledge support from the Human Resources Fact Finder funds from the Commonwealth of Pennsylvania and the Keck Foundation.
Footnotes
Used here to mean relative abundances and identities.
Publisher's Disclaimer: This is a PDF file of an unedited manuscript that has been accepted for publication. As a service to our customers we are providing this early version of the manuscript. The manuscript will undergo copyediting, typesetting, and review of the resulting proof before it is published in its final citable form. Please note that during the production process errors may be discovered which could affect the content, and all legal disclaimers that apply to the journal pertain.
References
- 1.Stevens PF. The Development of Biological Systematics. New York: Columbia Univ Press; 1994. [Google Scholar]
- 2.Hull DL. Science as a Process. Chicago: University of Chicago Press; 1990. [Google Scholar]
- 3.Jardine N, Sibson R. Mathematical taxonomy. London: Wiley; 1971. [Google Scholar]
- 4.Frost JK. An evaluation of cellular morphologic expression of biologic behavior. Monogr Clin Cytol. 1961;2:1–142. [PubMed] [Google Scholar]
- 5.Salmoiraghi GC, Bloom FE. Pharmacology of Individual Neurons. Science. 1964;144:493–9. doi: 10.1126/science.144.3618.493. [DOI] [PubMed] [Google Scholar]
- 6.Alizadeh AA, et al. Distinct types of diffuse large B-cell lymphoma identified by gene expression profiling. Nature. 2000;403(6769):503–11. doi: 10.1038/35000501. [DOI] [PubMed] [Google Scholar]
- 7.Mischel PS, Cloughesy TF, Nelson SF. DNA-microarray analysis of brain cancer: molecular classification for therapy. Nat Rev Neurosci. 2004;5(10):782–92. doi: 10.1038/nrn1518. [DOI] [PubMed] [Google Scholar]
- 8.Lein ES, et al. Genome-wide atlas of gene expression in the adult mouse brain. Nature. 2007;445(7124):168–76. doi: 10.1038/nature05453. [DOI] [PubMed] [Google Scholar]
- 9.Sharova LV, et al. Global gene expression profiling reveals similarities and differences among mouse pluripotent stem cells of different origins and strains. Dev Biol. 2007;307(2):446–59. doi: 10.1016/j.ydbio.2007.05.004. [DOI] [PMC free article] [PubMed] [Google Scholar]
- 10.Yanaihara N, et al. Unique microRNA molecular profiles in lung cancer diagnosis and prognosis. Cancer Cell. 2006;9(3):189–98. doi: 10.1016/j.ccr.2006.01.025. [DOI] [PubMed] [Google Scholar]
- 11.Ramaswamy S, et al. A molecular signature of metastasis in primary solid tumors. Nat Genet. 2003;33(1):49–54. doi: 10.1038/ng1060. [DOI] [PubMed] [Google Scholar]
- 12.Giordano TJ, et al. Organ-specific molecular classification of primary lung, colon, and ovarian adenocarcinomas using gene expression profiles. Am J Pathol. 2001;159(4):1231–8. doi: 10.1016/S0002-9440(10)62509-6. [DOI] [PMC free article] [PubMed] [Google Scholar]
- 13.Chung CH, Bernard PS, Perou CM. Molecular portraits and the family tree of cancer. Nat Genet. 2002 32:533–40. doi: 10.1038/ng1038. [DOI] [PubMed] [Google Scholar]
- 14.Yanagisawa K, et al. Proteomic patterns of tumour subsets in non-small-cell lung cancer. Lancet. 2003;362(9382):433–9. doi: 10.1016/S0140-6736(03)14068-8. [DOI] [PubMed] [Google Scholar]
- 15.Muller FJ, et al. Regulatory networks define phenotypic classes of human stem cell lines. Nature. 2008;455(7211):401–5. doi: 10.1038/nature07213. [DOI] [PMC free article] [PubMed] [Google Scholar]
- 16.Mackler SA, Brooks BP, Eberwine JH. Stimulus-induced coordinate changes in mRNA abundance in single postsynaptic hippocampal CA1 neurons. Neuron. 1992;9(3):539–48. doi: 10.1016/0896-6273(92)90191-f. [DOI] [PubMed] [Google Scholar]
- 17.Hemby SE, et al. Gene expression profile for schizophrenia: discrete neuron transcription patterns in the entorhinal cortex. Arch Gen Psychiatry. 2002;59(7):631–40. doi: 10.1001/archpsyc.59.7.631. [DOI] [PubMed] [Google Scholar]
- 18.Lovatt D, et al. The transcriptome and metabolic gene signature of protoplasmic astrocytes in the adult murine cortex. J Neurosci. 2007;27(45):12255–66. doi: 10.1523/JNEUROSCI.3404-07.2007. [DOI] [PMC free article] [PubMed] [Google Scholar]
- 19.Cauli B, et al. Classification of fusiform neocortical interneurons based on unsupervised clustering. Proc Natl Acad Sci U S A. 2000;97(11):6144–9. doi: 10.1073/pnas.97.11.6144. [DOI] [PMC free article] [PubMed] [Google Scholar]
- 20.Furey TS, et al. Support vector machine classification and validation of cancer tissue samples using microarray expression data. Bioinformatics. 2000;16(10):906–14. doi: 10.1093/bioinformatics/16.10.906. [DOI] [PubMed] [Google Scholar]
- 21.Yamagata N, et al. A training-testing approach to the molecular classification of resected non-small cell lung cancer. Clin Cancer Res. 2003;9(13):4695–704. [PubMed] [Google Scholar]
- 22.Yeang CH, et al. Molecular classification of multiple tumor types. Bioinformatics. 2001;17 1:S316–22. doi: 10.1093/bioinformatics/17.suppl_1.s316. [DOI] [PubMed] [Google Scholar]
- 23.Shipp MA, et al. Diffuse large B-cell lymphoma outcome prediction by gene-expression profiling and supervised machine learning. Nat Med. 2002;8(1):68–74. doi: 10.1038/nm0102-68. [DOI] [PubMed] [Google Scholar]
- 24.Sugino K, et al. Molecular taxonomy of major neuronal classes in the adult mouse forebrain. Nat Neurosci. 2006;9(1):99–107. doi: 10.1038/nn1618. [DOI] [PubMed] [Google Scholar]
- 25.Waddington CH. In: The basic ideas of biology, in The origin of life: Towards a theoretical biology. Waddington CH, editor. Aldine Pub Co.; Edinburgh, UK: 1968. pp. 1–32. [Google Scholar]
- 26.Waddington CH. Principles of Embryology. London: Allen and Unwin; 1956. [Google Scholar]
- 27.Keller G. Embryonic stem cell differentiation: emergence of a new era in biology and medicine. Genes Dev. 2005;19(10):1129–55. doi: 10.1101/gad.1303605. [DOI] [PubMed] [Google Scholar]
- 28.Odorico JS, Kaufman DS, Thomson JA. Multilineage differentiation from human embryonic stem cell lines. Stem Cells. 2001;19(3):193–204. doi: 10.1634/stemcells.19-3-193. [DOI] [PubMed] [Google Scholar]
- 29.Suh H, et al. In vivo fate analysis reveals the multipotent and self-renewal capacities of Sox2+ neural stem cells in the adult hippocampus. Cell Stem Cell. 2007;1(5):515–28. doi: 10.1016/j.stem.2007.09.002. [DOI] [PMC free article] [PubMed] [Google Scholar]
- 30.Lowry NA, Temple S. Making human neurons from stem cells after spinal cord injury. PLoS Med. 2007;4(2):e48. doi: 10.1371/journal.pmed.0040048. [DOI] [PMC free article] [PubMed] [Google Scholar]
- 31.Gurdon JB, Elsdale TR, Fischberg M. Sexually mature individuals of Xenopus laevis from the transplantation of single somatic nuclei. Nature. 1958;182(4627):64–5. doi: 10.1038/182064a0. [DOI] [PubMed] [Google Scholar]
- 32.Gurdon JB. From nuclear transfer to nuclear reprogramming: the reversal of cell differentiation. Annu Rev Cell Dev Biol. 2006;22:1–22. doi: 10.1146/annurev.cellbio.22.090805.140144. [DOI] [PubMed] [Google Scholar]
- 33.Munoz-Sanjuan I, Brivanlou AH. Neural induction, the default model and embryonic stem cells. Nat Rev Neurosci. 2002;3(4):271–80. doi: 10.1038/nrn786. [DOI] [PubMed] [Google Scholar]
- 34.Hulskamp M. Plant trichomes: a model for cell differentiation. Nat Rev Mol Cell Biol. 2004;5(6):471–80. doi: 10.1038/nrm1404. [DOI] [PubMed] [Google Scholar]
- 35.Jacob J, Maurange C, Gould AP. Temporal control of neuronal diversity: common regulatory principles in insects and vertebrates? Development. 2008;135(21):3481–9. doi: 10.1242/dev.016931. [DOI] [PubMed] [Google Scholar]
- 36.Sieweke MH, Graf T. A transcription factor party during blood cell differentiation. Curr Opin Genet Dev. 1998;8(5):545–51. doi: 10.1016/s0959-437x(98)80009-9. [DOI] [PubMed] [Google Scholar]
- 37.Alper H, Stephanopoulos G. Global transcription machinery engineering: a new approach for improving cellular phenotype. Metabolic Engineering. 2007;9(3):258–267. doi: 10.1016/j.ymben.2006.12.002. [DOI] [PubMed] [Google Scholar]
- 38.Takahashi K, Ichisaka T, Yamanaka S. Identification of genes involved in tumor-like properties of embryonic stem cells. Methods Mol Biol. 2006;329:449–58. doi: 10.1385/1-59745-037-5:449. [DOI] [PubMed] [Google Scholar]
- 39.Nakagawa M, et al. Generation of induced pluripotent stem cells without Myc from mouse and human fibroblasts. Nat Biotechnol. 2008;26(1):101–6. doi: 10.1038/nbt1374. [DOI] [PubMed] [Google Scholar]
- 40.Wernig M, et al. c-Myc is dispensable for direct reprogramming of mouse fibroblasts. Cell Stem Cell. 2008;2(1):10–2. doi: 10.1016/j.stem.2007.12.001. [DOI] [PubMed] [Google Scholar]
- 41.Liao J, et al. Enhanced efficiency of generating induced pluripotent stem (iPS) cells from human somatic cells by a combination of six transcription factors. Cell Res. 2008;18(5):600–3. doi: 10.1038/cr.2008.51. [DOI] [PubMed] [Google Scholar]
- 42.Mali P, et al. Improved efficiency and pace of generating induced pluripotent stem cells from human adult and fetal fibroblasts. Stem Cells. 2008;26(8):1998–2005. doi: 10.1634/stemcells.2008-0346. [DOI] [PubMed] [Google Scholar]
- 43.Huangfu D, et al. Induction of pluripotent stem cells from primary human fibroblasts with only Oct4 and Sox2. Nat Biotechnol. 2008;26(11):1269–75. doi: 10.1038/nbt.1502. [DOI] [PubMed] [Google Scholar]
- 44.Kim JB, et al. Oct4-induced pluripotency in adult neural stem cells. Cell. 2009;136(3):411–9. doi: 10.1016/j.cell.2009.01.023. [DOI] [PubMed] [Google Scholar]
- 45.Magnus T, et al. Stem cell myths. Philos Trans R Soc Lond B Biol Sci. 2008;363(1489):9–22. doi: 10.1098/rstb.2006.2009. [DOI] [PMC free article] [PubMed] [Google Scholar]
- 46.Discher DE, Janmey P, Wang YL. Tissue cells feel and respond to the stiffness of their substrate. Science. 2005;310(5751):1139–43. doi: 10.1126/science.1116995. [DOI] [PubMed] [Google Scholar]
- 47.Sul JY, et al. Transcriptome transfer produces a predictable cellular phenotype. Proc Natl Acad Sci U S A. 2009;106(18):7624–9. doi: 10.1073/pnas.0902161106. [DOI] [PMC free article] [PubMed] [Google Scholar]
- 48.Bar-Joseph Z, et al. Computational discovery of gene modules and regulatory networks. Nat Biotechnol. 2003;21(11):1337–42. doi: 10.1038/nbt890. [DOI] [PubMed] [Google Scholar]
- 49.Barabasi AL, Albert R. Emergence of scaling in random networks. Science. 1999;286(5439):509–12. doi: 10.1126/science.286.5439.509. [DOI] [PubMed] [Google Scholar]
- 50.Butte AJ, Kohane IS. Mutual information relevance networks: functional genomic clustering using pairwise entropy measurements. Pac Symp Biocomput. 2000:418–29. doi: 10.1142/9789814447331_0040. [DOI] [PubMed] [Google Scholar]
- 51.Segal E, et al. Module networks: identifying regulatory modules and their condition-specific regulators from gene expression data. Nat Genet. 2003;34(2):166–76. doi: 10.1038/ng1165. [DOI] [PubMed] [Google Scholar]
- 52.Magwene PM, Kim J. Estimating genomic coexpression networks using first-order conditional independence. Genome Biol. 2004;5(12):R100. doi: 10.1186/gb-2004-5-12-r100. [DOI] [PMC free article] [PubMed] [Google Scholar]
- 53.Ideker T, Lauffenburger D. Building with a scaffold: emerging strategies for high- to low-level cellular modeling. Trends Biotechnol. 2003;21(6):255–62. doi: 10.1016/S0167-7799(03)00115-X. [DOI] [PubMed] [Google Scholar]
- 54.De Jong D, et al. Probing the energy landscape of protein folding/unfolding transition states. J Mol Biol. 2002;319(1):229–42. doi: 10.1016/S0022-2836(02)00212-7. [DOI] [PubMed] [Google Scholar]
- 55.Qi L, et al. Genetic regulation by non-coding RNAs. Sci China C Life Sci. 2006;49(3):201–17. doi: 10.1007/s11427-006-0201-8. [DOI] [PubMed] [Google Scholar]
- 56.Sontag LB, Lorincz MC, Georg Luebeck E. Dynamics, stability and inheritance of somatic DNA methylation imprints. J Theor Biol. 2006;242(4):890–9. doi: 10.1016/j.jtbi.2006.05.012. [DOI] [PubMed] [Google Scholar]
- 57.Csete ME, Doyle JC. Reverse engineering of biological complexity. Science. 2002;295(5560):1664–9. doi: 10.1126/science.1069981. [DOI] [PubMed] [Google Scholar]
- 58.Thom R. Stabilité Structurelle et Morphogénèse, Essai d'une Théorie Générale des Modèles. New York: Benjamin; 1971. [Google Scholar]
- 59.Rappel WJ, Strogatz SH. Stochastic resonance in an autonomous system with a nonuniform limit cycle. Phys Rev E Stat Phys Plasmas Fluids Relat Interdiscip Topics. 1994;50(4):3249–3250. doi: 10.1103/physreve.50.3249. [DOI] [PubMed] [Google Scholar]
- 60.Thattai M, van Oudenaarden A. Intrinsic noise in gene regulatory networks. Proc Natl Acad Sci U S A. 2001;98(15):8614–9. doi: 10.1073/pnas.151588598. [DOI] [PMC free article] [PubMed] [Google Scholar]
- 61.Van Gelder RN, et al. Amplified RNA synthesized from limited quantities of heterogeneous cDNA. Proc Natl Acad Sci U S A. 1990;87(5):1663–7. doi: 10.1073/pnas.87.5.1663. [DOI] [PMC free article] [PubMed] [Google Scholar]
- 62.Eberwine J, et al. mRna expression analysis of tissue sections and single cells. J Neurosci. 2001;21(21):8310–4. doi: 10.1523/JNEUROSCI.21-21-08310.2001. [DOI] [PMC free article] [PubMed] [Google Scholar]
- 63.Miyashiro K, Dichter M, Eberwine J. On the nature and differential distribution of mRNAs in hippocampal neurites: implications for neuronal functioning. Proc Natl Acad Sci U S A. 1994;91(23):10800–4. doi: 10.1073/pnas.91.23.10800. [DOI] [PMC free article] [PubMed] [Google Scholar]
- 64.Janicki SM, et al. From silencing to gene expression: real-time analysis in single cells. Cell. 2004;116(5):683–98. doi: 10.1016/s0092-8674(04)00171-0. [DOI] [PMC free article] [PubMed] [Google Scholar]
- 65.Kamme F, Erlander MG. Global gene expression analysis of single cells. Curr Opin Drug Discov Devel. 2003;6(2):231–6. [PubMed] [Google Scholar]
- 66.Levsky JM, et al. Single-cell gene expression profiling. Science. 2002;297(5582):836–40. doi: 10.1126/science.1072241. [DOI] [PubMed] [Google Scholar]
- 67.Mettetal JT, et al. Predicting stochastic gene expression dynamics in single cells. Proc Natl Acad Sci U S A. 2006;103(19):7304–9. doi: 10.1073/pnas.0509874103. [DOI] [PMC free article] [PubMed] [Google Scholar]
- 68.Tietjen I, Rihel J, Dulac CG. Single-cell transcriptional profiles and spatial patterning of the mammalian olfactory epithelium. Int J Dev Biol. 2005;49(2-3):201–7. doi: 10.1387/ijdb.041939it. [DOI] [PubMed] [Google Scholar]
- 69.Wagatsuma A, et al. Determination of the exact copy numbers of particular mRNAs in a single cell by quantitative real-time RT-PCR. J Exp Biol. 2005;208(Pt 12):2389–98. doi: 10.1242/jeb.01625. [DOI] [PubMed] [Google Scholar]
- 70.Engler AJ, et al. Matrix elasticity directs stem cell lineage specification. Cell. 2006;126(4):677–89. doi: 10.1016/j.cell.2006.06.044. [DOI] [PubMed] [Google Scholar]
- 71.McBeath R, et al. Cell shape, cytoskeletal tension, and RhoA regulate stem cell lineage commitment. Dev Cell. 2004;6(4):483–95. doi: 10.1016/s1534-5807(04)00075-9. [DOI] [PubMed] [Google Scholar]