Abstract
Here I summarize decades of work using the biophysics of class I MHC molecules to probe the patchiness and heterogeneity of cell surfaces. This program began as a study of membranes generally. MHC molecules were a convenient probe. However, in recent years, it has become clear that the lateral distribution, clustering, of class I MHC molecules in the membrane affects their recognition by effector CTL. This offers the possibility of enhancing or reducing T-cell recognition of targets by altering the clustering of their membrane proteins.
Keywords: Class I MHC, Lateral diffusion, Membranes, Antigen recognition, Effector T cells
My training in transplantation immunology has informed all of my work at Johns Hopkins. However, early in my career, my background led me to use to “transplantation antigens”, class I MHC molecules as probes of membrane states. This turn to biophysics has recently led back to immunology. We have shown that antigen presentation by class I MHC molecules is strongly affected by the way the class I molecules are distributed across the cell surface.
Larry Frye and fluid membranes
One paper and one student shifted my research to membranes. The paper, from Henry Harris’ laboratory at Oxford, showed that Sendai virus-induced fusion of mouse and human cells created heterokaryons with mouse and human surface markers intermixed over the cell surface [1]. The student Larry D. Frye proposed studying the kinetics of intermixing. We did this by using the first epifluorescence microscope in the US (in the laboratory of my colleague, the late John Cebra) to follow the surface distribution after cell fusion of mouse class I MHC molecules labeled with alloantibodies and of human proteins labeled with a xenoserum. The textbook result was that intermixing of the two markers over many square micrometers of surface took only minutes and appeared to be due to diffusion of the markers in the plane of the plasma membrane [2]. This finding, the basis for the fluid mosaic model of membranes, set me down the path of using alloantibodies and class I MHC molecules to probe cell surface membranes.
FPR/FRAP to probe diffusion in cell surface membranes
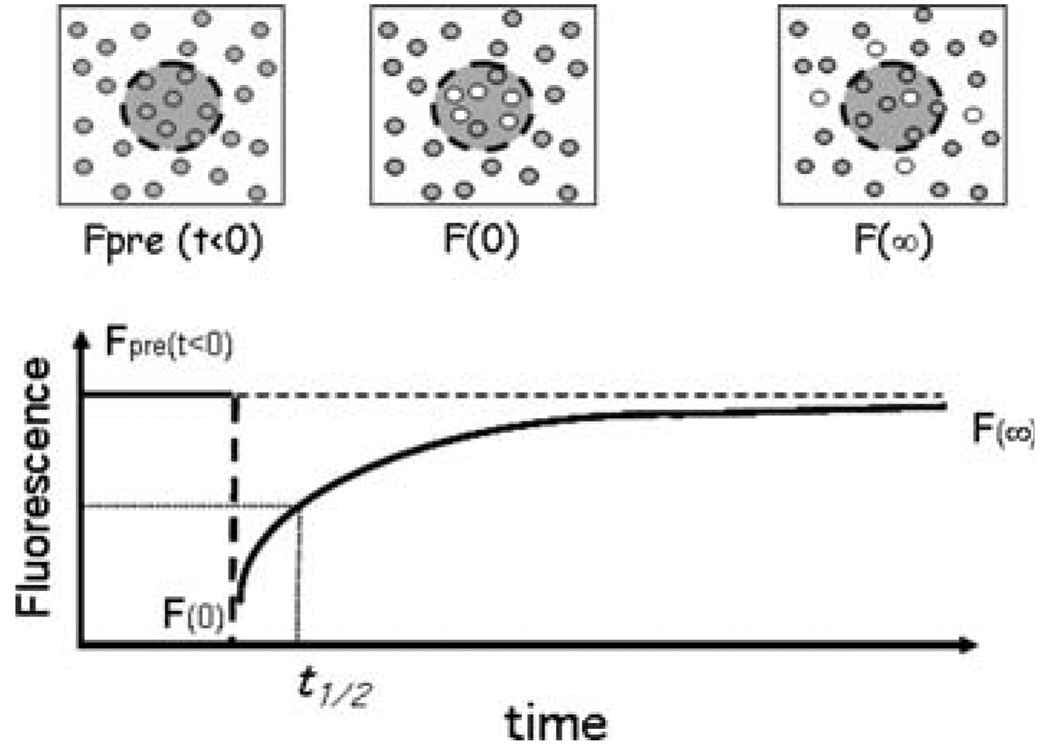
Counting and imaging heterokaryons is tedious. The first major step down the path to probing membrane structure was developing a new method for quantitative measurement of lateral diffusion. This method, fluorescence photobleaching recovery/fluorescence recovery after photobleaching FPR/FRAP, was developed in parallel by three laboratories who published within a few months of one another [3–6]. The method is diagramed in Fig. 1. Instead of following the time to mix molecules in one hemisphere of a heterokaryon with those of the other, FPR begins with a single fluorescent label, then bleaches a small spot of fluorescence and follows recovery of fluorescence in the spot in terms of fluorescence intensity. Our first labels were, of course, fluorescein-conjugated anti-class I mAb, quickly followed by Fl-Fab made from these mAb.
Fig. 1.
Fluorescence photobleaching and recovery, FPR. The top panels diagram a portion of the cell surface labeled with a fluorescence probe. A focused laser beam defines a spot, typically 1 µm2. The attenuated beam measures the molecules (gray dots) in the spot in terms of their fluorescence, Fpre. At t = 0, the attenuator is removed for a few msec and high-intensity laser light bleaches some of the molecules in the spot (white dots) so fluorescence is decreased to F0. The attenuator is then returned, and the weak laser beam follows recovery of fluorescence in the spot in terms of increasing fluorescence as bleached molecules diffuse out of the spot and unbleached, fluorescent, molecules diffuse in. The graph of an FPR experiment is shown in the lower panel. Fluorescence recovers to some asymptote, F∞, which is usually less than Fpre. Diffusion coefficients are calculated from the spot area and the time, t½, taken for fluorescence to recover to half of F∞. Mobile fractions, R, are calculated as R = F∞ − F0/Fpre − F0. A review of FPR is in [33]
FPR detected lateral diffusion of class I MHC molecules over about 4 orders of magnitude. As we got comfortable with system and the behavior of MHC molecules, it became interesting to look at constraints to their diffusion. Here, we took advantage of genetically engineered class I molecules constructed for other purposes. The most notable result was that the glycosylation of class I molecules limited their lateral diffusion. A series of mutants of H2Ld lacking one or more of the 3 N-linked glycans of the wild-type molecule showed increasing lateral diffusion. So, there was a drag on diffusion molecules due to interaction of the bulky N-glycans (each approximately the diameter of an Ig domain) with other membrane proteins [7].
Another general study of membranes using class I molecules showed that membranes are patchy, divided into domains which restrain lateral diffusion [8]. Comparison of the unconfined lateral diffusion of lipid-anchored class I molecules (mouse H2Ld exodomains with the lipidation signal from Qa2 molecules) to that of wild-type H2Ld, with full-length cytoplasmic tails, made it clear that confinement of diffusing class I molecules depended on something in the cytoplasm [9]. We had also used a series of class I molecules truncated in their cytosolic tails to probe diffusion [10], but these experiments were not designed to, and did not, detect membrane domains. The truncation mutants were of more use when we applied new microscopies probe membrane patchiness and membrane domains.
Single-particle tracking, laser traps and clustered class I MHC molecules
FPR measures the diffusion of populations of class I molecules. Five hundred to 1,000 molecules are tracked during the recovery of fluorescence in a 1-µm2 bleached spot. When techniques for labeling and tracking molecules labeled with 40-nm gold particles [11, 12] were developed, it became possible to track and manipulate single class I molecules. These experiments confirmed that there were barriers to lateral diffusion generally. We used a laser trapping technique—dragging bead-labeled molecules across the cell surface—to show that the barriers were a small distance beneath the membrane bilayer. They were crossed by class I molecules with 4-amino acid tails, but they stopped the lateral movement of class I molecules with 9 amino acid tails [13]. Later, more conventional single-particle tracking confirmed the differences between confinement of wild-type and mutant class I molecules [14].
A simple thermodynamic argument says that confining class I molecules in domains ought to drive their clustering [15]. Our first indication of this was from measurements of Forster resonance energy transfer, FRET, between class I HLA molecules labeled with donor and acceptor fluorophores [16]. In a collaboration with George Barisas, we confirmed this clustering by measuring the rotational diffusion of class I MHC molecules [17]. From rotational diffusion, we estimated that up to 25 class I molecules formed a cluster. The clusters required the presence of free class I heavy chains to form. Incubating cells or liposomes in β2-microglobulin reduced or abolished clustering.
Dynamic clusters of class I molecules: the route back to immune responses
With a continuing interest in advanced microscopies, I moved much of my laboratory’s resources into developing near-field microscopy [18], an early form of ultra-microscopy that promised resolution of 40 nm or better, using visible light. As part of the program, we studied the distribution of class I MHC patches on the surface of fibroblasts. The MHC clusters were characteristically large, 300- to 500-nm diameter [19] and could even be seen by conventional fluorescence microscopy [20]. This scale was consistent with what had been learned generally about barriers to lateral diffusion. Many different single-particle tracking experiments scaled these to 500–1,000 nm [12]. There was only one catch. These experiments also showed that the barriers opened periodically, typically every 5–7 s. If the barriers were not stable, how were the clusters of class I molecules maintained? Levi Gheber had the insight that the clusters of diffusible molecules could be maintained dynamically by a combination of dynamic barriers to free diffusion and traffic of class I molecules to and from the surface (Fig. 2) [21]. Our computer model, using published values for all variables, showed that no single cluster was expected to have a lifetime of more than ~30 s, but that continued vesicle traffic, removing and adding class I molecules maintained, a clustered population at steady-state. This prediction was borne out by experimental measurement of clusters GFP-tagged mouse class I molecules. The lifetime of these class I clusters was ~45 s [22]. Unpublished data show that the barriers to diffusion are actin-dependent.
Fig. 2.
A diagram of the elements of a functional plasma membrane that lead to formation of patches of class I MHC molecules at steady-state. The membrane is considered as a checkerboard formed by lipid bilayer (the plane shown) and a mesh of actin-based membrane skeleton. This pattern is disrupted by opening of the actin mesh and by fusion of vesicles with the bilayer. It is assumed that membrane area is kept constant so that a patch membrane is removed from the surface for every patch created by vesicle fusion. Based on [22]
If clusters are dynamic, maintained by a balance between vesicle traffic, diffusion and barrier stability, then changing this balance can change cluster size. At this point, we can return to immunology and ask about the functional consequences of changing class I MHC cluster sizes.
Clustered class I MHC molecules and T-cell recognition of targets
Class I molecules present peptides derived from cytosolic proteins to T cells, and thus reports on infection cell damage. To identify their targets, T cells must find a specific peptide-MHC molecule in a sea of non-cognate self-peptide-MHC on a cell surface. These cognate peptides may be scarce and may also be weakly activating. A number of different schemes: kinetic proofreading [23], serial triggering (cf. [24]) and TCR clustering (cf. [25]) all of which describe kinetic and spatial differences in TCR organization as key to specific TCR-mediated signaling. Since there are two partners in specific reversible interactions of receptor with MHC/peptide, we expect that TCR triggering would be affected by the spatial organization of the MHC molecules presenting peptide, in all 3 models of TCR selectivity.
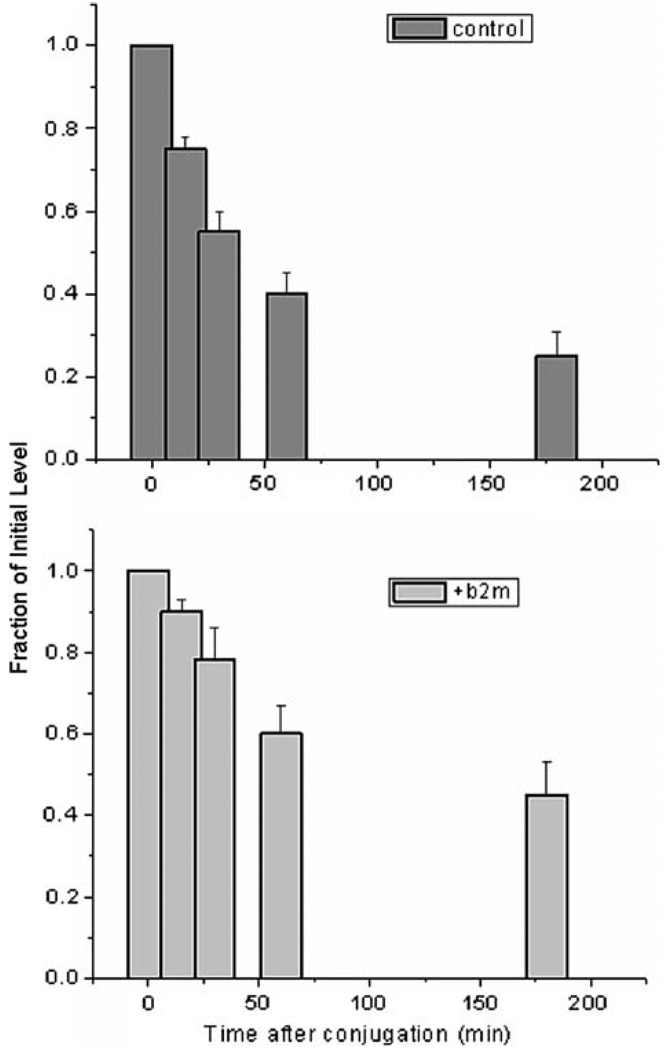
We have taken three approaches to modulating class I clusters. The first is to disperse the small-scale clusters detected by FRET by incubating cells in exogenous β2-microglobulin [16]. This significantly reduces human T-cell responses to alloantigens [26], whether measured in terms of TCR down-regulation after conjugation with targets (Fig. 3) or in terms of target cell lysis, especially at low ratios of effectors to targets.
Fig. 3.
Down-regulation of TCR number after allogeneic T cells engage targets. The upper panel follows T-cell number remaining on the surface of cells engaging unmodified targets, relative to the number (measured with anti-CD3 mAB) before conjugation. The lower panel follows T-cell number remaining on the surface of cells engaging targets incubated in exogenous β2-microglobulin which disperses small-scale clusters of class I MHC molecules. It can be seen that the down-regulation is faster for T cells conjugated to control cells than for T cells conjugated to cells incubated in exogenous β2-microglobulin. Bars are standard deviations. Data are from [27]
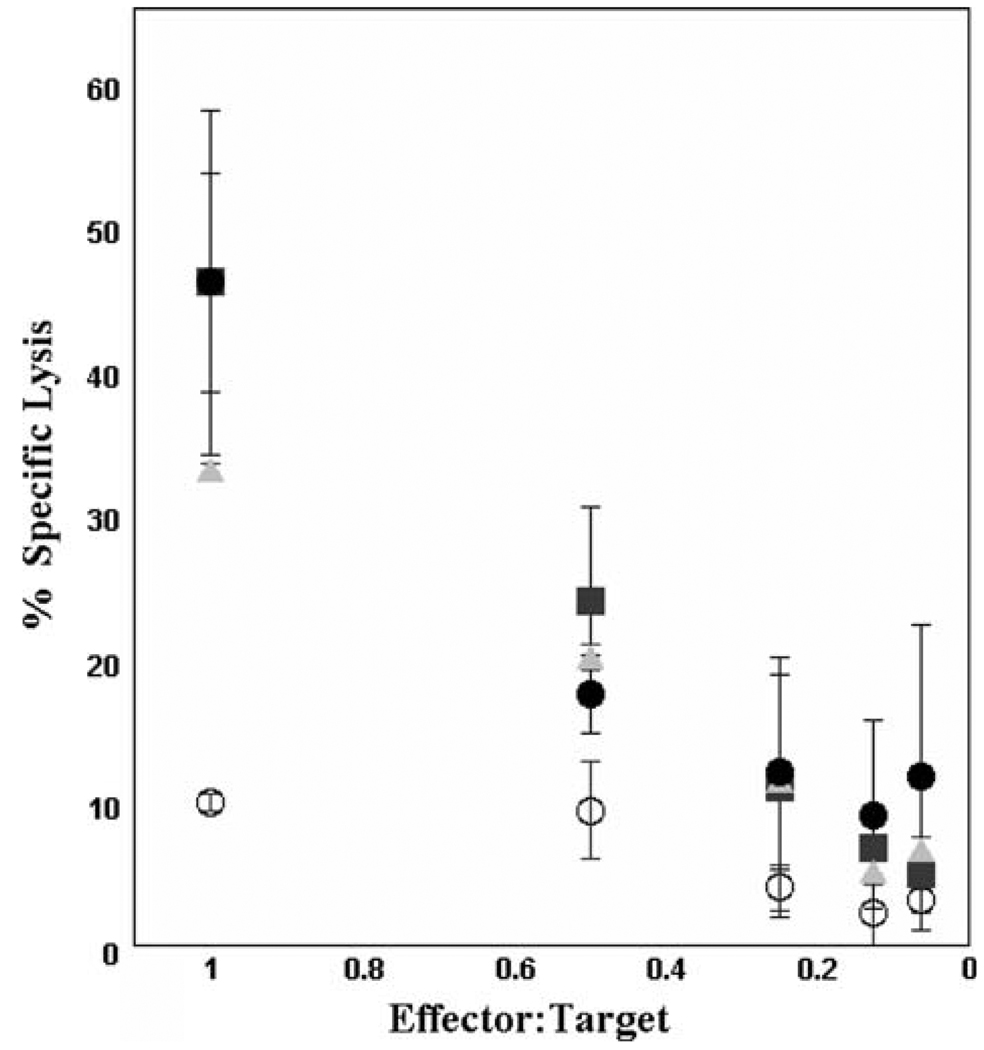
A second approach has been to stabilize the actin-based membrane skeleton, the mesh that restricts lateral diffusion of class I molecules and confines them to domains. Stabilization was achieved in a baroque manner by depleting cell cholesterol. This probe of the relationship between class I MHC molecules and membrane lipid rafts [27] showed that cholesterol-rich rafts were irrelevant to class I function, but cholesterol depletion had global effects on cell actin which propagated to the size and stability of membrane domains enriched in class I molecules [28]. The modulated target cells, with larger than normal clusters of class I molecules, were killed more efficiently than controls. This was most clearly evident at very low ratios of allospecific effectors to targets (Fig. 4). Measurement of granzyme (serine esterase) release by the effectors, as well as controls for non-specific target cell lysis made it clear that enhanced target cell lysis was due to enhanced recognition of class I molecules by effectors. That is, clustering of class I molecules enhanced T-cell effectiveness [29].
Fig. 4.
Killing of cholesterol-depleted allogeneic targets at low ratios of effector to target cells. This Cr51 release assay compares lysis of control JY targets (open symbols) with lysis of JY targets depleted of cholesterol either by treatment with cholesterol oxidase (acute depletion) or by growth in LDL-deficient medium for 10–14 days. Kill is significantly enhanced by cholesterol depletion. These data are from [34]
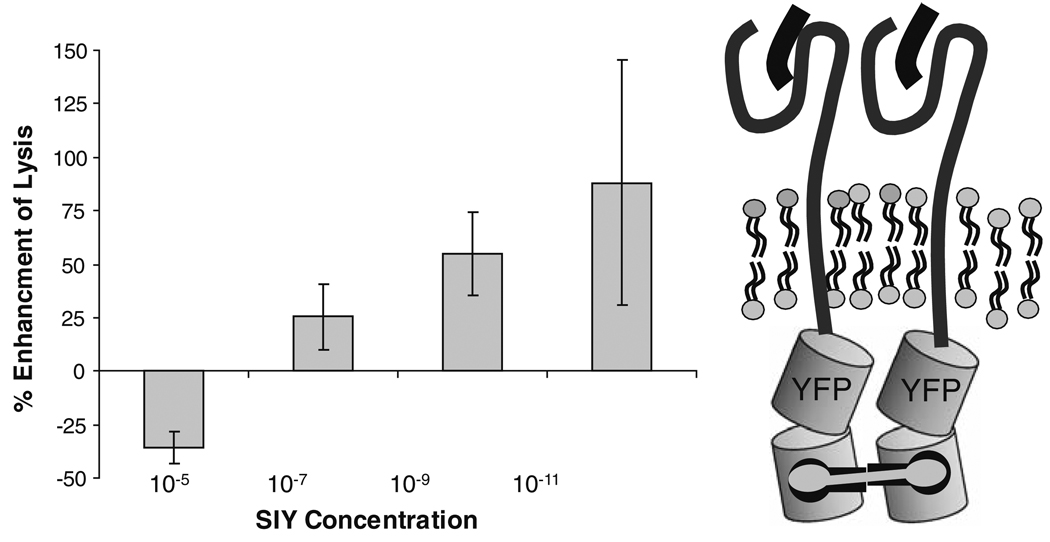
The specificity of the allogeneic T-cell/target cell system that we used to show the relationship between class I MHC clusters and antigen recognition is poorly defined. David Fooksman worked out a system of TCR with known specificity, 2C TCR transgenic, T cells, and engineered class I molecules that could be chemically crosslinked by a dimeric homolog of FK506 [29]. The engineered class I molecules were expressed in T2 cells. These cells are defective in peptide loading, but their class I molecules can be loaded by exogenous peptide. This allowed us to look at the effects of class I clustering on presentation of MHC/peptide complexes that were abundant or scarce and at complexes with different affinities for the 2C TCR. Figure 5 shows the general design of the MHC and crosslinker and the effects of crosslinking and clustering class I molecules on 2C T-cell responses to progressively lower concentrations of H2Kb + SIY peptide, a strong T-cell agonist. Effects of crosslinking are shown as percent enhancement of apoptotic cells compared to non-crosslinked controls. It is clear that clustering class I molecules has little effect when peptide/MHC complexes are abundant but has a large effect when the complexes are scarce (compare 10−9–10−11 M peptide added).
Fig. 5.
Killing of T2Kb target cells loaded with specific peptide as a function of chemically crosslinking class I MHC molecules. Right, diagram of the H2Kb engineered to carry a YFP fluorescent tag and a site for crosslinking by a dimeric homolog of FK506. Since, as noted, class I molecules form small oligomers, we expect that dimerizing them as shown will also recruit other MHC molecules into a larger patch. Left, enhancement of target cell lysis by chemical crosslinking as a function of peptide concentration. T2Kb target cells were incubated with activated 2C T cells and apoptosis measured in terms of annexin V binding. Data are from [35]. Details are also given in [29]
New directions—clustering and declustering class I MHC molecules
Given the observations on clustering and function, as well as recent studies of the relationship between MHC mobility or geometry and T-cell response [30–32], it is likely that understanding the dynamics of MHC-I patches can point to ways of creating and engineering effector T cells with enhanced potential for activity in vivo, for example in killing tumor targets. We also expect that stimulation of naive T cells by dendritic cells can be modulated through changes in class I clustering, though it remains to be seen if DC presenting class I MHC follow the same “rules” as the tissue cell targets of activated CD8 + effector T cells.
Acknowledgments
This work was supported by NIH grant AI14584 to ME. My work in fluorescence microscopy was stimulated by the late Albert Coons, inventor of immunofluorescence and by a close colleague and friend, the late John Cebra. I am grateful to have been associated with them. I am also grateful to the many students and postdoctoral fellows who were involved in these experiments and to my longtime collaborators Martha Zuñiga and Michael Sheetz.
References
- 1.Watkins JF, Grace DM. Studies on the surface antigens of interspecific mammalian cell heterokaryons. J Cell Sci. 1967;2:193–204. doi: 10.1242/jcs.2.2.193. [DOI] [PubMed] [Google Scholar]
- 2.Frye LD, Edidin M. The rapid intermixing of cell surface antigens after formation of mouse-human heterokaryons. J Cell Sci. 1970;7:319–335. doi: 10.1242/jcs.7.2.319. [DOI] [PubMed] [Google Scholar]
- 3.Jacobson K, Wu E, Poste G. Measurement of the translational mobility of concanavalin A in glycerolsaline solutions and on the cell surface by fluorescence recovery after photobleaching. Biochim Biophys Acta. 1976;433:215–222. doi: 10.1016/0005-2736(76)90189-9. [DOI] [PubMed] [Google Scholar]
- 4.Schlessinger J, Koppel DE, Axelrod D, Jacobson K, Webb WW, Elson EL. Lateral transport on cell membranes: mobility of concanavalin A receptors on myoblasts. Proc Natl Acad Sci USA. 1976;73:2409–2413. doi: 10.1073/pnas.73.7.2409. [DOI] [PMC free article] [PubMed] [Google Scholar]
- 5.Zagyansky Y, Edidin M. Lateral diffusion of concanavalin A receptors in the plasma membrane of mouse fibroblasts. Biochim Biophys Acta. 1976;433:209–214. doi: 10.1016/0005-2736(76)90188-7. [DOI] [PubMed] [Google Scholar]
- 6.Edidin M, Zagyansky Y, Lardner TJ. Measurement of membrane protein lateraldiffusion in single cells. Science. 1976;191:466–468. doi: 10.1126/science.1246629. [DOI] [PubMed] [Google Scholar]
- 7.Wier M, Edidin M. Constraint of the translational diffusion of a membrane glycoprotein by its external domains. Science. 1988;242:412–414. doi: 10.1126/science.3175663. [DOI] [PubMed] [Google Scholar]
- 8.Yechiel E, Edidin M. Micrometer-scale domains in fibroblast plasma membranes. J Cell Biol. 1987;105:755–760. doi: 10.1083/jcb.105.2.755. [DOI] [PMC free article] [PubMed] [Google Scholar]
- 9.Edidin M, Stroynowski I. Differences between the lateral organization of conventional and inositol phospholipid-anchored membrane proteins. A further definition of micrometer scale membrane domains. J Cell Biol. 1991;112:1143–1150. doi: 10.1083/jcb.112.6.1143. [DOI] [PMC free article] [PubMed] [Google Scholar]
- 10.Edidin M, Zuniga M. Lateral diffusion of wild-type and mutant Ld antigens in L cells. J Cell Biol. 1984;99:2333–2335. doi: 10.1083/jcb.99.6.2333. [DOI] [PMC free article] [PubMed] [Google Scholar]
- 11.Schnapp BJ, Gelles J, Sheetz MP. Nanometer-scale measurements using video light microscopy. Cell Motil Cytoskeleton. 1988;10:47–53. doi: 10.1002/cm.970100109. [DOI] [PubMed] [Google Scholar]
- 12.Saxton MJ, Jacobson K. Single-particle tracking: applications to membrane dynamics. Annu Rev Biophys Biomol Struct. 1997;26:373–399. doi: 10.1146/annurev.biophys.26.1.373. [DOI] [PubMed] [Google Scholar]
- 13.Edidin M, Zuñiga MC, Sheetz MP. Truncation mutants define and locate cytoplasmic barriers to lateral mobility of membrane glycoproteins. Proc Natl Acad Sci USA. 1994;91:3378–3382. doi: 10.1073/pnas.91.8.3378. [DOI] [PMC free article] [PubMed] [Google Scholar]
- 14.Capps GG, Pine S, Edidin M, Zuñiga MC. Short class I major histocompatibility complex cytoplasmic tails differing in charge detect arbiters of lateral diffusion in the plasma membrane. Biophys J. 2004;86:2896–2909. doi: 10.1016/S0006-3495(04)74341-6. [DOI] [PMC free article] [PubMed] [Google Scholar]
- 15.Engelman DM. Membranes are more mosaic than fluid. Nature. 2005;438:578–580. doi: 10.1038/nature04394. [DOI] [PubMed] [Google Scholar]
- 16.Matko J, Bushkin Y, Wei T, Edidin M. Clustering of class I HLA molecules on the surfaces of activated and transformed human cells. J Immunol. 1994;152:3353–3360. [PubMed] [Google Scholar]
- 17.Chakrabarti A, Matko J, Rahman NA, Barisas BG, Edidin M. Self-association of class I major histocompatibility complex molecules in liposome and cell surface membranes. Biochemistry. 1992;31:7182–7189. doi: 10.1021/bi00146a022. [DOI] [PubMed] [Google Scholar]
- 18.Edidin M. Near-field scanning optical microscopy, a siren call to biology. Traffic. 2001;2:797–803. doi: 10.1034/j.1600-0854.2001.21108.x. [DOI] [PubMed] [Google Scholar]
- 19.Hwang J, Gheber LA, Margolis L, Edidin M. Domains in cell plasma membranes investigated by near-field scanning optical microscopy. Biophys J. 1998;74:2184–2190. doi: 10.1016/S0006-3495(98)77927-5. [DOI] [PMC free article] [PubMed] [Google Scholar]
- 20.Tang Q, Edidin M. Vesicle trafficking and cell surface membrane patchiness. Biophys J. 2001;81:196–203. doi: 10.1016/S0006-3495(01)75691-3. [DOI] [PMC free article] [PubMed] [Google Scholar]
- 21.Gheber LA, Edidin M. A model for membrane patchiness: lateral diffusion in the presence of barriers and vesicle traffic. Biophys J. 1999;77:3163–3175. doi: 10.1016/S0006-3495(99)77147-X. [DOI] [PMC free article] [PubMed] [Google Scholar]
- 22.Lavi Y, Edidin MA, Gheber LA. Dynamic patches of membrane proteins. Biophys J. 2007;93:L35–L37. doi: 10.1529/biophysj.107.111567. [DOI] [PMC free article] [PubMed] [Google Scholar]
- 23.McKeithan TW. Kinetic proofreading in T-cell receptor signal transduction. Proc Natl Acad Sci USA. 1995;92:5042–5046. doi: 10.1073/pnas.92.11.5042. [DOI] [PMC free article] [PubMed] [Google Scholar]
- 24.San José E, Borroto A, Niedergang F, Alcover A, Alarcón B. Triggering the TCR complex causes the downregulation of nonengaged receptors by a signal transduction-dependent mechanism. Immunity. 2000;12:161–170. doi: 10.1016/s1074-7613(00)80169-7. [DOI] [PubMed] [Google Scholar]
- 25.Bachmann MF, Ohashi PS. The role of T-cell receptor dimerization in T-cell activation. Immunol Today. 1999;20:568–576. doi: 10.1016/s0167-5699(99)01543-1. [DOI] [PubMed] [Google Scholar]
- 26.Bodnár A, Bacsó Z, Jenei A, Jovin TM, Edidin M, Damjanovich S, et al. Class I HLA oligomerization at the surface of B cells is controlled by exogenous beta(2)-microglobulin: implications in activation of cytotoxic T lymphocytes. Int Immunol. 2003;15:331–339. doi: 10.1093/intimm/dxg042. [DOI] [PubMed] [Google Scholar]
- 27.Edidin M. The state of lipid rafts: from model membranes to cells. Annu Rev Biophys Biomol Struct. 2003;32:257–283. doi: 10.1146/annurev.biophys.32.110601.142439. [DOI] [PubMed] [Google Scholar]
- 28.Kwik J, Boyle S, Fooksman D, Margolis L, Sheetz MP, Edidin M. Membrane cholesterol, lateral mobility, and the phosphatidylinositol 4, 5-bisphosphate-dependent organization of cell actin. Proc Natl Acad Sci USA. 2003;100:13964–13969. doi: 10.1073/pnas.2336102100. [DOI] [PMC free article] [PubMed] [Google Scholar]
- 29.Fooksman DR, Grönvall GK, Tang Q, Edidin M. Clustering class I MHC modulates sensitivity of T cell recognition. J Immunol. 2006;176:6673–6680. doi: 10.4049/jimmunol.176.11.6673. [DOI] [PMC free article] [PubMed] [Google Scholar]
- 30.Neumann F, Sturm C, Hulsmeyer M, Dauth N, Guillaume P, Luescher IF, et al. Fab antibodies capable of blocking T cells by competitive binding have the identical specificity but a higher affinity to the MHC-peptide-complex than the T cell receptor. Immunol Lett. 2009;125:86–92. doi: 10.1016/j.imlet.2009.06.002. [DOI] [PubMed] [Google Scholar]
- 31.Hosseini BH, Louban I, Djandji D, Wabnitz GH, Deeg J, Bulbuc N, et al. Immune synapse formation determines interaction forces between T cells and antigen-presenting cells measured by atomic force microscopy. Proc Natl Acad Sci USA. 2009;106:17852–17857. doi: 10.1073/pnas.0905384106. [DOI] [PMC free article] [PubMed] [Google Scholar]
- 32.Shen K, Thomas VK, Dustin ML, Kam LC. Micropatterning of costimulatory ligands enhances CD4+ T cell function. Proc Natl Acad Sci USA. 2008;105:7791–7796. doi: 10.1073/pnas.0710295105. [DOI] [PMC free article] [PubMed] [Google Scholar]
- 33.Lippincott-Schwartz J, Snapp E, Kenworthy A. Studying protein dynamics in living cells. Nat Rev Mol Cell Biol. 2001;2:444–456. doi: 10.1038/35073068. [DOI] [PubMed] [Google Scholar]
- 34.Kwik JF. Ph.D. Thesis. Johns Hopkins University; 2000. Immobilization of MHC class I molecules enhances allogeneic target cell lysis by CD8+ T cells. [Google Scholar]
- 35.Fooksman DR. Ph.D. Thesis. Johns Hopkins University; 2007. The surface organization of MHC class I molecules regulates their recognition by T-cells. [Google Scholar]


