Abstract
The primary goals of ultrasound molecular imaging are the detection and imaging of ultrasound contrast agents (microbubbles), which are bound to specific vascular surface receptors. Imaging methods that can sensitively and selectively detect and distinguish bound microbubbles from freely circulating microbubbles (free microbubbles) and surrounding tissue are critically important for the practical application of ultrasound contrast molecular imaging. Microbubbles excited by low frequency acoustic pulses emit wide-band echoes with a bandwidth extending beyond 20 MHz; we refer to this technique as TLRH (transmission at a low frequency and reception at a high frequency). Using this wideband, transient echo, we have developed and implemented a targeted imaging technique incorporating a multi-frequency co-linear array and the Siemens Antares® imaging system. The multi-frequency co-linear array integrates a center 5.4 MHz array, used to receive echoes and produce radiation force, and two outer 1.5 MHz arrays used to transmit low frequency incident pulses. The targeted imaging technique makes use of an acoustic radiation force sub-sequence to enhance accumulation and a TLRH imaging sub-sequence to detect bound microbubbles. The radiofrequency (RF) data obtained from the TLRH imaging sub-sequence are processsed to separate echo signatures between tissue, free microbubbles, and bound microbubbles. By imaging biotin-coated microbubbles targeted to avidin-coated cellulose tubes, we demonstrate that the proposed method has a high contrast-to-tissue ratio (up to 34 dB) and a high sensitivity to bound microbubbles (with the ratio of echoes from bound microbubbles versus free microbubbles extending up to 23 dB). The effects of the imaging pulse acoustic pressure, the radiation force sub-sequence and the use of various slow-time filters on the targeted imaging quality are studied. The TLRH targeted imaging method is demonstrated in this study to provide sensitive and selective detection of bound microbubbles for ultrasound molecularly-targeted imaging.
I. INTRODUCTION
Ultrasound molecular imaging requires several steps: coating microbubble contrast agents with ligands designed to bind to receptors on the vascular endothelium; injecting these agents intravenously; and creating an ultrasound image of their circulation and accumulation [1, 2]. Recent studies have shown that targeted ultrasound imaging is a viable tool for the detection and diagnosis of thrombus [3, 4], inflammation [5–7] and cancer [8–11]. For example, functionalized lipid-based microbubbles targeting intercellular adhesion molecule-1 (ICAM-1) have been recently used to detect the over-expression of ICAM-1 during acute cardiac rejection [12].
In targeted ultrasound imaging, both the imaging technique and the imaging probe play crucial roles. The targeting contrast agent must have high specificity and efficiency, while the imaging technique must be capable of differentiating the echoes of targeted bubbles from those of free microbubbles. Low targeting efficiency is a major challenge in the clinical application of ultrasound targeted imaging. In some cases, the density of bound microbubbles retained in the vasculature at a target site has been too low to provide a detectable acoustic signal [13].
A further challenge is the differentiation of echoes from bound microbubbles in the presence of free microbubbles [14]. Strong background echoes from free microbubbles and tissue obscure echoes from bound microbubbles in conventional multiple-pulse ultrasound contrast imaging, such as pulse inversion (PI) imaging, and thus the potential sensitivity of molecular imaging is lost. Lindner et al [6] proposed an imaging method that acquires echoes from bound microbubbles after the clearance of free microbubbles; however, this method generally incurs a delay of 10 minutes. In order to increase the targeting efficiency and imaging specificity, in this paper, we propose the combined use of acoustic radiation force and high contrast-to-tissue ratio (CTR) imaging methods.
Acoustic radiation force displaces microbubbles to a blood vessel wall, increasing adhesion, particularly within veins and venules [13, 15–19]. In our previous study, we demonstrated that the targeting efficacy of microbubbles increases as a result of acoustic radiation force: the number of biotinylated microbubbles bound to a synthetic vessel coated with avidin increased as much as 20-fold and the adhesion of microbubbles targeted to αvβ3 expressed on human umbilical vein endothelial cells increased 27-fold within a mimetic vessel when radiation force was applied [17].
Microbubbles are unique nonlinear oscillators in an ultrasound acoustic field, producing wideband echoes [20–22]. The oscillation-induced nonlinear acoustic backscatter provides an opportunity to distinguish tissue and microbubble echoes based on their center frequency or response to the phase of the transmitted pulse [23, 24]. Under suitable conditions, an acoustically-driven microbubble will emit an acoustic transient response [25–27]. Our recent study found that strong wideband high frequency (5–40 MHz) components were recorded when microbubbles were insonified by 2.25 MHz ultrasound with pressures of 350–800 kPa [20]. The high frequency wideband spectrum produced by an acoustic transient response can be exploited to improve imaging sensitivity and resolution. Here, we transmit a short pulse with a center frequency near 1.5 MHz, resulting in a broadband ultrasound echo [20]. As compared with transmission and reception of the lower ultrasound frequency, the TLRH (transmission with a low center frequency and reception with a high center frequency) strategy generates a higher resolution image; as compared with transmission and reception of the higher ultrasound frequency, the TLRH strategy increases the sensitivity to microbubble echoes [14, 20]. The TLRH technique uses a single pulse to image the distribution of microbubbles, whereas PI techniques require at least 2 pulses to cancel the echoes from surrounding tissue. This decrease in the number of necessary transmitted pulses will be crucial for achieving high frame rate 3D targeted imaging. In addition, TLRH imaging should be insensitive to motion artifacts.
In this paper, we investigate the performance of TLRH and new ultrasound arrays for targeted imaging on a commercial clinical scanner.
II. METHODS
A. Frequency-dependent transient response
Previous work has been performed by Kruse [20] to produce microbubble transient responses, using the 2.25 MHz transducer listed in Table I. In our work presented here, we optimized the frequency of the imaging pulse for generating the TLRH transient response from microbubbles. Experiments were conducted with various center frequencies as listed in Table I, using the experimental system as described by Kruse [20].
TABLE I.
Transducer Specifications
| Transducer | 1-MHz | 2.25-MHz | 3.2-MHz | 15-MHz |
|---|---|---|---|---|
| Model | V303 | V305 | V309 | V313-SM |
| Focal length | 25.4mm | 50.8mm | 50.8mm | 25.4mm |
| Aperture diameter | 12.7mm | 19mm | 12.7mm | 6.35mm |
| -6 dB bandwidth (two-way), % | 78 | 70 | 68 | 60 |
B. Transducer array and clinical ultrasound system
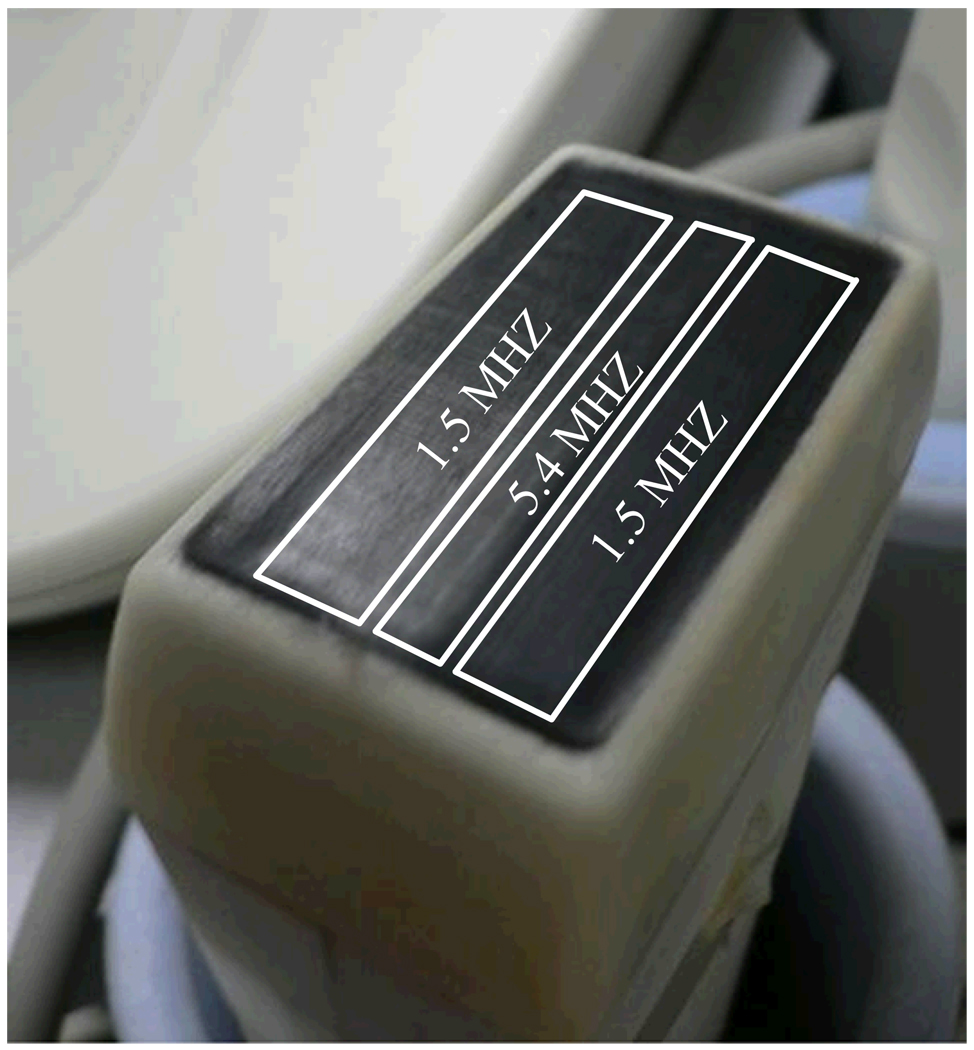
The multi-frequency co-linear array transducer was integrated with the Siemens Antares® System (Siemens Medical Solutions, Mountain View, CA, USA) for high resolution TLRH imaging. A “side by side” transducer array was designed to achieve the large difference between the low transmitting and high receiving frequencies used in the TLRH imaging strategy; the center high-frequency array is surrounded on each side by two low-frequency arrays [28, 29] (Fig. 1). Each of the two outer arrays has 64 elements designed to operate (in transmit-only for TLRH mode) at a center frequency of 1.5MHz with a −6dB fractional bandwidth of ~50%. The two arrays are wired in parallel so that corresponding elements of each array are pulsed together. The inner array is comprised of 128 elements designed to operate (in either receive-only in TLRH mode, or otherwise in transmit-receive imaging mode) at 5.4MHz with a −6dB fractional bandwidth of 73%.
Fig. 1.
Co-linear array transducer face with 3 individual arrays delineated: the center high frequency (5.4 MHz) array is surrounded on each side by low frequency arrays (1.5 MHz).
Wideband transmission and wideband reception are both essential. Based upon our previous studies, tissue echoes include frequencies up to the third harmonic; therefore, the center frequency of the receiving transducer array should be higher than the third harmonic, which is 4.5 MHz based on our transmission frequency. With a higher receiving frequency, the separation of bubble echoes and tissue echoes improves. Moreover, the lateral and axial resolution will also benefit from the higher receiving frequency. In general, a higher receiving frequency requires more elements in the transducer array and leads to higher cost. Further, the center array is intended to cover the resonance frequency of smaller encapsulated microbubbles and therefore increasing the frequency further is undesirable.
Calibration of the probe was performed with a needle hydrophone (model HNZ-0400, Onda Corp., Sunnyvale, CA, USA) and an oscilloscope (model 9310 AM, LeCroy, Chestnut Ridge, NY, USA).
C. In vitro targeted imaging flow phantom
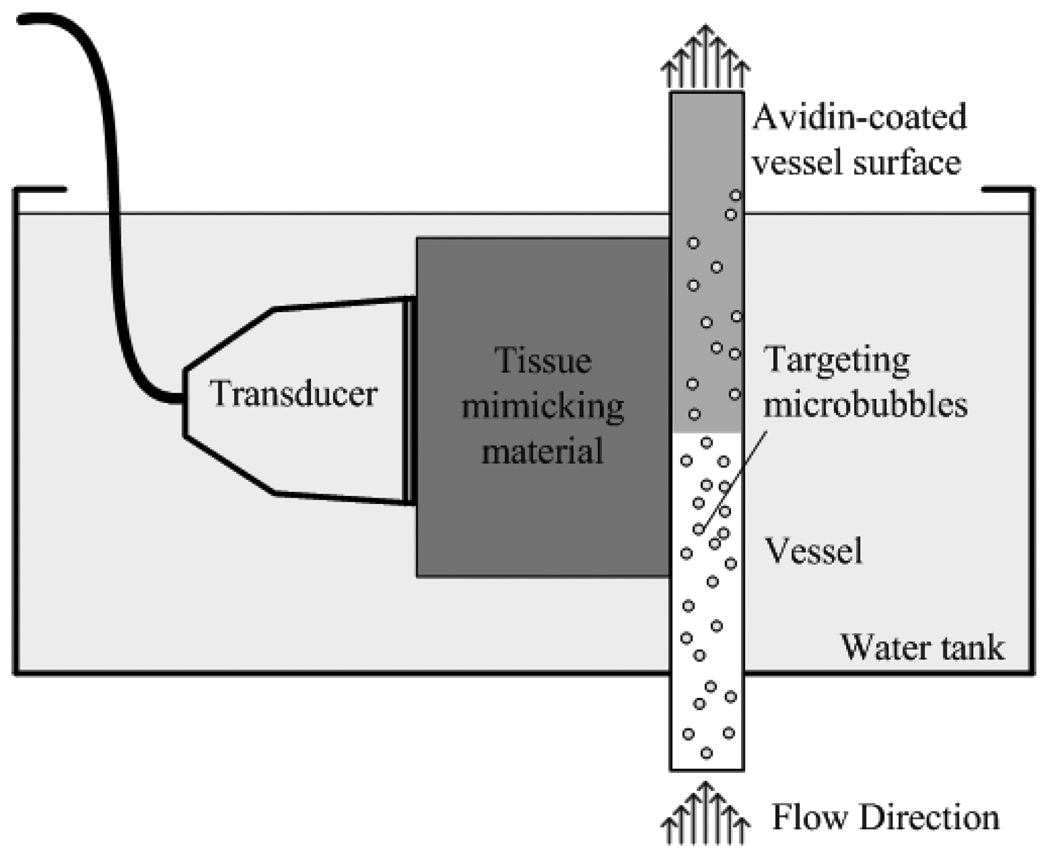
We designed a flow phantom (Fig. 2) consisting of 200 µm diameter vessel-mimicking cellulose tubes (Spectrum Laboratories, Rancho Dominguez, CA, USA) placed at the focus of the transducer (30–35 mm) and adjacent to tissue-mimicking material. The tissue mimicking material contains 12 µm silicon carbide particles as scatterers with an attenuation of 0.3 dB/cm/MHz [30].
Fig. 2.
An illustration of the targeted imaging phantom.
The microbubbles used in this study are biotin-coated lipid-shelled microbubbles encapsulating a high molecular weight gas core of octafluoropropane [31]. The microbubble radius was measured using an Accusizer® (model 770A, Particle Sizing System, Santa Barbara, USA), with a typical concentration of 109 to 1010 microbubbles per milliliter yielding a mean radius of 0.9 µm.
The diluted biotin-targeted microbubbles (104 microbubbles/ml) were pumped by a syringe pump (model PHD 2000, Harvard Apparatus, Holliston, MA, USA) through an avidin coated cellulose tube. The mean flow rate was 5 mm/s, which corresponded to a wall shear stress of 0.2 Pa, a value in the physiologically-relevant range for microvessels such as arterioles and venules [32]. The tube was held vertically to eliminate the retention of microbubbles at the top of the tube due to floatation (Fig. 2). The tissue mimicking material, the tube and the transducer were immersed in a water bath for acoustic coupling.
To ensure that each pulse insonified a new volume of microbubbles, mean travel distance between frames (indicating the distance travelled in each frame) should be greater than the −6dB transducer azimuthal beamwidth. The tube is parallel to the surface of the transducer and within the imaging (azimuthal-depth) plane. In this study, the mean travel distance between frames was 1 mm, which is greater than the 0.5-mm beamwidth.
D. Targeted imaging technique
The imaging modality makes use of an image-push-image (IPI) sequence, illustrated in Fig. 3. A 10-second radiation force sub-sequence (100 cycle, 5.4 MHz excitations at 200 kPa peak negative pressure (PNP), the PRF is 2.4 kHz) is produced to deflect microbubbles toward the vessel wall and increase microbubble adhesion. Following this, T1R7 (transmit at 1.5MHz and receive at 7 MHz) images (frame rate is 5 frames/s) are generated by transmitting from the low frequency outer arrays at 1.5 MHz and receiving by the high frequency center array at 7 MHz, which is near the upper band edge of the array.
Fig. 3.
IPI sequence consists of a radiation force sub-sequence and a TLRH imaging sub-sequence.
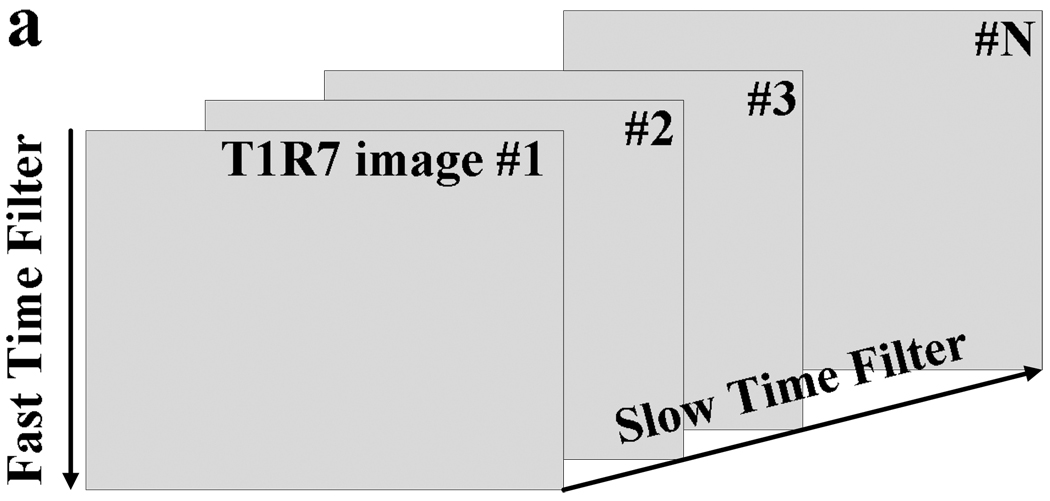
The echoes received from the TLRH imaging sub-sequence are first band-pass filtered, where the band-pass filter is implemented along each scan line within one T1R7 frame (the filter is also called a fast-time filter). The band-pass filter consists of a 6 MHz high-pass filter and a 7 MHz low-pass filter. The low-pass filter is necessary to avoid aliasing and the high-pass filter is used to exclude the transmitted passband. As Zhao discussed [14], echoes from free microbubbles can be considered as zero-mean random signals; while the echoes from bound microbubbles have a non-zero mean. Hence, free microbubble echoes are suppressed by applying a low-pass slow-time frame-to-frame filter (Fig. 4). The amplitude threshold, which is set at ~10% of the dynamic range of the slow-time-filtered RF amplitude, is applied to minimize noise. The amplitude threshold value was determined based on the noise level of RF data after the slow-time filter.
Fig. 4.
Descriptive graph of the use of phantom regions, fast-time band-pass filter and slow-time low-pass filter to separate the bound microbubble echoes from those of tissue and free microbubbles. Fast-time filter and slow-time filter are applied to the radiofrequency (RF) data from the T1R7 imaging sub-sequence. The fast time band-pass filter facilitates the discrimination of microbubble echoes from those of tissue; the slow-time filter is designed to differentiate bound and free microbubble echoes.
For the slow-time filter design, we considered three types of low-pass filters: an averaging filter, finite impulse response (FIR) filter, and infinite impulse response (IIR) filter. The low cutoff frequencies of the FIR and IIR filters were set as 4% of the Doppler frequency shift generated by flow rates of 5 mm/s with a 1.5 MHz incident wave; this corresponds to a low-pass Doppler cutoff of 0.2 mm/s or 0.03 Hz. The low cutoff frequency of the averaging filter decreases with increasing filter order. When the order of the averaging filter was 2, the low cutoff frequency was approximately 6 Hz (−20 dB); when the order was 17, the low cutoff frequency was approximately 0.67 Hz (−20 dB). The primary filters used in this study are listed in Table II.
TABLE II.
Slow Time Filters Used In This Study
| Averaging Filter | FIR filter | IIR (Elliptic) filter | |
|---|---|---|---|
| Low Cutoff, Hz | Changes with order | 0.03 | 0.03 |
| Windows | N/A | Chebyshev Win | N/A |
| Ripple, P/S | N/A | 25dB | 3 dB/50 dB |
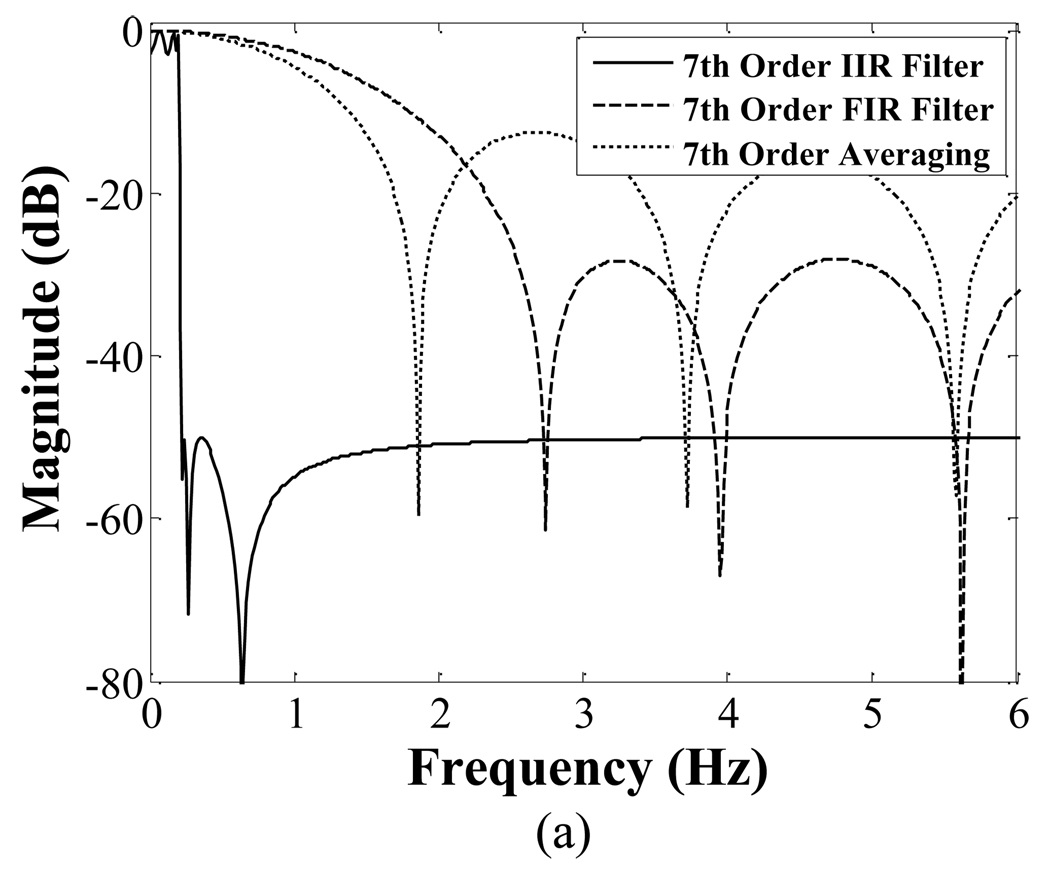
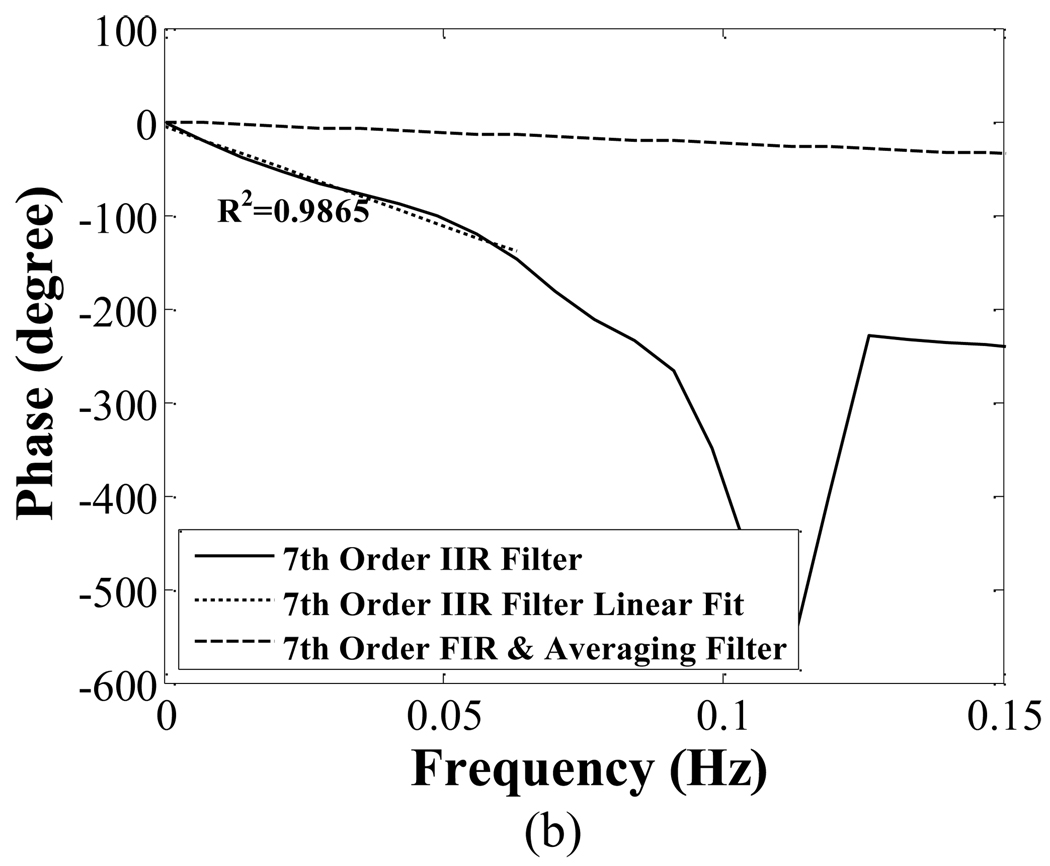
Fig. 5 compares the magnitude (a) and phase (b) response of 7th order IIR, FIR, and averaging filter together. The phase response of the FIR and averaging filters is linear for frequency components below 0.03 Hz; the slope is ~−4.03 rad/Hz. The elliptical low-pass filter has a nonlinear phase response near its cutoff frequency. However, for frequency components below 0.03 Hz, the phase response is approximately linear (R2=0.99).
Fig. 5.
Comparison of the magnitude responses (a) and phase response (b) of seventh order IIR, FIR and averaging filter. The FIR and averaging filters have a linear phase response. The phase response of the IIR is approximately linear in the critical frequency range of 0 to 0.03 Hz.
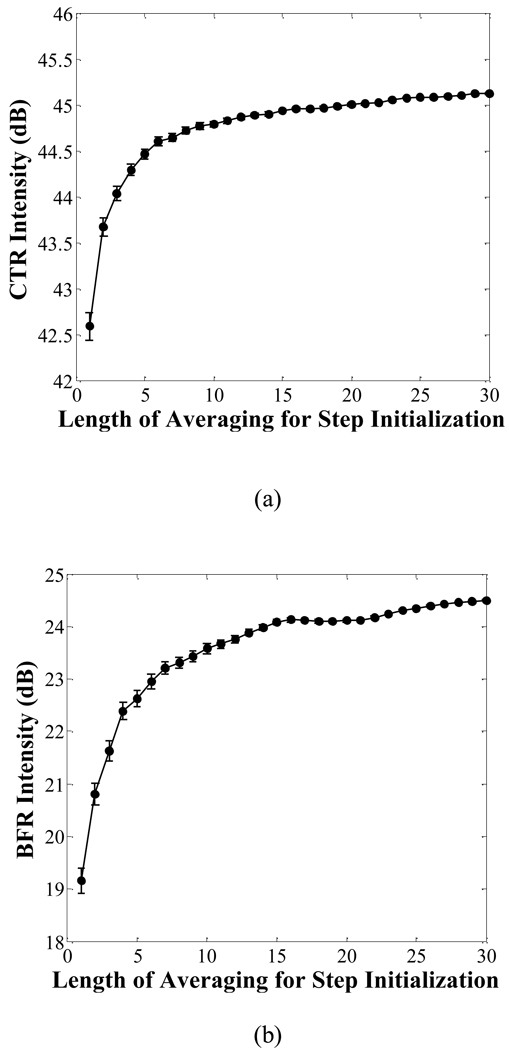
The initialization scheme for the IIR filter is critical to the slow-time filter design. In this study, we varied the number of sampling frames from which we calculated the mean values to perform the step initialization [33], and then compared their performance. The number of sampling frames was varied from 1 to 30, which was the total number of sampling frames. The initialization of the IIR filter was implemented by the MATLAB® (The MathWorks Inc., Natick, MA, USA) routine “filter”.
The PNP of the TLRH imaging pulse was varied within the range of 60 to 330 kPa to study the effect on targeted image quality. To evaluate the effect of the radiation force sequence on targeted microbubble binding, targeted images with and without radiation force were investigated.
To study of the quality of T1R7 and T7R7 images, the contrast-to-tissue ratio (CTR*, the star is used here to differentiate the non-targeted definition from the CTR definition in targeted images) is defined as:
| (1) |
where is the mean signal intensity in tissue based on T1R7 data; is the mean signal intensity of all microbubbles in the tube based on T1R7 data.
To study of the quality of targeted images in the phantom experiments, the contrast-to-tissue ratio (CTR) and the bound-to-free microbubble ratio (BFR) are defined. The CTR is defined to quantify the relative signal intensity of bound microbubbles and tissue for T1R7 targeted imaging; the BFR is defined to quantify the relative signal intensity of bound and free microbubbles for T1R7 targeted imaging. CTR and BFR are calculated by:
| (2) |
where using the T1R7 targeted imaging data, Ītissue is the mean signal intensity in tissue; Īfree is the mean signal intensity of free microbubbles; Ībound is the mean signal intensity of bound microbubbles. In each case, an operator-designed region of interest is used to differentiate regions of bound plus free microbubbles, bound or free microbubbles and tissue to study these parameters.
The RF data were processed off-line in MATLAB.
III. RESULTS
A. Frequency-dependent transient response
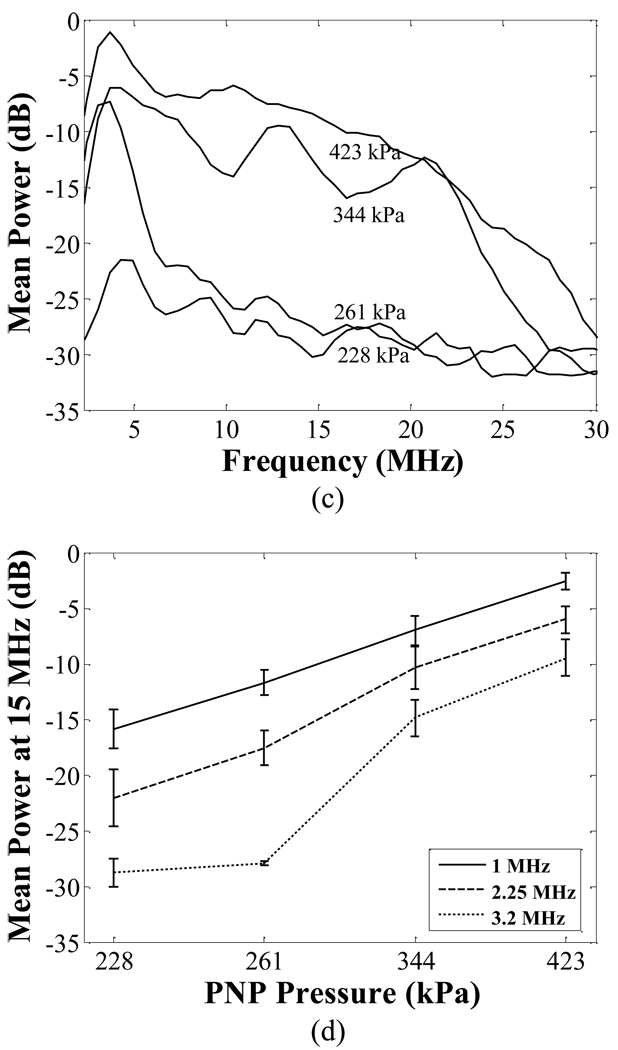
The bandwidth of the transient response increases with decreasing transmitted center frequency (Fig. 6). Since we plan to combine thermal therapy and targeted imaging together in the future, 1.5 MHz was chosen for the center frequency of the transmitted imaging pulse in the implementation of our combined imaging and therapy array. In this array, the 5.4 MHz center array receives the microbubble echoes and applies radiation force.
Fig. 6.
The power spectra of transient responses generated by 1 MHz (a), 2.25 MHz (b), and 3.2 MHz (c) transmitted pulses. The relative mean spectral power at 15 MHz with varied PNP is plotted in (d).
B. Linear and TLRH image
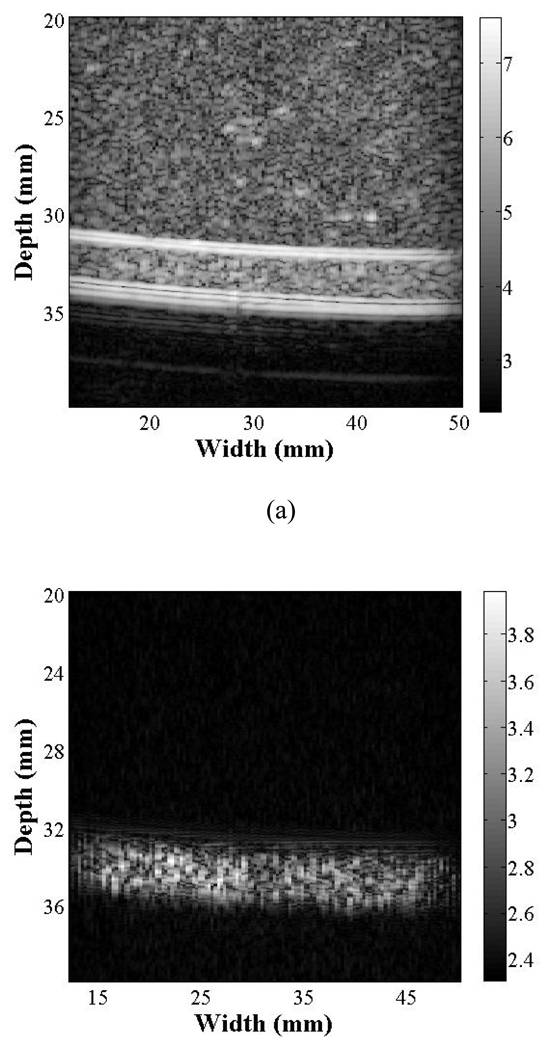
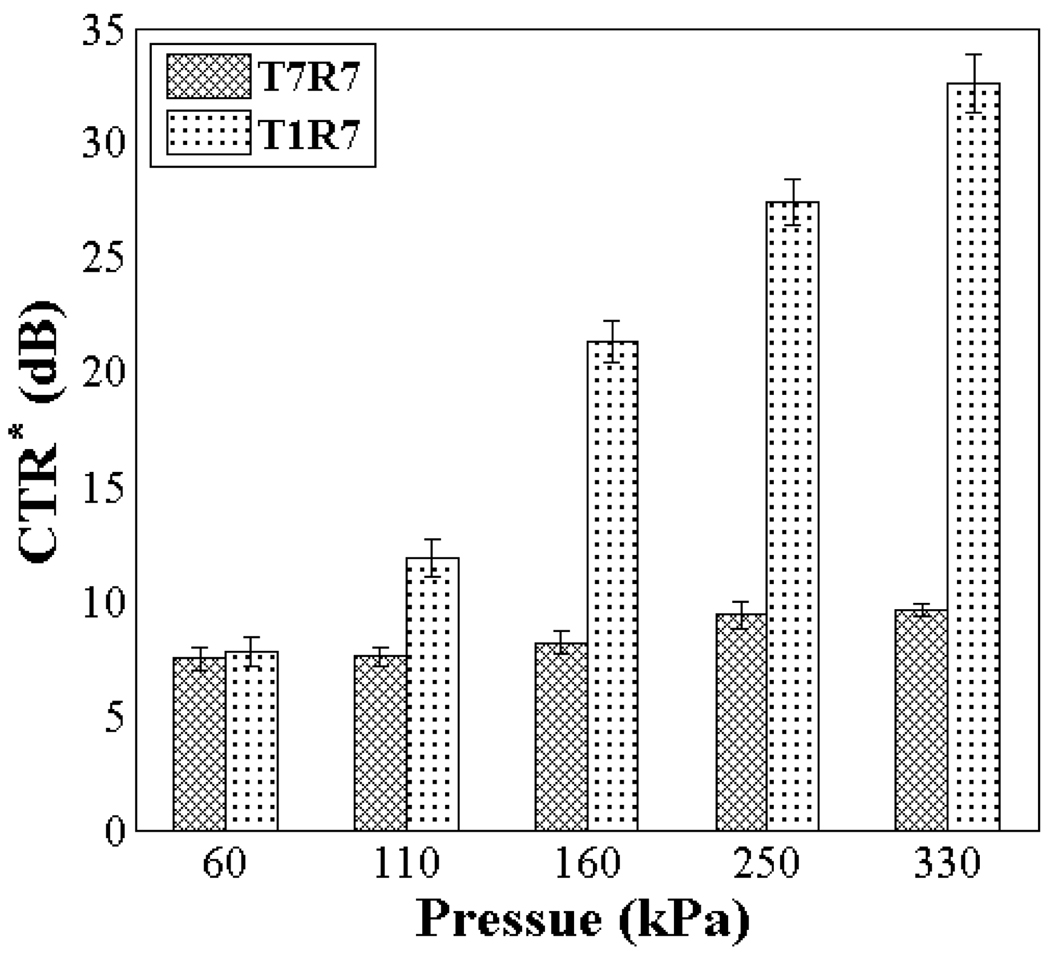
To directly compare T1R7 and T7R7 for tissue echo rejection, images of the flow phantom generated using T7R7 (CTR* of 9 dB) and T1R7 (CTR* of 28 dB) are shown (Fig. 7). The CTR* is then compared as a function of the transmitted PNP of the imaging pulse (Fig. 8), where T1R7 generated a higher CTR* image than T7R7 with an imaging pulse PNP ranging from 60 kPa to 330 kPa. The CTR* of T1R7 and T7R7 peaked at 34 and 10 dB, respectively. Thus, increasing incident acoustic pressure increases the ability to differentiate microbubbles from surrounding tissue.
Fig. 7.
T7R7 (a) and T1R7 (b) images of control (non-targeted) microbubbles flowing through the flow phantom with an imaging pulse PNP of 250 kPa. The displayed grayscale ranges from the noise floor (~ equal in each case) to the peak post-filtered amplitude and the resulting dynamic range (DR) is ~70 dB for T7R7 and ~40dB for T1R7.
Fig. 8.
Comparison of the CTR* obtained from T7R7 and T1R7 imaging with a varied imaging pulse PNP from 60 to 330 kPa.
C. Performance of slow- time filter
The number of sampling frames used to obtain step initialization values affects the performance of the IIR slow-time filter. For example, using the seventh-order IIR filter, a 2.5 dB increase in CTR and a 5.3 dB increase in BFR are observed when the data upon which the initialization value is based are averaged over 30 sampling frames, as compared to a single sample frame (Fig. 9).
Fig. 9.
Comparison of the performance (CTR and BFR) of a seventh-order IIR filter using a step initialization value with a mean value estimated by the average value over 1 to 30 sampling frames. The PNP of the imaging pulse is 250 kPa.
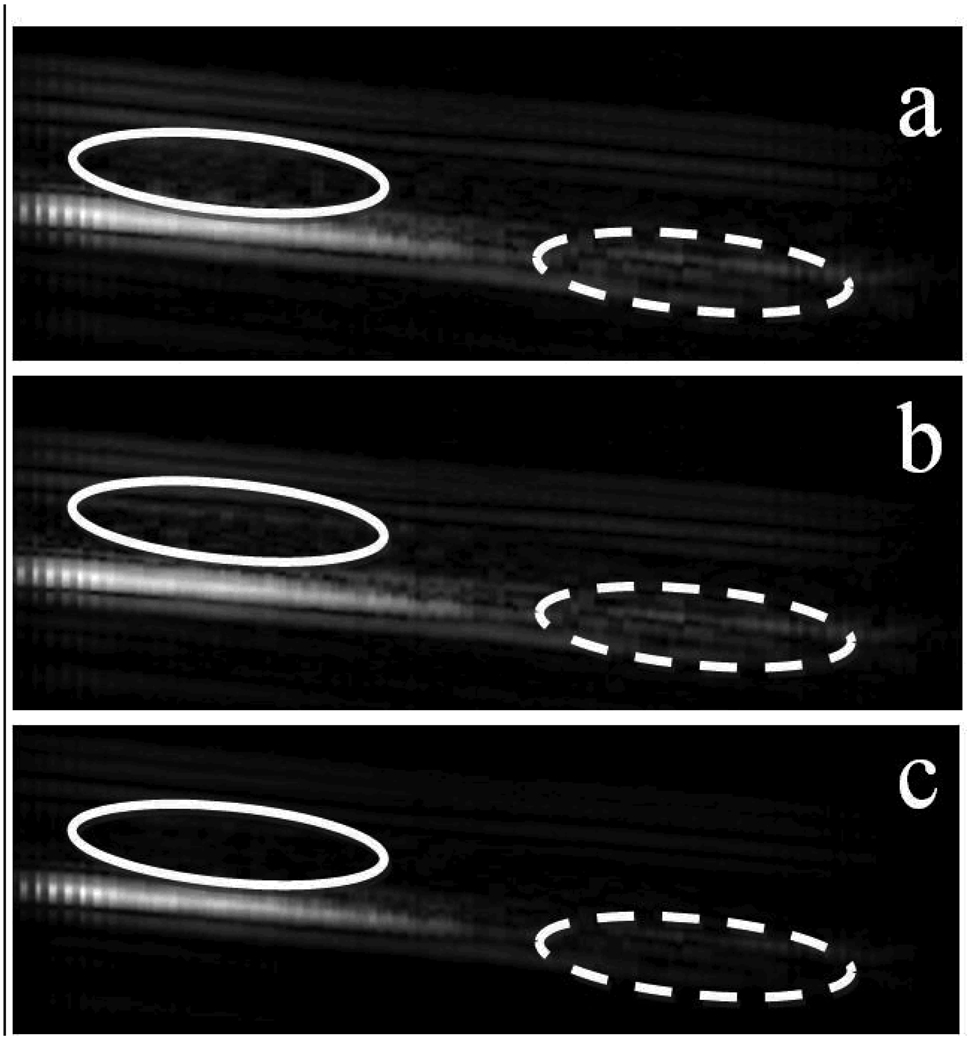
Fig. 10 provides an example of targeted images obtained by applying a seventh-order averaging filter, FIR filter and IIR filter to the T1R7 images. The slow-time filter should suppress the echoes from free microbubbles, while retaining the echoes from bound microbubbles.
Fig. 10.
Targeted images generated by the FIR filter (a), averaging filter (b) and IIR filter (c) are compared. The greatest differences among them are the signal intensity in the free microbubble region circled by the solid ellipse and the tube wall region circled by the dashed ellipse. The PNP of the imaging pulse is 250 kPa.
All three filters generated similar signal intensity in the region where microbubbles were bound. However, the averaging filter and FIR filter generated stronger signal intensity in the free microbubble and tube wall region compared to that produced by the IIR filter.
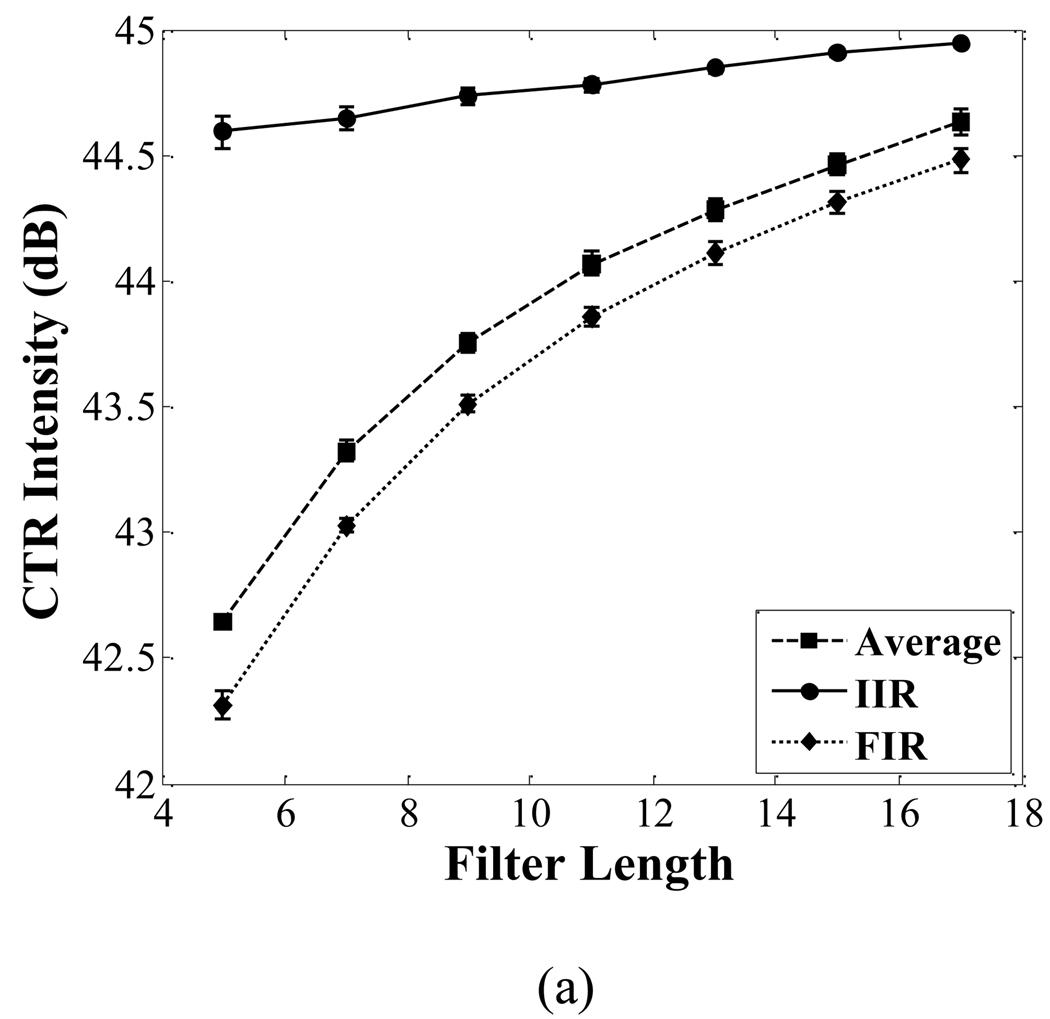
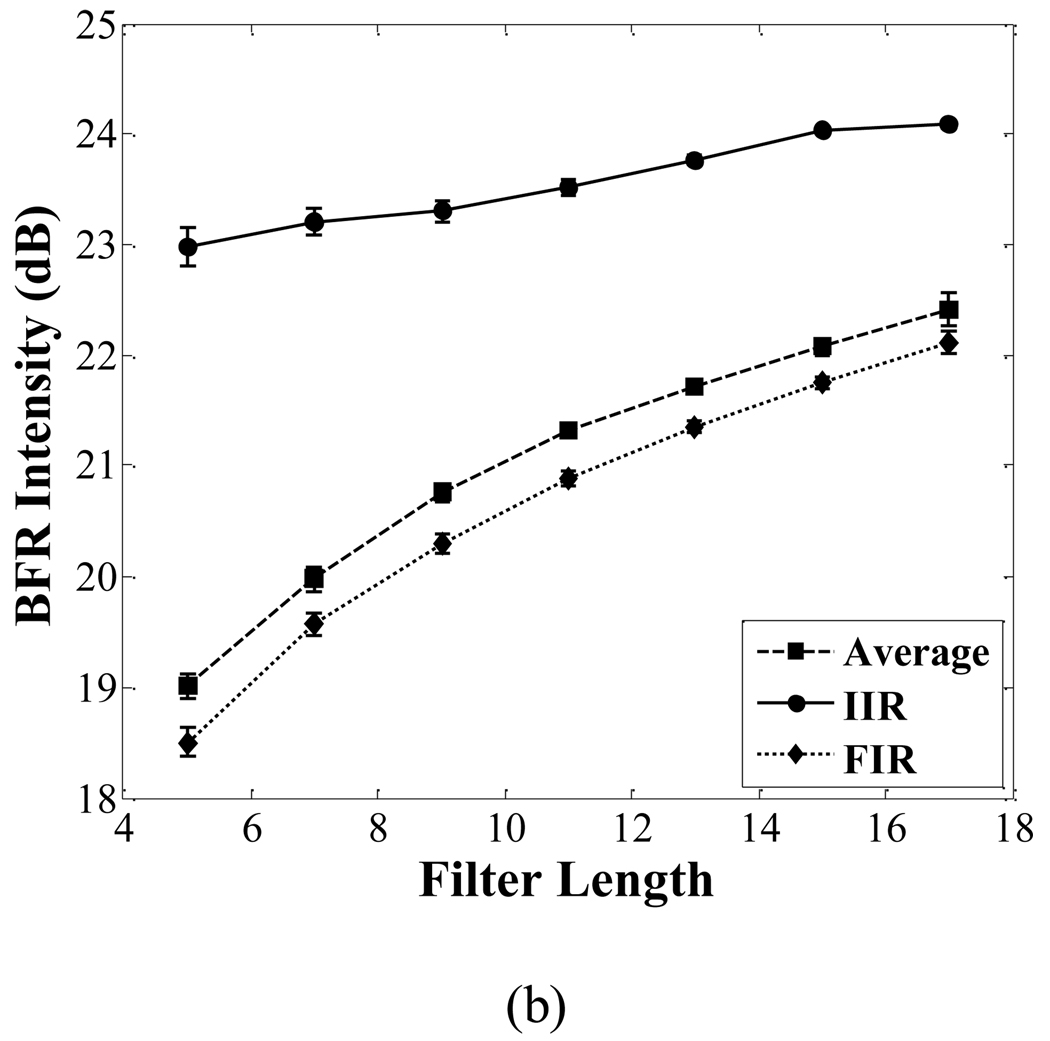
The CTR and BFR of images corresponding to the averaging filter, FIR filter and IIR filter are shown in Fig. 11. The CTR of the IIR filter is 1 dB higher than that of the other two filters when the filter order is 7. The BFR of the IIR filter is 2.6 dB higher than that of the other two filters when the filter order is 7.
Fig. 11.
Comparison of the CTR (a) and BFR (b) among the averaging filter, FIR filter and IIR filter. With increasing filter order, both the CTR and BFR in each filter increase. The PNP of the imaging pulse is 250 kPa.
D. Effect of radiation force and imaging pulse PNP
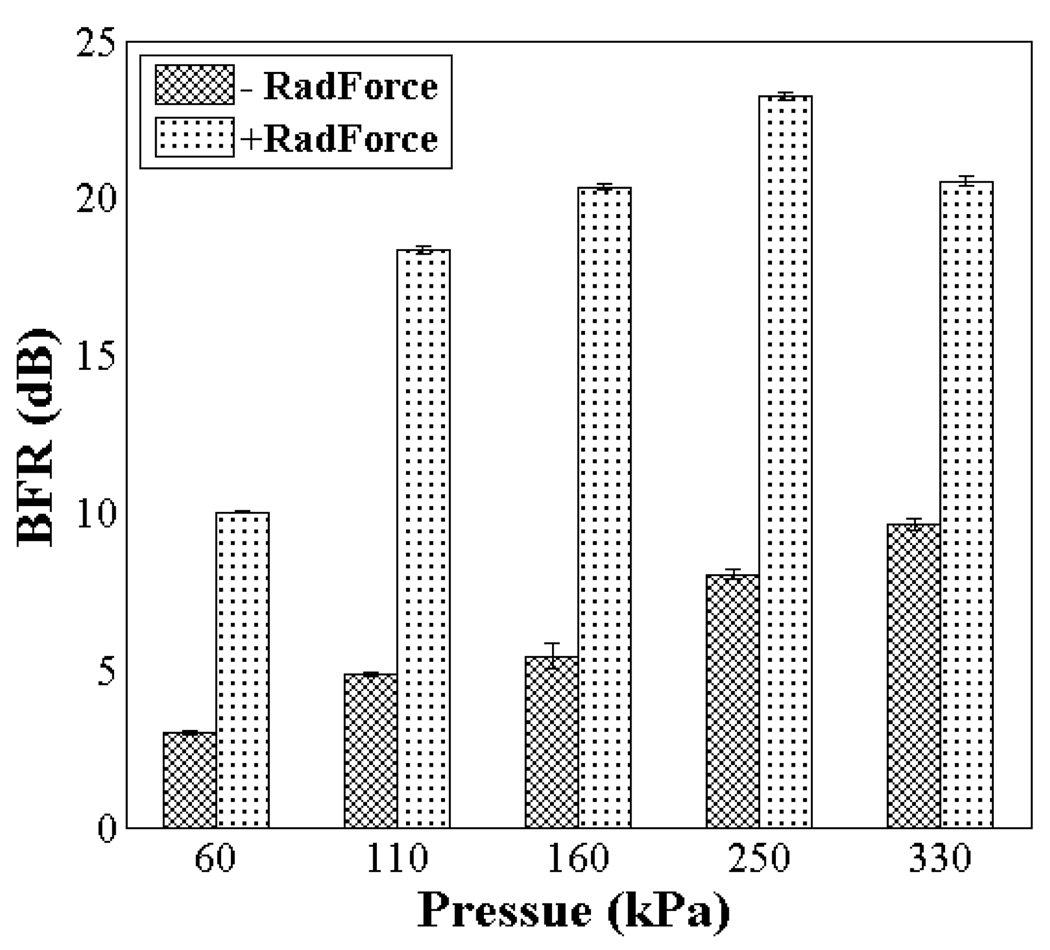
For imaging pulses with PNP from 60 to 330 kPa, the application of radiation force increases the BFR by 7 to 15 dB as compared with targeted images obtained without radiation force (Fig. 12). When no radiation force sub-sequence is applied, the increase in BFR with imaging pulse PNP is the result of increased radiation force effect produced by the 1.5 MHz T1R7 imaging pulses. However, the 1.5 MHz transmitting pulses used for T1R7 imaging are less efficient than the 5.4 MHz pulses in producing radiation [34]. When the radiation force sub-sequence is applied, as the transmitted PNP of the imaging pulse increases, the BFR also increases, reaching a maximum value (highest sensitivity) of 23 dB at an imaging pulse PNP of 250 kPa; however, a further increase in the imaging pulse PNP, up to 330 kPa, results in a 3dB decrease in BFR.
Fig. 12.
BFR of the targeted images obtained with radiation force sub-sequence (+RadForce) and without radiation force sub-sequence (−RadForce) for a varied imaging pulse PNP ranging from 60 kPa to 330 kPa. The PNP of the radiation force pulse is 200 kPa.
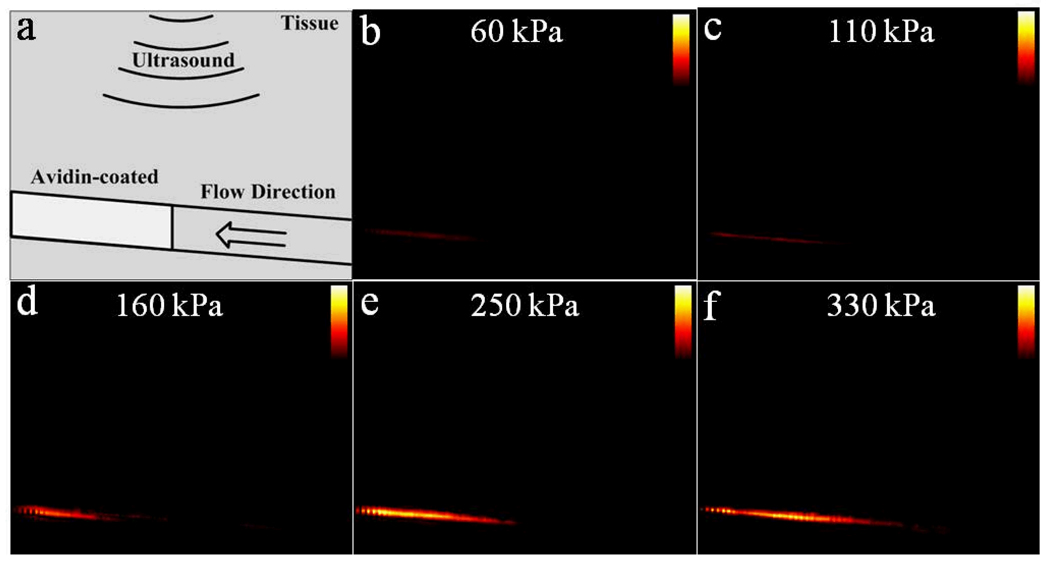
Fig. 13 provides a series of TLRH targeted images in color obtained as the PNP of the imaging pulse increases from 60 to 330kPa, using a seventh-order elliptic IIR filter as the slow-time filter and with a constant dynamic range of 40 dB. Avidin was coated only on the downstream section of the tube, which was identically coated and placed in each study (as indicated in the cartoon). Bound microbubbles, as detected by the algorithms summarized in Fig. 4, are colored in orange and overlaid on the grey scale images. The resulting TLRH targeted images indicate that bound microbubbles were adherent only in the avidin-coated area (Fig. 13 b–f). Bound microbubbles are not detected in the upstream section, which lacks the avidin coating. Since acoustic radiation force deflects bubbles from the upper tube wall to the lower tube wall, targeted microbubbles accumulate on the bottom wall, as shown in the TLRH targeted images. The region of bound microbubbles coincides with the location of the avidin coating; although, the echogenicity of the coated wall is unchanged in the absence of microbubbles.
Fig. 13.
A diagram of the TLRH targeted images. Phantom structure (a) and corresponding TLRH targeted (40 dB dynamic range) images obtained with a varied imaging pulse PNP from 60 kPa to 330 kPa are shown (b)–(f).
IV. DISCUSSION
The TLRH targeted imaging method, as demonstrated on a clinical ultrasound system, is useful in detecting microbubbles and distinguishing bound and free microbubbles. The method in this study should be practical for detecting and imaging ultrasound microbubbles that bind to specific vascular surface receptors. Based on the transient response of microbubbles, the proposed method takes advantage of TLRH imaging for microbubble detection, enhancing the rejection of tissue echoes and associated harmonics. Other advantages demonstrated previously include higher sensitivity and penetration depth and better axial resolution than THRH [20].
As shown in Fig. 6, the transient response of microbubbles is highly dependent on the transmitted frequency and PNP of the imaging pulse. In general, lower frequency and higher PNP excitation pulses generate a greater transient response. For example, the mean received power from 1 MHz-driven microbubbles within a frequency range of 6–8 MHz increased 10 dB as the imaging pulse PNP was increased from 228 kPa to 423 kPa. Increasing the imaging pulse PNP increases microbubble destruction; however, bound microbubbles tolerate a greater PNP. Here, the range between 228 to 423 kPa was useful for targeted imaging.
The use of lower transmitted frequencies can minimize the interference between the second or third harmonics generated by the surrounding tissue and the specific transient response of microbubbles. With our system and a transmitted PNP of 423 kPa, the −6dB transient response of microbubbles extended to 20 MHz and 15 MHz by transmitting with a 1 and 2.25 MHz center frequencies, respectively (Fig. 6 a, b). The third harmonic component produced by the surrounding tissue with these transmitted frequencies is 3 MHz and 6.75 MHz, respectively. This implies a broadband receiver can separate harmonic tissue and bubble echoes. Increasing the center frequency of the transmitted pulse degrades this separation, as we have illustrated in Fig. 6 (c) for the 3.2MHz transmission case.
A seventh-order elliptic IIR filter was shown to have the best performance in the detection of bound microbubbles, as compared with the averaging and FIR filter. In order to observe the effect of the slow-time filter’s filter order, we compared the performance of targeted imaging with filter orders varied from 5 to 17. The CTR and BFR values derived with different filters depend on the stop-band cutoff frequency and transition bandwidth. Among the FIR, averaging and elliptical IIR filter, the elliptical IIR filter achieved the required signal suppression with the smallest filter order. The differences in CTR and BFR between the 7th and 17th order IIR filter are minimal, less than 1 dB. Longer slow-time filters require more frames to obtain the initialization value and filter, which can increase motion artifacts in the slow-time direction, in turn affecting the accuracy of the filter initialization. In our study, the frame rate was set to 5 frames/s, therefore the total acquisition time for the 7th order filter was ~1.2 seconds. Low frequency artifacts produced by respiration and other physiological noise sources can be minimized by applying 2D motion correction. The sum absolute difference (SAD) algorithm has been shown to be effective in minimizing motion artifacts in ultrasound imaging, and shows promise for targeted imaging as well (data not shown). Moreover, the radiation force sub-sequence can induce immediate microbubble adhesion and enhance targeted imaging sensitivity (Fig. 12).
The slow-time low-pass filter and radiation force based targeted imaging can be integrated with other ultrasound contrast imaging techniques such as contrast pulse sequence (CPS) and PI.
Initial experiments indicated optimal results (highest signal to noise) when the radiation force sequence PNP was 200 kPa, which agrees with our previous in vivo studies [35]. It is likely that some microbubble destruction occurs.
There are a number of limitations in this in vitro targeted imaging study. To insure the effectiveness of the targeted imaging technique in differentiating bound and free microbubbles within a single vessel, the ultrasound system should have an axial resolution smaller than the vessel diameter. However, targeted imaging of capillary networks is frequently desirable and does not require that the individual vessels are resolved. Our multi-array probe center row is currently capable of receiving echoes in the 7 MHz range, but higher frequency capability is desirable for superficial applications. We have extended our methods to create a transducer with a 2 MHz frequency for the outer rows and 9 MHz center frequency for the inner rows. We expect that this combination can improve both the imaging resolution and tissue clutter rejection; we are in the process of testing this device.
Because of the configuration of the outer arrays, the ROI of the transmitted acoustic field is limited to a focal zone of ~2 mm in the elevation direction, which is ~35 mm away from the surface of the transducer. Future transducers will likely use a single wideband array for transmission and reception or arrays with overlapping apertures.
The use of the cellulose tube as vessel-mimicking material is an additional limitation of this study; phantom materials cannot exactly mimic the vessel wall. We did not test the resolution of the targeted imaging method in this study. New in vitro phantoms with multiple cellulose tubes will be used to explore resolution in future studies. Finally, the avidin-biotin bond is one of the strongest receptor ligand interactions; other targeting schemes may not be capable of an equivalent targeting efficiency.
V. CONCLUSION
Here, we have customized a wideband imaging strategy for use in ultrasound molecular imaging by employing new imaging arrays integrated with a clinical ultrasound scanner. Combining transmission at a low ultrasound frequency, broadband echo reception and an acoustic radiation force sub-sequence increased the targeting efficacy and the contrast-to-tissue ratio of the resulting targeted images. The maximum contrast-to-tissue ratio of 34 dB was achieved with transmission of 1.5 MHz and reception with a center frequency near 7 MHz. Following a band-pass filter operating on the radiofrequency echoes, a slow-time frame-to-frame filter was used to distinguish the echoes from bound and free microbubbles. A seventh-order elliptic low-pass IIR filter maximized the bound-to-free ratio achieved, with a ratio of 23 dB generated with a imaging pulse PNP of 250 kPa. Altogether, the work indicates that wider bandwidth arrays and signal processing, together with acoustic-radiation-force microbubble deflection, can enhance real-time high-sensitivity ultrasound molecular imaging.
ACKNOWLEDGEMENTS
The authors appreciate Drs. Paul Dayton, Shukui Zhao and Azadeh Kheirolomoom for assistance and valuable discussion. This work is supported by NIH CA 103828, CA 112356 and CA 76062.
APPENDIX
Pseudo code
Generate Fast_Time_Filter band-pass filter;
For Frame = 1:Total_Frame_Numb
      For Scan_Line = 1:Total_Scan_Line
            Fast_Time_Filter is applied to RF data in each scan line in each
            frame;
      End
End
Generate Slow_Time_Filter low-pass filter (with Filter_Order,
Stop_Band_Ripple, Pass_Band_Ripple and Filter_Cut_Off_Frequency);
Initialize the Slow_Time_Filter and cache the initialization value;
for Line = 1:Total_Line_Numb_in_One_Frame
    for Column = 1:Total_Column_Numb_in_One_Frame
            Calculate the mean value in slow time;
            Slow_Time_Filter is initialized and applied;
            Threshold is applied;
    end
end
Envelop_Detection and Log_Compress;
Generate color image;
REFERENCES
- 1.Jaffer FA, Weissleder R. Seeing within: molecular imaging of the cardiovascular system. Circ Res. 2004 Mar 5;vol. 94:433–445. doi: 10.1161/01.RES.0000119321.18573.5A. [DOI] [PubMed] [Google Scholar]
- 2.Massoud TF, Gambhir SS. Molecular imaging in living subjects: seeing fundamental biological processes in a new light. Genes Dev. 2003 Mar 1;vol. 17:545–580. doi: 10.1101/gad.1047403. [DOI] [PubMed] [Google Scholar]
- 3.Lanza GM, Trousil R, Hall CS, Rose JH, Wallace KD, Scott MJ, Miller JG, Gaffney PJ, Wickline SA. A simple theoretical model for the unexpected acoustic enhancement of thrombi effected by a novel, liquid, fibrin targeted contrast system. Circulation. 1997 OCT 21;vol. 96:2558–2558. [Google Scholar]
- 4.Yu X, Song SK, Chen JJ, Scott MJ, Fuhrhop RJ, Hall CS, Gaffney PJ, Wickline SA, Lanza GM. High-resolution MRI characterization of human thrombus using a novel fibrin-targeted paramagnetic nanoparticle contrast agent. Magnetic Resonance in Medicine. 2000 DEC;vol. 44:867–872. doi: 10.1002/1522-2594(200012)44:6<867::aid-mrm7>3.0.co;2-p. [DOI] [PubMed] [Google Scholar]
- 5.Lankford M, Behm CZ, Yeh J, Klibanov AL, Robinson P, Lindner JR. Effect of microbubble ligation to cells on ultrasound signal enhancement: implications for targeted imaging. Invest Radiol. 2006 Oct;vol. 41:721–728. doi: 10.1097/01.rli.0000236825.72344.a9. [DOI] [PubMed] [Google Scholar]
- 6.Leong-Poi H, Christiansen J, Heppner P, Lewis CW, Klibanov AL, Kaul S, Lindner JR. Assessment of endogenous and therapeutic arteriogenesis by contrast ultrasound molecular imaging of integrin expression. Circulation. 2005 Jun 21;vol. 111:3248–3254. doi: 10.1161/CIRCULATIONAHA.104.481515. [DOI] [PubMed] [Google Scholar]
- 7.Weller GE, Villanueva FS, Klibanov AL, Wagner WR. Modulating targeted adhesion of an ultrasound contrast agent to dysfunctional endothelium. Ann Biomed Eng. 2002 Sep;vol. 30:1012–1019. doi: 10.1114/1.1513565. [DOI] [PubMed] [Google Scholar]
- 8.Chomas JE, Pollard RE, Sadlowski AR, Griffey SM, Wisner ER, Ferrara KW. Contrast-enhanced US of microcirculation of superficially implanted tumors in rats. Radiology. 2003 Nov;vol. 229:439–446. doi: 10.1148/radiol.2292020536. [DOI] [PubMed] [Google Scholar]
- 9.Ellegala DB, Leong-Poi H, Carpenter JE, Klibanov AL, Kaul S, Shaffrey ME, Sklenar J, Lindner JR. Imaging tumor angiogenesis with contrast ultrasound and microbubbles targeted to alpha(v)beta3. Circulation. 2003 Jul 22;vol. 108:336–341. doi: 10.1161/01.CIR.0000080326.15367.0C. [DOI] [PubMed] [Google Scholar]
- 10.Weller GE, Wong MK, Modzelewski RA, Lu E, Klibanov AL, Wagner WR, Villanueva FS. Ultrasonic imaging of tumor angiogenesis using contrast microbubbles targeted via the tumor-binding peptide arginine-arginine-leucine. Cancer Res. 2005 Jan 15;vol. 65:533–539. [PubMed] [Google Scholar]
- 11.Bloch SH, Dayton PA, Ferrara KW. Targeted imaging using ultrasound contrast agents. Progess and opportunities for clinical and research applications. IEEE Eng Med Biol Mag. 2004 Sep–Oct;vol. 23:18–29. doi: 10.1109/memb.2004.1360405. [DOI] [PubMed] [Google Scholar]
- 12.Weller GE, Lu E, Csikari MM, Klibanov AL, Fischer D, Wagner WR, Villanueva FS. Ultrasound imaging of acute cardiac transplant rejection with microbubbles targeted to intercellular adhesion molecule-1. Circulation. 2003 Jul 15;vol. 108:218–224. doi: 10.1161/01.CIR.0000080287.74762.60. [DOI] [PubMed] [Google Scholar]
- 13.Rychak JJ, Klibanov AL, Hossack JA. Acoustic radiation force enhances targeted delivery of ultrasound contrast microbubbles: in vitro verification. IEEE Trans Ultrason Ferroelectr Freq Control. 2005 Mar;vol. 52:421–433. doi: 10.1109/tuffc.2005.1417264. [DOI] [PubMed] [Google Scholar]
- 14.Zhao S, Kruse DE, Ferrara KW, Dayton PA. Selective imaging of adherent targeted ultrasound contrast agents. Phys Med Biol. 2007 Apr 21;vol. 52:2055–2072. doi: 10.1088/0031-9155/52/8/002. [DOI] [PMC free article] [PubMed] [Google Scholar]
- 15.Dayton P, Klibanov A, Brandenburger G, Ferrara K. Acoustic radiation force in vivo: a mechanism to assist targeting of microbubbles. Ultrasound Med Biol. 1999 Oct;vol. 25:1195–1201. doi: 10.1016/s0301-5629(99)00062-9. [DOI] [PubMed] [Google Scholar]
- 16.Dayton PA, Allen JS, Ferrara KW. The magnitude of radiation force on ultrasound contrast agents. J Acoust Soc Am. 2002 Nov;vol. 112:2183–2192. doi: 10.1121/1.1509428. [DOI] [PubMed] [Google Scholar]
- 17.Zhao S, Borden M, Bloch SH, Kruse D, Ferrara KW, Dayton PA. Radiation-force assisted targeting facilitates ultrasonic molecular imaging. Mol Imaging. 2004 Jul;vol. 3:135–148. doi: 10.1162/1535350042380317. [DOI] [PMC free article] [PubMed] [Google Scholar]
- 18.Postema M, van Wamel A, Lancee CT, de Jong N. Ultrasound-induced encapsulated microbubble phenomena. Ultrasound Med Biol. 2004 Jun;vol. 30:827–840. doi: 10.1016/j.ultrasmedbio.2004.02.010. [DOI] [PubMed] [Google Scholar]
- 19.Dyson M, Woodward B, Pond JB. Flow of red blood cells stopped by ultrasound. Nature. 1971 Aug 20;vol. 232:572–573. doi: 10.1038/232572a0. [DOI] [PubMed] [Google Scholar]
- 20.Kruse DE, Ferrara KW. A new imaging strategy using wideband transient response of ultrasound contrast agents. IEEE Trans Ultrason Ferroelectr Freq Control. 2005 Aug;vol. 52:1320–1329. doi: 10.1109/tuffc.2005.1509790. [DOI] [PMC free article] [PubMed] [Google Scholar]
- 21.Matula TJ, Hallaj IM, Cleveland RO, Crum LA, Moss WC, Roy RA. The acoustic emissions from single-bubble sonoluminescence. Journal of the Acoustical Society of America. 1998 Mar;vol. 103:1377–1382. [Google Scholar]
- 22.Shi WT, Forsberg F, Tornes A, Ostensen J, Goldberg BB. Destruction of contrast microbubbles and the association with inertial cavitation. Ultrasound Med Biol. 2000 Jul;vol. 26:1009–1019. doi: 10.1016/s0301-5629(00)00223-4. [DOI] [PubMed] [Google Scholar]
- 23.Bauer A, Hauff P, Lazenby J, von Behren P, Zomack M, Reinhardt M, Schlief R. Wideband harmonic imaging: a novel contrast ultrasound imaging technique. Eur Radiol. 1999;vol. 9 Suppl 3:S364–S367. doi: 10.1007/pl00014075. [DOI] [PubMed] [Google Scholar]
- 24.Frinking PJ, Bouakaz A, Kirkhorn J, Ten Cate FJ, de Jong N. Ultrasound contrast imaging: current and new potential methods. Ultrasound Med Biol. 2000 Jul;vol. 26:965–975. doi: 10.1016/s0301-5629(00)00229-5. [DOI] [PubMed] [Google Scholar]
- 25.Deng CX, Lizzi FL. A review of physical phenomena associated with ultrasonic contrast agents and illustrative clinical applications. Ultrasound Med Biol. 2002 Mar;vol. 28:277–286. doi: 10.1016/s0301-5629(02)00475-1. [DOI] [PubMed] [Google Scholar]
- 26.Zheng H, Barker A, Shandas R. Predicting backscatter characteristics from micron- and submicron-scale ultrasound contrast agents using a size-integration technique. IEEE Trans Ultrason Ferroelectr Freq Control. 2006 Mar;vol. 53:639–644. doi: 10.1109/tuffc.2006.1610573. [DOI] [PubMed] [Google Scholar]
- 27.Ammi AY, Cleveland RO, Mamou J, Wang GI, Bridal SL, O'Brien WD., Jr Ultrasonic contrast agent shell rupture detected by inertial cavitation and rebound signals. IEEE Trans Ultrason Ferroelectr Freq Control. 2006 Jan;vol. 53:126–136. doi: 10.1109/tuffc.2006.1588398. [DOI] [PMC free article] [PubMed] [Google Scholar]
- 28.Stephens D, Lu X, Dayton P, Kruse D, Ferrara K. Multi-frequency array development for drug delivery therapies. IEEE Ultrasonics Symposium. 2006:66–69. [Google Scholar]
- 29.Stephens DN, Kruse DE, Ergun AS, Barnes S, Lu XM, Ferrara KW. Efficient array design for sonotherapy. Phys Med Biol. 2008 Jul 21;vol. 53:3943–3969. doi: 10.1088/0031-9155/53/14/014. [DOI] [PMC free article] [PubMed] [Google Scholar]
- 30.Sun Y, Kruse DE, Ferrara KW. Contrast imaging with chirped excitation. IEEE Trans Ultrason Ferroelectr Freq Control. 2007 Mar;vol. 54:520–529. doi: 10.1109/tuffc.2007.275. [DOI] [PubMed] [Google Scholar]
- 31.Borden MA, Kruse DE, Caskey CF, Zhao S, Dayton PA, Ferrara KW. Influence of lipid shell physicochemical properties on ultrasound-induced microbubble destruction. IEEE Trans Ultrason Ferroelectr Freq Control. 2005 Nov;vol. 52:1992–2002. doi: 10.1109/tuffc.2005.1561668. [DOI] [PMC free article] [PubMed] [Google Scholar]
- 32.Smith ML, Smith MJ, Lawrence MB, Ley K. Viscosity-independent velocity of neutrophils rolling on p-selectin in vitro or in vivo. Microcirculation. 2002 Dec;vol. 9:523–536. doi: 10.1038/sj.mn.7800165. [DOI] [PubMed] [Google Scholar]
- 33.Kadi AP, Loupas T. On the performance of regression and step-initialized IIR clutter filters for color doppler systems in diagnostic medical ultrasound. IEEE Trans Ultrason Ferroelectr Freq Control. 1995;vol. 42:927–937. [Google Scholar]
- 34.Shortencarier MJ, Dayton PA, Bloch SH, Schumann PA, Matsunaga TO, Ferrara KW. A method for radiation-force localized drug delivery using gas-filled lipospheres. IEEE Trans Ultrason Ferroelectr Freq Control. 2004 Jul;vol. 51:822–831. doi: 10.1109/tuffc.2004.1320741. [DOI] [PubMed] [Google Scholar]
- 35.Tartis MS, Kruse DE, Zheng H, Zhang H, Kheirolomoom A, Marik J, Ferrara KW. Dynamic microPET imaging of ultrasound contrast agents and lipid delivery. J Control Release. 2008 Nov 12;vol. 131:160–166. doi: 10.1016/j.jconrel.2008.07.030. [DOI] [PMC free article] [PubMed] [Google Scholar]


