

Abstract
Retinitis pigmentosa can be followed over almost its entire course with narrow bandpassed computer averaged cone electroretinograms (ERGs). The long-term rate of decline of these responses can be described by an exponential function. A cone ERG actuarial table based on 1039 patients and 6553 visits is presented to show the estimated number of years for an average patient with a given 30-Hz cone ERG amplitude to decline to 0.05 μV (i.e. virtual blindness). The table is based on a projected rate of loss of 10% of remaining cone ERG amplitude per year for those not on treatment and 8.3% per year for those on treatment with vitamin A palmitate 15,000 IU/day. The table can be used to provide an estimate of the average long-term visual prognosis from a single visit; more precise estimates for a specific patient require several additional visits over 2- to 3-year intervals. Evidence is presented to support the idea that patients with a projected cone amplitude of 3.5 μV or greater at age 40 (about 25% of our patient population with typical retinitis pigmentosa) would be expected, on average, to retain some useful vision for their entire lives without treatment. Knowledge of the amount of remaining cone function in the ERG often reduces patient anxiety and helps patients plan for their future.
Keywords: Retinitis pigmentosa, Retinal degeneration, Retina, Cones, Electroretinogram, Vitamin A, Genetic disease, Night blindness
It is an honor to receive the Ludwig von Sallmann Prize and a privilege to deliver this lecture in his memory. Dr. Ludwig von Sallmann was an internationally recognized leader in ophthalmic research. From my perspective one of his major contributions was the creation of a program on hereditary retinal diseases in the mid-1950s soon after he became Director of the Ophthalmology Branch of the National Institute of Neurological Diseases and Blindness. He and his colleagues established a clinic for patients with these diseases and developed a research program to understand the causes of these conditions and seek means for treatment. From 1966 to 1968, I examined patients directly under his supervision and studied the applications of electroretinographic testing in the early detection of these conditions, in particular retinitis pigmentosa.
The Ganzfeld or full-field stimulus system for clinical ERG testing was first introduced in the Ophthalmology Branch of the National Institutes of Health. With this system a light source on top of a dome illuminates its inner surface through a diffuser thereby presenting a fairly homogeneous stimulus across the retina. Responses are recorded with a bipolar Burian-Allen contact lens electrode placed on the topically anesthetized cornea and a ground electrode on the subject’s forearm or forehead (Figure 1). With full-field stimulation, ERG responses are remarkably reproducible to successive flashes of light even in patients who may have slight changes in head or eye position during testing (Gouras, 1970; Rabin and Berson, 1974).
Figure 1.
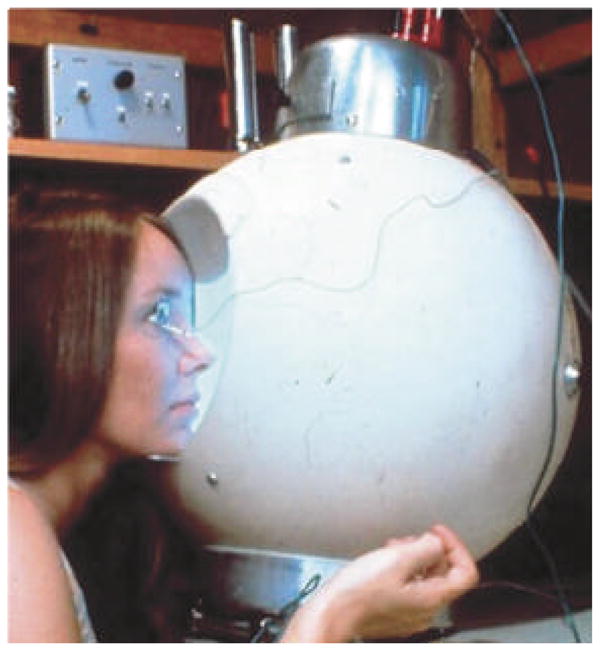
Full-field (Ganzfeld) system in use for ERG testing. Stroboscope light (Grass PS2), enclosed in a case and attached to the top of top of diffusing sphere, illuminates the inner white surface of this dome, 40cm in diameter, providing a full-field stimulus. (From Rabin and Berson, 1974).
Full-field rod responses to single flashes of dim blue light, mixed cone plus rod responses to single flashes of white light, and cone-isolated responses to 30-Hz white flicker are illustrated from a normal subject in the top row and from four children with early stages of progressive forms of retinitis pigmentosa in the bottom four rows (Figure 2). For each test condition, two or three consecutive sweeps are displayed. The affected children show responses that are not only reduced in amplitude but also delayed in peak implicit times (i.e. the time interval between stimulus flash onset and the major cornea-positive peak of the corresponding rod or cone response). The 30-Hz flicker ERGs shown in the right column are so delayed in some cases that each stimulus, designated by a vertical shock artifact, elicits the next-plus-one response (Berson, 1976).
Figure 2.
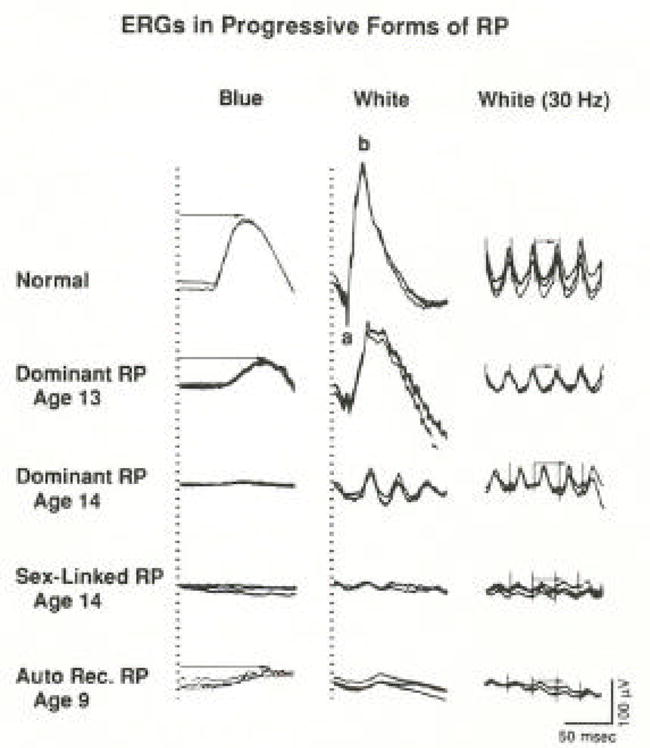
Full-field ERG responses from a normal subject and from four patients with retinitis pigmentosa. Stimulus onset is vertical hatched lines for columns 1 and 2 and vertical shock artifacts for column 3. Rod b-wave implicit times in column 1 and cone implicit times in column 3 are designated with arrows. Calibration symbol (lower right corner) signifies 50 msec horizontally and 100 μV vertically for all tracings. Under these test conditions, normal amplitudes are ≥ 100 μV (left column), ≥350 μV (middle column), and ≥50 μV (right column). Normal rod implicit time is ≤108 msec and normal cone implicit time is ≤32 msec. (From Berson, 1976.)
Full-field ERGs in self-limited or stationary retinal diseases are also reduced in amplitude, but the implicit times are normal (Figure 3). A father and son with sector retinitis pigmentosa have visible disease only in part of the fundus. They have comparable amplitudes even though they are separated in age by almost 30 years. As shown in the bottom two rows, patients with stationary forms of night blindness have abnormal ERG wave forms but have normal cone implicit times. Therefore ERG testing has made it possible to distinguish patients with self-limited or stationary diseases with normal implicit times from patients with progressive retinitis pigmentosa who have delayed implicit times (Berson, 1976).
Figure 3.
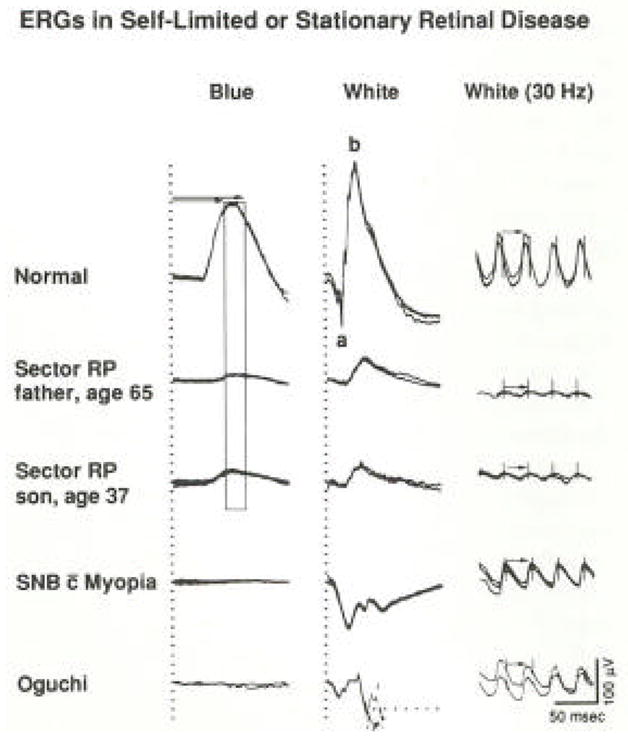
Full-field ERG responses from a normal subject and four patients with self-limited sector retinitis pigmentosa or stationary forms of night blindness. Horizontal arrows (column 1) designate range of normal rod b-wave implicit times, and vertical bar defining this range (mean ± 2 SD) has been extended through responses of patients with sector retinitis pigmentosa. Responses (middle column) from patient with Oguchi’s disease are interrupted by reflex blinking, so latter part cannot be illustrated. Cone implicit times in column 3 are designated with arrows. (From Berson, 1976.)
Although we have long been able to identify patients with progressive forms of retinitis pigmentosa, considerable uncertainty exists about the long-term visual prognoses in these patients. It is known that some patients with retinitis pigmentosa become virtually blind by age 30 while others retain useful vision until age 80 or beyond. Considerable variability can exist in the severity of disease at a given age even among patients within the same family. Rates of decline in retinal function based on longitudinal studies have been reported only for a few subtypes. Therefore ophthalmologists usually inform patients that their condition is probably slowly progressive and that the final rate remains to be determined. Some patients report that their ophthalmologist has told them that they may see for 10 years or 40 years and, given the uncertainty, perhaps they should learn Braille. This uncertainty creates anxiety and prompts many patients to seek any “treatment” regardless of whether or not it has a scientific basis.
By way of background, retinitis pigmentosa has a prevalence of about 1 in 4000; about two million people are affected worldwide. The condition is most often inherited by an autosomal dominant, autosomal recessive, or X-linked mode (Berson, 1993). About 20% of patients have an associated hearing loss and the combination is called Usher syndrome. More than 45 causative genes have been discovered, the most common being the rhodopsin, Usher 2A, and retinitis pigmentosa GTPase regulator (RPGR) genes, each accounting for about 10% of all cases (Hartong et al., 2006). Patients typically develop difficulty with adaptation and night blindness in adolescence, lose mid-peripheral and then far peripheral visual field in young adulthood, develop tunnel vision and eventually lose central vision as well. In the early stages the fundus may appear normal or nearly normal. In more advanced stages patients show retinal arteriolar attenuation, bone spicule pigmentation around the periphery in most cases, and waxy pallor of the optic discs. Patients with typical forms of retinitis pigmentosa have elevated final dark adaptation thresholds across the retina and reduced and delayed full-field ERGs in childhood sometimes years to a decade before symptoms develop or diagnostic abnormalities can be seen in the fundus.
Full-field ERGs from four patients with retinitis pigmentosa recorded at a 10-year interval show that the responses become smaller as the condition becomes more advanced (Figure 4). The patient illustrated on the lower left has detectable responses at age 17 but, as shown on the lower right, has non-detectable or flat ERGs at age 26 (Berson et al., 1979). These responses were obtained with conventional recording techniques without narrow bandpassed filtering or computer averaging, and the lower limit of sensitivity is about 10 μV. Despite flat ERGs at age 26, the patient on the lower right still retains 20/20 vision and fairly full visual fields, leading to the illusion that the ERG is not related to vision.
Figure 4.
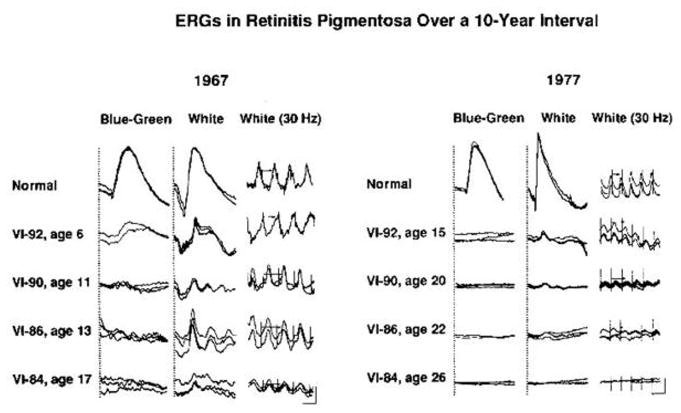
Full-field ERG responses recorded in 1967 and 1977 from a normal subject and from four affected members of a family with a dominant form of retinitis pigmentosa. Pedigree number and age at time of testing are indicated for each patient. One to three responses to the same stimulus are represented. Calibration symbol for 1967 responses designates 50 msec horizontally for columns 1 and 2 and 25 msec for column 3 and 50 μV vertically for column 1 and 100 μV vertically for columns 2 and 3. Calibration symbol for 1977 responses designates 60 msec horizontally and 100 μV vertically for all tracings. (From Berson and Simonoff, 1979.)
Representative full-field cone ERGs are shown for a normal subject and four patients with retinitis pigmentosa tested at an 11- to 15-year interval (Figure 5). Conventional responses (left column) obtained without narrow bandpassed filtering and computer averaging become flat or non-detectable in young adulthood (i.e. < 10 μV). However, with narrow bandpassed filtering and computer averaging that extend the range of detectability almost 100 fold from 10 μV to 0.05 μV (right column), these patients with remaining vision have detectable cone responses (Andreasson et al., 1988). Although their responses, ranging from 2.3 μV to 0.8 μV, are well below our lower norm of 50 μV, they retain visual self-sufficiency, such as the ability to walk out of a well-lighted room without assistance. In our experience loss of visual self-sufficiency (i.e. virtual blindness) usually occurs when the cone responses fall to about 0.05 μV.
Figure 5.
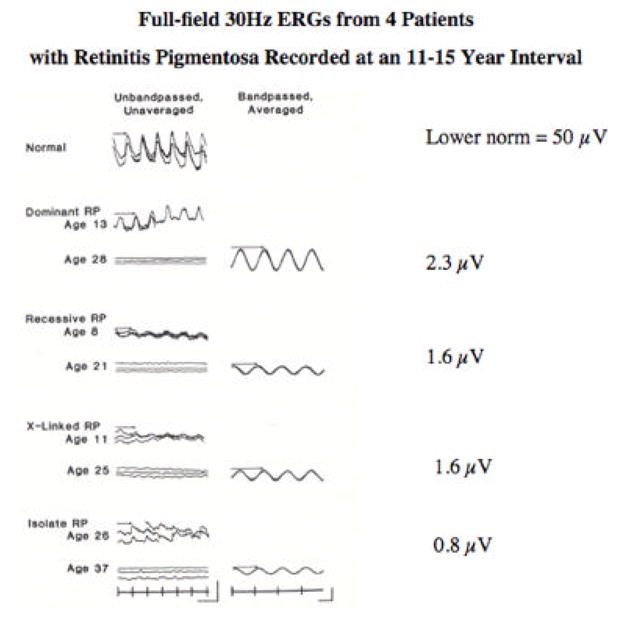
Full-field 30-Hz cone ERGs from a normal subject and four patients with retinitis pigmentosa tested at an 11–15-year interval. Stimulus onset, vertical markers; calibration symbol (left column, lower right) designates 100 μV vertically for the normal subject and top three patients and 40 μV vertically for the bottom patient and 50 msec horizontally for all traces; calibration (right column, lower right) designates 2 μV vertically for the dominant, X-linked, and isolate patients and 0.3 μV for the recessive patient and 20 msec horizontally for all traces. B-wave implicit times are designated with arrows. (From Andreasson, et al., 1988.)
Since narrow bandpassed filtering and computer averaging are essential in monitoring small amplitude cone responses in patients with retinitis pigmentosa, I would like to make some comments on our recording technique. With this technique the equipment records (or passes) primarily the center frequency, in this case 30 Hz ± 1 Hz, and attenuates the side bands to isolate the fundamental frequency and eliminate harmonics. Consecutive narrow bandpassed (electronically filtered) cone responses are then computer averaged to improve the signal-to-noise ratio, thereby allowing us to record down to 0.05 μV. Each average consists of about 200 sweeps with 6 responses per sweep, and consecutive averages are obtained until stabilization of the response amplitude occurs. The recording, performed after pupillary dilation, generally requires about 10 minutes per eye and no significant complications have occurred. We use a bipolar Burian-Allen contact lens electrode rather than a monopolar electrode to reduce electrical and photovoltaic artifacts, thereby helping us to minimize extraneous noise. The speculum of this lens keeps the lids open. We test our lenses periodically in saline to insure that the artifacts are less than 0.05 μV. Other recording lenses such as the gold foil electrode or the DTL lens generate noise that precludes recording responses less than 1 μV (Berson et al., 1985; Birch and Sandberg, 1996).
Narrow bandpassed filtered, computer averaged 30-Hz cone responses are shown from a representative patient with retinitis pigmentosa who had 1.3 μV at the initial baseline evaluation and 0.8 μV 6 years later (Figure 6). These recordings illustrate the reproducibility of these responses and provide an example of how the progression of disease can be followed with great precision with this technique even at these low amplitudes (Berson et al., 1993).
Figure 6.

Narrow bandpassed, computer-averaged full-field cone ERGs in response to 30 Hz flashes (n=256 sweeps with 6 responses per sweep) from a representative patient with retinitis pigmentosa at baseline and 6 years after baseline. Three consecutive averages are superimposed. The broken vertical line indicates the onset of the train of flashes. (From Berson, et al., 1993)
Frequency of positive responses on a visual function questionnaire among 586 patients with retinitis pigmentosa are plotted against cone amplitudes (Figure 7). Most of these patients had 20/40 or better acuity. The percentages of positive responses with respect to capacity to drive during the day or at night, walk alone at night, or be employed are significantly related to the size of the cone ERG. When cone responses fall below 0.34 μV, the percentages of patients who can perform these tasks are far less than for those with responses of 4.5 μV or greater. Therefore, the narrow bandpassed computer averaged cone ERG is not only a measure of retinal function but is also a measure of visual function (Berson et al., 1993).
Figure 7.
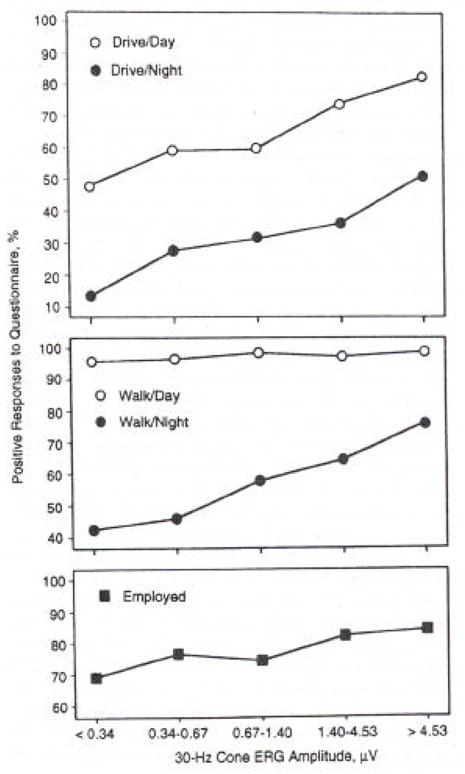
Frequency of positive responses on questionnaire as a function of 30-Hz cone electroretinogram (ERG) amplitude for 586 patients with retinitis pigmentosa. Groups were defined based on quintile of ERG amplitude: <0.34 μV (n=132); 0.34 to 0.67 μV (n=125); 0.67 to 1.40 μV (n=117); 1.40 to 4.53 μV (n=109); and >4.53 μV (n=103). (From Berson, et al., 1993).
We have identified 1039 patients with the typical forms of retinitis pigmentosa in our database who ranged in age from 2 to 71 years at their initial visits and had at least 2 visits separated by 3 or more years. More than 70% came from outside Massachusetts. These patients were followed for 3 to 29 years. The average course of disease was derived from 6553 visits. At baseline all had cone ERGs greater than or equal to 0.68 μV, thereby giving them enough function to be followed over time. We did a regression of cone 30-Hz ERG amplitude on age using a mixed effects model taking into account correlations between ERGs obtained at repeated visits for the same patient and observed that the average rate of decline over the long-term could be described by an exponential function. Each data point represents the average expected cone amplitude for patients at a given age (Figure 8). These data, replotted on a semi-log scale, are described by a straight line (Figure 9).
Figure 8.

Regression of cone ERG amplitude on age among 1039 patients with retinitis pigmentosa in the database of the Berman-Gund Laboratory. Patients were followed for 3–29 years with at least 2 visits separated by 3 or more years. The average rate of decline over the long-term can be described by an exponential function with a mean rate of loss of 8.1% of remaining cone function per year. The rate of decline can also be described by a spline model. Goodness of fit of the exponential model did not significantly differ from that of the spline model.
Figure 9.

Data from Figure 8 replotted on a semi-log scale show that the rate of decline of cone ERG amplitudes from patients with retinitis pigmentosa can be described by a straight line even at low voltages, compatible with the idea that an exponential model can be used to describe the average long-term rate of loss of retinal function in patients with retinitis pigmentosa.
To assess the adequacy of this exponential model, we also fit a restricted cubic spline model to our data (Harrell, 2001). A spline model allows for different rates of decline at different ages. We found that the goodness of fit was not significantly different between the spline model and the exponential model (see Figure 8) (Sandberg, et al., 2007, manuscript submitted). Therefore, we conclude that the exponential model is sufficient to describe the long-term course of cone ERG amplitude decline in patients with typical retinitis pigmentosa. These observations in patients with retinitis pigmentosa are consistent with a previous study in animals with hereditary photoreceptor degeneration (Clarke, et al., 2000) that found that an exponential model described the rate of loss of retinal cells and ERG amplitude as a function of aging, supporting the conclusion that the risk of individual cell death in these genetic diseases is random and remains constant with increasing age.
In this population, subgroup analyses by genetic type revealed that the average annual rates of decline of remaining cone ERG amplitudes for dominant, recessive, X-linked, and isolate cases are fairly comparable to each other, compatible with the idea that one rate of decline can be used in clinical practice to describe the average long-term course of disease in this condition (for dominant disease see Berson et al., 2002; for X-linked disease see Sandberg et al., 2007, in press). The clinical finding that X-linked patients usually become blind before dominant cases can be explained by the fact that children with X-linked disease at a given age usually have less cone function than children with dominant disease even though their cone ERGs are declining at about the same rate.
In this study the patients reported taking vitamin A palmitate 15,000 IU/day at 55% of the visits which, on average, slows the course of their disease. Therefore, we elected to use the average rate of decline in the control group in our vitamin A trial for patients followed for 6 years to arrive at an estimate of the natural annual rate of decline of remaining cone function over the long-term. This rate of decline was 10% per year, which under an exponential model is equivalent to loss of 50% of remaining function every 7 years. In the case of the vitamin A-treated group in this trial the rate of decline was 8.3% per year which is equivalent to losing 50% of remaining cone ERG function every 8.5 years (Berson et al., 1993).
Using the rate of 10% per year over the long-term, we have constructed a cone ERG actuarial table (Table 1) that provides an estimate of the number of years for a patient at a given age, on average, to decline to an amplitude of 0.05 μV. For example, without treatment a patient age 32 with 2.0 μV at the initial visit would be expected, on average, to reach 0.05 μV in 35 years and retain useful vision until age 67. With vitamin A treatment this patient age 32 would be expected, on average, to reach 0.05 μV in 42.5 years and retain useful vision until age 74.5 years. This 7-year benefit of vitamin A can be extended to about 20 years if patients not only take vitamin A but also eat 2 servings of omega-3 rich fish per week (Berson et al., 2004).
Table 1. Cone ERG Actuarial Table for Retinitis Pigmentosa.
Cone ERG actuarial table for patients with retinitis pigmentosa to estimate average long-term visual prognoses based on 30-Hz cone ERG amplitude at a single visit.
| Expected # of Years for a Patient with a Given 30Hz Cone ERG at the Initial Visit to Decline to 0.05 μV | ||
|---|---|---|
| 30Hz ERG (μV) (initial visit) | No Treatment (10% loss per year) | Vitamin A (8.3% loss per year) |
| 0.10 | 6.58 | 8.00 |
| 0.50 | 21.85 | 26.57 |
| 1.00 | 28.43 | 34.57 |
| 2.00 | 35.01 | 42.57 |
| 2.50 | 37.13 | 45.15 |
| 3.50 | 40.32 | 49.03 |
| 5.00 | 43.71 | 53.15 |
| 8.00 | 48.17 | 58.57 |
| 10.00 | 50.29 | 61.15 |
Example: With no treatment, a patient age 32 with 2.0 μV at the initial visit would be expected, on average, to reach 0.05 μV in 35 years and retain useful vision until age 67 (ie., 32+35). With vitamin A treatment, this patient would be expected, on average, to reach 0.05 μV in 42.5 years and retain useful vision until age 74.5 (ie., 32+35).
A patient age 27 presented to us with the history that she had a flat ERG. She sought consultation with us because she had been told that she would be blind in 10 years. With conventional ERG testing, we confirmed that she had a flat ERG (< 10 μV) in each eye (Figure 10, left); but with electronic filtering and computer averaging, we found that she retained 8 μV of cone function in each eye (Figure 10, right). Based on our actuarial table (Table 1), she would be expected to reach 0.05 μV in 48 years without any treatment and 58 years with vitamin A treatment. Briefly restated, she came with the thought she would be blind by age 37 and left with the estimate that she would see until age 75 without treatment and age 85 with treatment with vitamin A palmitate 15,000 IU/day.
Figure 10.
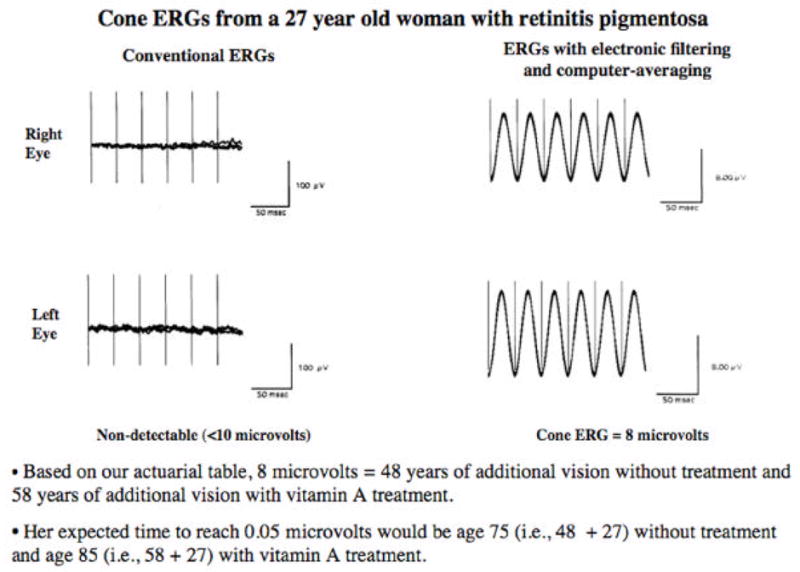
Full-field 30-Hz cone ERGs from a 27-year-old patient with retinitis pigmentosa without narrow bandpassed filtering and computer averaging (left) and with narrow bandpassed filtering and computer averaging (right). This patient had 20/20 vision and full visual fields with a V4e white test light.
The estimated time to reach 0.05 μV without treatment can be calculated from the following formula:
where t = time in years and x=initial cone amplitude. To make an approximate calculation without an actuarial table, the following guidelines can be used. Patients without treatment would be expected to decline 50% every 7 years and those with vitamin A treatment every 8.5 years. For example, a patient with 8 μV at age 27 would decline from 8 to 4 to 2 to 1 to 0.5 to 0.25 to 0.12 to 0.06 at about 7-year intervals. This patient without treatment would be expected to decline to 0.05 μV, on average, by age 76 years (i.e. 7 intervals × 7 years + 27 = 76). This patient with vitamin A treatment would be expected to decline to 0.05 μV, on average, by age 86.5 years (i.e. 7 intervals × 8.5 years + 27 = 86.5).
Our cone ERG actuarial table reveals that a patient age 40 with 3.5 μV or greater would be expected to retain some useful vision until age 80. Based on the distribution of cone ERG amplitudes at initial visits in a sample of 3079 patients with typical retinitis pigmentosa in our database, we would estimate that about 25% of patients have a projected amplitude of 3.5 μV or greater at age 40 and therefore would be expected to retain some useful vision to age 80 without treatment. About 45% of these patients have a projected amplitude of 2.0 μV or greater at age 40 and they would be expected, on average, to retain useful vision beyond age 80 but would require vitamin A treatment to achieve this.
Although an estimate of the long-term prognosis can be made from a single examination, patients should be encouraged to return for three or four visits at 2–3 year intervals to determine to what extent their rates of decline correspond with the average projected rate. It may be possible to make similar projections based on the widely used Humphrey Field Analyzer, but the long-term rate of decline of visual field sensitivity is not yet available for patients with retinitis pigmentosa. In any event, the 30-Hz cone ERG has an advantage in that it provides a rapidly obtained objective measure of remaining cone function and therefore can be used in patients including young children who are unable to perform reliable visual field testing.
Some precautions must be exercised in using our actuarial table for estimating long-term visual prognoses from a single visit as follows: (1) More than 90% of the normal full-field cone ERG is generated by extra-foveal cones. For patients with small central fields and large peripheral islands, the estimated rates of decline derived from the full-field cone ERG apply to the periphery rather than the center. (2) These estimated rates were derived from patients with typical retinitis pigmentosa including Usher syndrome, type II. These rates do not apply to less common atypical forms such as pericentral (Sandberg et al., 2005) or paravenous (Choi et al., 2006) retinitis pigmentosa which are known to have substantially slower rates of decline than the typical forms. (3) These rates may not apply to patients with cone-rod degenerations (i.e. those with predominant loss of cone function and some loss of rod function) as our rates were derived from patients with typical retinitis pigmentosa, who have either comparable loss of rod and cone function or rod loss that exceeds cone loss. (4) It is possible that these rates would not apply to individual patients with certain mutations or patients from isolated geographic areas not included in our sample. Again, we already know that patients with dominantly inherited class II rhodopsin mutations such as Pro23His have, on average, a substantially slower course than patients with class I mutations such as Pro347Leu (Berson, et al., 2002). Over the first 10 years of follow-up for the average patient, the pattern of decline on a log scale appeared approximately linear. After 10 years of follow-up, if cone amplitudes were less than 1.0 µV, the pattern of decline on a log scale was found to be less steep and more curvilinear; therefore, the projected ages for reaching ≤ 0.05 µV may be somewhat conservative when estimated only by an exponential model.
In our experience, knowledge of cone ERG amplitudes provides patients with a realistic guideline for planning their futures and thereby reduces anxiety. We now inform patients, “You know your height. You know your weight. You should know your voltage.” The actual ERG response tracings and measurements of amplitudes are provided to patients who request an estimate of their long-term visual prognosis. These ERG tracings allow patients to see what function remains. Without treatment the critical cone amplitude appears to be 3.5 μV or greater at age 40. Patients with this amplitude are expected to retain some useful vision for their entire lives assuming an average life expectancy of 80 years. With vitamin A treatment the critical voltage appears to be 2 μV or greater at age 40. Patients on vitamin A treatment by this age with this amplitude are expected, on average, to retain some useful vision for their entire lives.
In summary, retinitis pigmentosa can be followed over almost its entire course with narrow bandpassed filtered, computer averaged cone ERGs. The rate of decline of these responses, on average, can be described over the long-term by an exponential function. The amplitude of the cone ERG at a single visit can be used to provide an estimate of the average long-term visual prognosis. More precise estimates for a specific patient require several additional visits over 2- to 3-year intervals. An actuarial table is presented to show the estimated number of years for a patient with a given 30-Hz cone amplitude to decline to 0.05 μV (i.e. virtual blindness). This table is based on a projected rate of loss of 10% of remaining cone ERG function per year for those not on treatment and 8.3% per year for those on treatment with vitamin A palmitate 15,000 IU/day. Patients with a projected cone amplitude of 3.5 μV or greater at age 40, would be expected, on average, to retain some useful vision (i.e. greater than 0.05 μV) for their entire lives without treatment. Knowledge of the amount of remaining cone function in the ERG often reduces patient anxiety and helps patients plan for their future. Patients with retinitis pigmentosa know their height and they know their weight. If they want to know their visual future, they should know their cone ERG voltage.
Acknowledgments
The National Eye Institute (EY00169) and The Foundation Fighting Blindness, Owings Mills, MD.
I thank Dr. Peter Gouras and his colleagues on the Awards Committee and the officers of the International Congress of Eye Research for giving me this opportunity to speak. I also thank my collaborators Dr. Bernard Rosner, Dr. Michael Sandberg, and Carol Weigel-DiFranco for their invaluable contributions to this research and our clinical and administrative staff for their assistance, namely Dr. Robert Brockhurst, Dr. Alexander Gaudio, Bethany Biron, Emorfily Potsidis, Yuji Che, Rorn Seng, Mallory Eng, Shyana Harper, Michelle Berry, Lorri Seaver, Kristen Haskell, Marion McPhee, Martin Van Denburgh, Suzanne Dalton, Cathy Lonergan, Crystal Beck, Linda Berard, and James Quinlivan. I also wish to express my appreciation to the National Eye Institute and the Foundation Fighting Blindness for their long-term grant support that made this research possible and to the patients who participated in multiple follow-up visits that made it possible to develop these long-term estimates of visual prognoses.
Footnotes
Presented on October 30, 2006 at the XVIIth Meeting of the International Congress of Eye Research, Buenos Aires, Argentina.
Publisher's Disclaimer: This is a PDF file of an unedited manuscript that has been accepted for publication. As a service to our customers we are providing this early version of the manuscript. The manuscript will undergo copyediting, typesetting, and review of the resulting proof before it is published in its final citable form. Please note that during the production process errors may be discovered which could affect the content, and all legal disclaimers that apply to the journal pertain.
References
- Andréasson SOL, Sandberg MA, Berson EL. Narrowband filtering for monitoring low-amplitude cone electroretinograms in retinitis pigmentosa. Amer J Ophthalmol. 1988;105:500–503. doi: 10.1016/0002-9394(88)90241-3. [DOI] [PubMed] [Google Scholar]
- Berson EL. Retinitis pigmentosa and allied diseases: electrophysiologic findings. Trans Amer Acad Ophthalmol Otolaryngol. 1976;81:659–666. [PubMed] [Google Scholar]
- Berson EL. Retinitis pigmentosa. The Friedenwald Lecture Invest Ophthalmol Vis Sci. 1993;34:1659–1676. [PubMed] [Google Scholar]
- Berson EL, Gouras P, Gunkel RD. Progressive cone-rod degeneration. Arch Ophthalmol. 1968;80:68–76. doi: 10.1001/archopht.1968.00980050070010. [DOI] [PubMed] [Google Scholar]
- Berson EL, Rosen JB, Simonoff EA. Electroretinographic testing as an aid in detection of carriers of X-chromosome-linked retinitis pigmentosa. Amer J Ophthalmol. 1979;87:460–468. doi: 10.1016/0002-9394(79)90231-9. [DOI] [PubMed] [Google Scholar]
- Berson EL, Rosner B, Sandberg MA, Hayes KC, Nicholson BW, Weigel-DiFranco C, Willett W. A randomized trial of vitamin A and vitamin E supplementation for retinitis pigmentosa. Arch Ophthalmol. 1993;111:761–772. doi: 10.1001/archopht.1993.01090060049022. [DOI] [PubMed] [Google Scholar]
- Berson EL, Rosner B, Sandberg MA, Weigel-DiFranco C, Moser A, Brockhurst RJ, Hayes KC, Johnson CA, Anderson EJ, Gaudio AR, Willett WC, Schaefer EJ. Further evaluation of docosahexaenoic acid in patients with retinitis pigmentosa receiving vitamin A treatment: Subgroup analyses. Arch Ophthalmol. 2004;122:1306–1314. doi: 10.1001/archopht.122.9.1306. [DOI] [PubMed] [Google Scholar]
- Berson EL, Rosner B, Weigel-DiFranco C, Dryja TP, Sandberg MA. Disease progression in patients with dominant retinitis pigmentosa and rhodopsin mutations. Invest Ophthalmol Vis Sci. 2002;43:3027–3036. [PubMed] [Google Scholar]
- Berson EL, Sandberg MA, Rosner B, Birch DG, Hanson AH. Natural course of retinitis pigmentosa over a three-year interval. Amer J Ophthalmol. 1985;99:240–251. doi: 10.1016/0002-9394(85)90351-4. [DOI] [PubMed] [Google Scholar]
- Berson EL, Simonoff EA. Dominant retinitis pigmentosa with reduced penetrance: Further studies of the elctroretinogram. Arch Ophthalmol. 1979;97:1286–1291. doi: 10.1001/archopht.1979.01020020028006. [DOI] [PubMed] [Google Scholar]
- Birch DG, Sandberg MA. Submicrovolt full-field cone electroretinograms: artifacts and reproducibility. Doc Ophthalmol. 1996;92:269–280. doi: 10.1007/BF02584081. [DOI] [PubMed] [Google Scholar]
- Choi J, Sandberg MA, Berson EL. Natural course of ocular function in pigmented paravenous retinochoroidal atrophy. Am J Ophthalmol. 2006;141:763–765. doi: 10.1016/j.ajo.2005.11.009. [DOI] [PubMed] [Google Scholar]
- Clarke G, Collins RA, Leavitt BR, et al. A one-hit model of cell death in inherited neuronal degenerations. Nature. 2000;406:195–199. doi: 10.1038/35018098. [DOI] [PubMed] [Google Scholar]
- Gouras P. Electroretinography: Some basic principles. Invest Ophthalmol. 1970;9:557–569. [PubMed] [Google Scholar]
- Harrell FE. Regression Modeling Strategies with Applications to Linear Models, Logistic Regression, and Survival Analysis. Springer-Verlag; New York: 2001. [Google Scholar]
- Hartong DT, Berson EL, Dryja TP. Retinitis pigmentosa. Lancet, Seminar Series. 2006;368:1795–1809. doi: 10.1016/S0140-6736(06)69740-7. [DOI] [PubMed] [Google Scholar]
- Rabin AR, Berson EL. A full-field system for clinical electroretinography. Arch Ophthalmol. 1974;92:59–63. doi: 10.1001/archopht.1974.01010010063015. [DOI] [PubMed] [Google Scholar]
- Sandberg MA, Gaudio AR, Berson EL. Disease course of patients with pericentral retinitis pigmentosa. Amer J Ophthalmol. 2005;140:100–106. doi: 10.1016/j.ajo.2005.02.038. [DOI] [PubMed] [Google Scholar]
- Sandberg MA, Rosner B, Weigel-DiFranco C, Berson EL. An exponential model describes the long-term courses of visual field and electroretinogram loss in retinitis pigmentosa. 2007. Manuscript submitted. [Google Scholar]
- Sandberg MA, Rosner B, Weigel-DiFranco C, Dryja TP, Berson EL. Disease course of patients with X-linked retinitis pigmentosa due to RPGR gene mutations. Invest Ophthalmol Vis Sci. 2007 doi: 10.1167/iovs.06-0971. In press. [DOI] [PubMed] [Google Scholar]
- Sandberg MA, Weigel-DiFranco C, Rosner B, Berson EL. The relationship between visual field size and electroretinogram amplitude in retinitis pigmentosa. Invest Ophthalmol Vis Sci. 1996;37:1693–1698. [PubMed] [Google Scholar]