Abstract
Sensory input to different cortical areas differentially varies across the light-dark cycle and likely is responsible, in part, for activity-dependent changes in time-of-day differences in protein expression such as Fos In this study we investigate time-of-day differences between dark (just before light onset) and light (just before dark onset) for the number of immunoreactive (IR) neurons that stained for tumor necrosis factor alpha (TNFα), interleukin-1β (IL1β), nerve growth factor (NGF), the neuronal nuclear protein (NeuN) and Fos in the rat somatosensory cortex (Sctx) and visual cortex (Vctx). Additionally, astrocyte IL1β-IR in the Sctx and Vctx was determined. TNFα and IL1β, as well as the immediate early gene protein Fos, were higher at the end of the dark phase (2300 h) compared to values obtained at the end of the light phase (1100 h) in the Sctx and Vctx. IL1β –IR in Sctx and Vctx astrocytes was higher at 2300 h than that observed at 1100 h. . In contrast, the number of NGF-IR neurons was higher in the Vctx than in the Sctx but did not differ in time. However, the density of the NGF-IR neurons in layer V was greater at 2300 h in the Sctx than at 1100 h. NeuN-IR was higher at 2300 h in the Sctx but was lower at this time in the Vctx compared to 1100 h. These data demonstrate that expressions of the molecules examined are dependent on activity, the sleep-wake cycle and brain location. These factors interact to modulate time-of-day expression. Section Title: Regulatory Systems
Keywords: use-dependent, whisker, astrocytes, cytokines, sleep, glial-neuronal interactions
1. Introduction
Neurotrophic growth factors and other cytokines are posited to play a role in activity-dependent cellular mechanisms (Cellerino and Maffei, 1996; Boulanger and Poo, 1999; Thoenen, 2000; Krueger et al., 2008; Levi-Montalcini, 1966). Further, several modern theories of sleep mechanisms and function emphasize that sleep is dependent upon prior neuronal activity and is a fundamental property of highly interconnected neuronal networks such as cortical columns (Krueger and Obal, 1993; Kavanau, 1994; Benington and Heller, 1995; Tononi and Cirelli, 2003; Krueger et al., 2008). Many neurotrophins/cytokines mentioned have the capacity to enhance non-rapid eye movement (NREM) sleep and there is substantial evidence that tumor necrosis factor alpha (TNFα), interleukin-1 beta (IL1β) and nerve growth factor (NGF) are involved in physiological sleep regulation (reviewed Krueger et al., 2008) and in the sleep responses to chronic and acute inflammation (Majde and Krueger, 2005). It is of interest therefore to determine whether expressions of sleep regulatory substances (SRSs), such as NGF, IL1β, and TNFα, change in the somatosensory cortex (Sctx) or visual cortex (Vctx) during the time of day where the rats are mainly using their whiskers or visual system (Montero, 1997).
Electroencephalographic (EEG) delta wave power during NREM sleep, a measure of sleep intensity, is altered by the time of day (Yasuda et al., 2005a; Alföldi et al., 1991). When EEG electrodes are located over the Sctx, relative EEG slow wave activity (SWA) is higher during the dark than during daylight. In contrast, if the electrodes are located over the Vctx, relative EEG SWA is higher during the light than dark. Further, the local topographical stimulation of the barrel field in the somatosensory cortex for 2 h increases the levels of NGF, IL1β and TNFα (Churchill et al., 2008; Hallett et al., in press). In the current study, we used the time of day differences in rats' neural activity within the Sctx or Vctx to compare the immunoreactive cells for IL1β, TNFα, NGF as well as the immediate early gene protein Fos and the neuronal nuclear protein, NeuN. The number of TNFα-, IL1β- and NeuN-positive cells was greater in the rat Sctx in the dark than in the light. TNFα and IL1β expression also increased in the rat Vctx in the dark compared to the light. For IL1β differential expression also occurred in astrocytes. In contrast, Vctx expression of NeuN and NGF were greater in the light than in the dark.
2. Results
2.1 TNFα-IR cells at 1100 h (end of light period) or 2300 h (end of dark period)
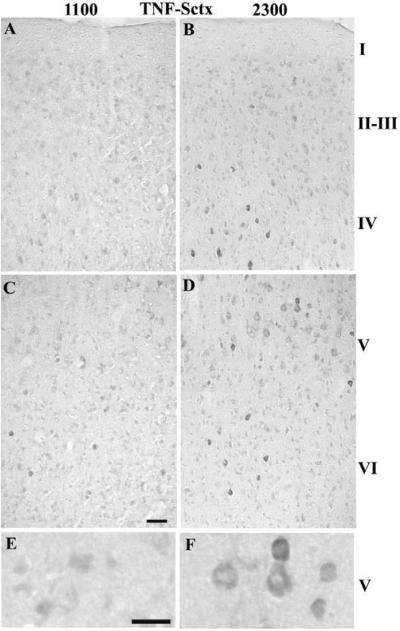
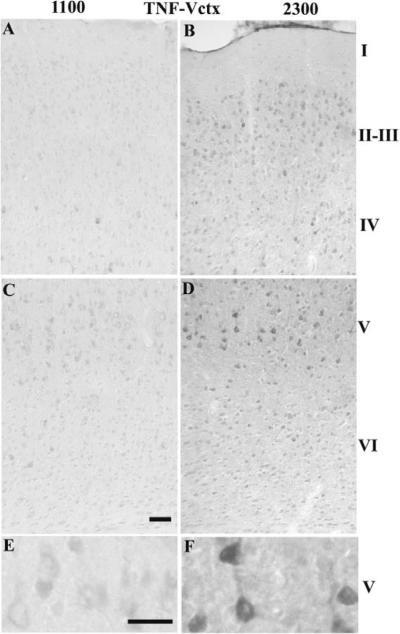
Overall, the number of darkly stained TNFα-IR cells was higher at 2300 h relative to 1100 h for layers II–V of the Sctx (Table 1A & Fig. 1 B, D & F relative to A, C & E). The most prominently labeled TNFα-IR cells are evident in layers IV and V (Fig. 1B and 1F). In Sctx layer V, the TNFα-IR labels the cytoplasm in the cell body and the lower part of the apical dendrite. In the Vctx, there was a significantly higher number of TNFα-IR cells than in the Sctx for all of the layers and for layer IV there were a higher number of TNFα-IR cells at 2300 h than at 1100 h (Table 1B & Fig. 2B, D &F relative to 2A, C & E).
Table 1.
Quantitative evaluation of the number of TNF-, IL1β, NGF-, NeuN- and Fos-IR cells in the Sctx and Vctx layers at the end of the light (1100) or dark (2300) period. Data are represented as Mean ± S.E.M.
| A. Sctx layers | II–III | IV | V | VI | ||||||||
|---|---|---|---|---|---|---|---|---|---|---|---|---|
| Antibodies | 1100 | 2300 | t value, prob | 1100 | 2300 | t value, prob | 1100 | 2300 | t value, prob | 1100 | 2300 | t value, prob |
| TNF-n=7 | 5.2±1.5 | 14.0±1.9 * | t=7.64, p=0.0001 | 6.7±1.3 | 15.8±2.3 * | t=3.78, p=0.0046 | 12.9±2.5 | 21.5±1.4 * | t=5.59, p=0.0007 | 4.0±0.9 | 8.7±1.5 * | t=4.00, p=0.004 |
| IL1β n=7 | 5.2±0.8 | 7.7±1.2 * | t=3.16, p=0.010 | 3.4±0.3 | 5.9±0.7 * | t=3.15, p=0.010 | 10.0±0.5 | 12.3±1.1 * | t=1.99, p=0.047 | 8.6±1.0 | 9.8±1.2 | t=1.37, p=0.11 |
| NGF n=7 | 89.4±5.3 | 94.5±5.3 | t=0.85, p=0.214 | 87.7±3.6 | 88.6±4.3 | t=0.127, p=0.452 | 65.4±3.5 | 60.9±2.8 | t=0.238, p=0.476 | 67.4±5.3 | 65.3±2.3 | t=0.326, p=0.378 |
| NeuN n=7 | 118.2±7.5 | 135.2±6.3 * | t=3.04, p=0.023 | 108.6±5.5 | 128.0±7.4 * | t=1.99, p=0.046 | 70.6±4.7 | 84.4±4.7 * | t=4.87, p=0.001 | 80.1±3.9 | 102.8±7.0 * | t=5.30, p=0.001 |
| Fos n=7 | 86.8±9.4 | 121.4±10.5 * | t=5.56, p=0.001 | 99.3±10.3 | 132.3±10.0 * | t=2.57, p=0.021 | 67.3±2.6 | 85.6±4.1 * | t=4.63, p=0.002 | 77.2±3.5 | 101.9±7.8 * | t=2.72, p=0.017 |
| B.Vctx layers | II–III | IV | V | VI | ||||||||
|---|---|---|---|---|---|---|---|---|---|---|---|---|
| Antibodies | 1100 | 2300 | t value, prob | 1100 | 2300 | t value, prob | 1100 | 2300 | t value, prob | 1100 | 2300 | t value, prob |
| TNF n=6 | 22.6±2.8 | 26.6±1.8 | t=−1.11, p=0.16 | 14.6±1.7 | 21.3±2.7 * | t=−4.57, p=0.003 | 26.9±2.4 | 35.0±4.9 + | t=-1.45, p=0.10 | 16.1±2.8 | 14.7±2.7 | t=0.72, p=0.253 |
| IL1β n=7 | 9.0±1.3 | 9.1±1.6 | t=0.19 p=0.43 | 5.9±0.7 | 6.3±0.6 | t=−0.61 p=0.28 | 11.2±1.6 | 14.5±1.8 * | t=−2.39 p=0.027 | 5.3±0.4 | 6.4±0.7 + | t=−1.76 p=0.065 |
| NGF n=6 | 117.0±5.9 * | 101.0±7.0 | t=3.83, p=0.006 | 94.3±5.3 * | 84.4±7.3 | t=3.10, p=0.013 | 72.5±6.4 | 71.3±5.5 | t=0.22, p=0.42 | 83.1±5.5 | 80.9±4.2 | t=0.43, p=0.34 |
| NeuN n=7 | 153.0±8.2 | 138.1±1.3 | t=1.40, p=0.11 | 144.4±6.4 * | 124.1±10.2 | t=4.04, p=0.003 | 107.9±5.5 * | 92.5±8.6 | t=2.59, p=0.021 | 130.4±7.3 | 122.2±10.2 | t=1.07, p=0.16 |
| Fos n=7 | 104.3±10.0 | 148.7±17.3 * | t=5.11, p=0.001 | 90.2±8.1 | 155.2±12.8 * | t=−8.92, p=0.0001 | 75.3±7.1 | 109.8±7.9 * | t=−7.84, p=0.0000 | 94.6±11.0 | 140.2±14.6 * | t=−4.43, p=0.002 |
p<0.05 comparing 11 h after light onset and 11 h after dark onset using a Student's paired t test
p≤0.10 comparing 11 h after light onset and 11 h after dark onset using a Student's paired t test
Fig. 1. TNFα-IR in the Sctx at 1100 (light) or 2300 (dark).
TNFα-IR cells increased in specific Sctx layers in the dark (2300 h) (C, D & F) in comparison with light (1100 h)(A, B, E). Darkly stained neurons are evident at 2300 h in layer IV–VI. The TNF-IR appears in the cytoplasm and extends into the apical dendrite of the large pyramidal neurons in layer V at 2300 h (D & F). Bar = 0.05 mm for A–D; Bar =0.025 mm for E&F.
Fig. 2. TNFα-IR in the Vctx at 1100 (light) or 2300 (dark).
TNF-IR cells increased in Vctx layers IV–V in the dark (C, D & F) in comparison with light (A, B, E). Darkly stained neurons are evident at 2300 h in layer IV–V. The TNFα-IR appears in the cytoplasm and extends into the apical dendrite of the large pyramidal neurons in layer V at 2300 h (D & F). Bar = 0.05 mm for A–D; Bar =0.025 mm for E&F.
2.2 IL1β-IR cells at 1100 h or 2300 h
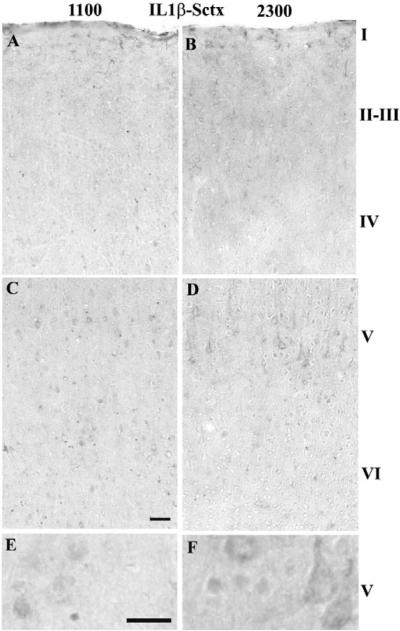
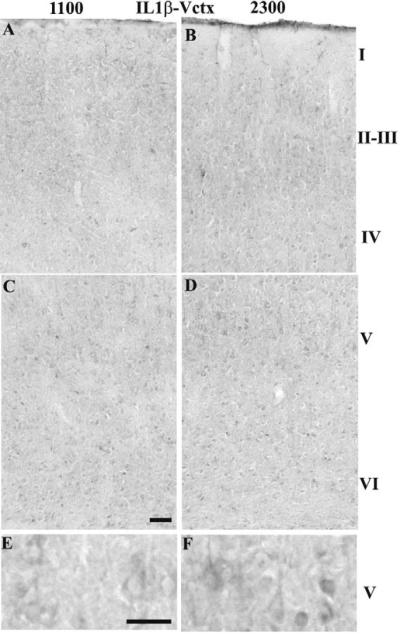
In the Sctx, the number of IL1β-IR cells was greater in Sctx layers IV–V at 2300 h relative to 1100 h (Table 1A & Fig. 3B, D &F relative to 3A, C & E). In layer V, the IL1β-IR was in the cell body cytoplasm including the apical dendrite (Fig. 3F vs E). In the Vctx, the number of IL1β-IR cells was greater in layers II–III, IV and VI than in the Sctx (Table 1A & B) and in layer V at 2300 h compared to 1100 h (Table 1B & Fig. 4B, D & F relative to 4A, C & E). In the Vctx, IL1β-IR was distributed similarly to that observed in the Sctx (compare Fig. 3F to Fig. 4F).
Fig. 3. IL1β-IR in the Sctx at 1100 (light) or 2300 (dark).
IL1β-IR cells increased in Sctx layers II–V at 2300 h (C, D & F) in comparison to 1100 h (A, B, E). The IL1β-IR appears in the cytoplasm and extends into the apical dendrite of the large pyramidal neurons in layer V at 2300 h (D & F). Bar = 0.05 mm for A–D; Bar =0.025 mm for E&F.
Fig. 4. IL1β-IR in the Vctx at 1100 (light) or 2300 (dark).
IL1β-IR cells increased in Vctx layers V–VI at 2300 h (D & F) in comparison to 1100 h (B, E). The IL1β-IR appears in the cytoplasm and extends into the apical dendrite of the large pyramidal neurons in layer V at 2300 h (D & F). Bar = 0.05 mm for A–D; Bar =0.025 mm for E&F.
IL1β-IR astrocytes were evident within layers I and VI in the rats killed at 2300 h in both the Sctx and Vctx (Fig. 5). In the Sctx, the number of ILβ-IR cells was greater at 2300 h relative to 1100 h in layers I and VI and the external capsule below the Sctx (Table 2). The number of IL1β-IR astrocytes were greater in the Sctx than in the Vctx in layer V, but greater in the Vctx than Sctx in layers VI and the fiber pathways adjacent to these areas (the forceps major (fmj) below the monocular region of the Vctx). In the Vctx, the number of IL1β-IR astrocytes was greater at 2300 h relative to 1100 h in layers I & VI (Table 2, Fig. 5).
Fig. 5. IL1β-IR in astrocytes of the Sctx and Vctx at 1100 (light) or 2300 (dark).
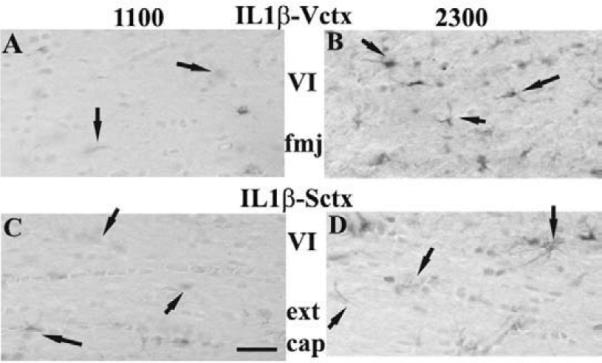
IL1β-IR astrocytes increased in number at 2300 h in layer VI (B& D) and the white matter below this layer (external capsule for the Sctx and forceps major (fmj) relative to 1100 h (A&C). The Vctx astrocytes (A&B) were much darker than the Sctx astrocytes (C & D). The layer VI and fibrous astrocytes in the white matter are marked by the arrows. Bar = 0.05 mm.
Table 2.
Quantitative evaluation of the number of IL1β-IR astrocytes in the Sctx and Vctx layers at the end of the light (1100) or dark (2300) period. Data are represented as Mean ± S.E.M. for n= 7 rats.
| # IL1β-IR astrocytes in Sctx/ 0.114 mm2 | |||
|---|---|---|---|
| Sctx layers | 1100 | 2300 | t-value, prob |
| I | 9.9 ± 1.3 | 13.9 ± 1.7 * | t = 2.10, p = 0.040 |
| # IL1β-IR astrocytes in Sctx/ 0.10 mm2 | |||
|---|---|---|---|
| II–III | 4.1 ± 0.6 | 5.6 ± 0.7 * | t = 2.86, p = 0.014 |
| IV | 1.6 ± 0.2 | 1.3 ± 0.2 | t = −1.02, p = 0.17 |
| V | 2.5 ± 0.4 | 2.9 ± 0.3 | t = −1.10, p = 0.17 |
| VI | 3.0 ± 0.6 | 4.0 ± 0.4 * | t = 3.60, p = 0.006 |
| Ext cap | 25.3 ± 4.8 | 33.9 ± 4.0 | t = 1.27, p = 0.13 |
| # IL1β-IR astrocytes in Vctx/ 0.114 mm2 | |||
|---|---|---|---|
| Vctx layers | 1100 | 2300 | t-value, prob |
| I | 9.6 ± 1.1 | 12.4 ± 0.9 † | t = 1.71, p = 0.074 |
| # IL1β-IR astrocytes in Vctx/ 0.10 mm2 | |||
|---|---|---|---|
| II–III | 4.1 ± 0.5 | 4.2 ± 0.5 | t = 0.08, p = 0.47 |
| IV | 1.6 ± 0.3 | 1.5 ± 0.4 | t = −0.27, p = 0.40 |
| V | 1.5 ± 0.4 | 2.1 ± 0.2 | t =1.26, p = 0.13 |
| VI | 3.6 ± 0.4 | 5.9 ± 0.5 * | t = 3.13, p = 0.013 |
| fmj | 31.1 ± 6.7 | 71.3 ± 6.2 * | t = 3.49, p = 0.013 |
p< 0.05 comparing light (1100) and dark (2300) using a Student's paired t-test
p≤ 0.10 comparing light (1100) and dark (2300) using a Student's paired t-test
2.3 NGF-IR cells at 1100 h or 2300 h
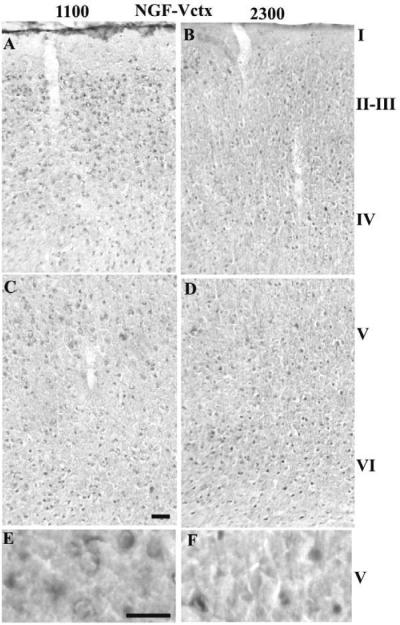
The number of NGF-IR neurons in the Sctx and the Vctx was similar at both times of day (Table 1). In the layer V pyramidal neurons, a significant higher density was observed at 2300 (11.7 ± 1.7) relative to 1100 (6.3 ± 1.0; p = 0.008). The number of NGF-IR neurons was greater in the Vctx than the Sctx in layers II–III and VI (Table 1 and Fig. 6). The density of the NGF-IR neurons was greater in the Vctx at 1100 relative to 2300.
Fig. 6. NGF-IR neurons in the Vctx at 1100 (light) or 2300 (dark).
The number of NGF-IR neurons increased in layers II–IV of the Vctx when comparing 2300 h (B) with 1100 h (A). No differences were observed in layers V–VI between 1100 (C & E) and 2300 (D & F). Bar = 0.05 mm for A–D; Bar =0.025 mm for E&F.
2.4 Neu-N-IR cells at 1100 h or 2300 h
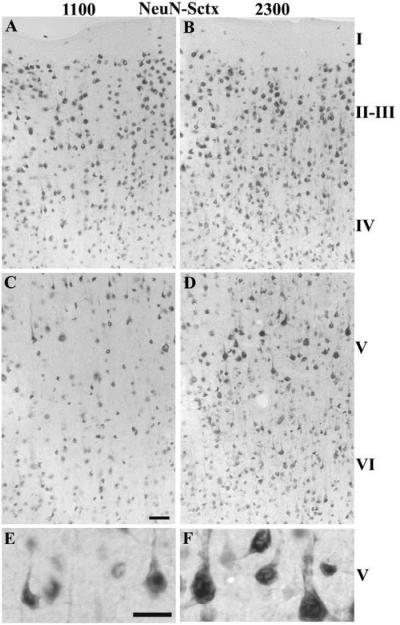
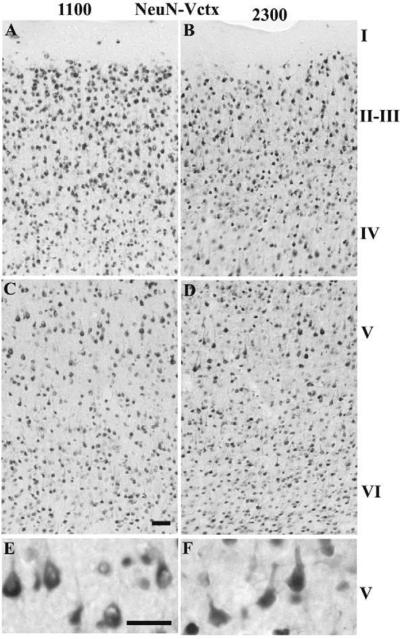
In the Vctx, the number of NeuN-IR cells differed from the Sctx in all of the layers. There were no significant differences in time of day for the NeuN-IR cells; however there was a significant interaction between brain regions and time of day for layers IV–VI. In the Sctx, the number of Neu-N-IR cells was higher at 2300 h relative to 1100 h in layers IV–VI (Table 1A & Fig. 7) and in the Vctx, the number of NeuN-IR cells in layers IV–V was greater at 1100 h relative to 2300 h (Table 1B & Fig. 8).
Fig. 7. NeuN-IR neurons in the Sctx at 1100 (light) or 2300 (dark).
The number of NeuN-IR neurons increased in layers II–VI of the Sctx when comparing 2300 h (B, D, F) with 1100 h (A, C, & E). The NeuN-IR neurons in layer IV are more densely distributed at 2300 h and the large NeuN-IR pyramidal neurons in layer V appear more densely labeled. Bar = 0.05 mm for A–D; Bar =0.025 mm for E&F.
Fig. 8. NeuN-IR neurons in the Vctx at 1100 (light) or 2300 (dark).
The number of NeuN-IR neurons increased in layers IV–V of the Vctx when comparing 2300 h (B, D, F) with 1100 h (A, C, & E). The NeuN-IR neurons in layer II–IV appear more densely distributed and there are more large NeuN-IR pyramidal neurons in layer V. Bar = 0.05 mm for A–D; Bar =0.025 mm for E&F.
2.5 Fos-IR cells at 1100 h (end of the light period) or 2300 h (end of the dark period)
As previously observed in other publications, the number of Fos-IR cells was significantly higher at 2300 h compared to 1100 h in both the Sctx and Vctx. These increases occurred in all of the layers of the Sctx in both cortices (Table 1). There was also a significantly greater number of Fos-IR cells in the Vctx relative to the Sctx in layers V and VI.
3. Discussion
The main finding reported herein is that the cytokines, TNFα and IL1β, show a greater number of immunoreactive cells within both the Sctx and Vctx at the end of the active period relative to the end of the sleep cycle. . There were also greater numbers of darkly TNFα- and IL1β-stained cells in the Vctx than in the Sctx in most of the layers for both time periods. Circadian processes may also influence the levels of TNFα- and IL1β-IR in neurons. Both IL1β and TNFα interfere with the BMAL/Clock interaction with Cry1,2 and Per1 and 2 (Cavadini et al., 2007). In rats, a well known suprachiasmatic nucleus (SCN) zeitgaber is light. In contrast, the SCN is not the site of the food-entrainable oscillator and whisker stimulation, since it occurs during feeding, may have a greater influence on that oscillator. The site of that oscillator remains controversial (see Mistlberger et al., 2009). Further, mice lacking the IL1 type I receptor have less spontaneous sleep during the dark hours and the transition to light (Fang et al., 1998) where as mice lacking the TNF 55 kD receptor have less sleep mostly during the transition from light to dark and into the first few hours of light (Fang et al., 1997). These studies suggest slightly different time-of-day sensitivities of IL1β and TNFα and are thus consistent with the current findings.
A second finding is that IL1β-IR astrocytes increase in the dark relative to light. Microglial cells and astrocytes are known for their capacity to express IL1β (Eriksson et al., 1999; Konsman et al., 1999; Yasuda et al., 2007). IL1β-IR astrocytes occur mainly in layers I & VI (Yasuda et al., 2007). Although lightly-stained for IL1β, pyramidal-shaped neurons were observed in layer V in those rats; the Yasuda (2007) study was done at the end of the light period, a time that the current study showed that layer V IL1β-IR levels are at a low level. Previously we also showed that IL1β-IR astrocytes increase with whisker stimulation (Hallett et al., in press); those findings are consistent with the current findings because in the dark rats often eat and move about and both of these activities are associated with whisker stimulation.
That the number of NGF-IR neurons failed to change in the Sctx during the dark relative to the light was unexpected. The number of NGF-IR Sctx neurons increases during sleep deprivation (Brandt et al., 2001). That finding suggests that NGF is activity-dependent because sleep loss enhances neuronal activity (Vyazovskiy et al., 2009). However, since the density of Sctx NGF-IR neurons in layer V increases during the dark period, then the NGF levels within these larger neurons do in fact increase with the increased whisker use. The finding that Vctx NGF-IR neurons increase during the light also supports the previous conclusions that NGF is activity-dependent.
The activity-dependency of NeuN is another finding of the current study. These results are consistent with a previous observation that the levels of NeuN increase with electrical stimulation in tissue culture (Mullen et al., 1992) and decrease with chronic depolarization in culture (Weyer and Schilling, 2003). The physiological function of NeuN is not known, but the low expression of NeuN in the dorsal SCN relative to other regions of the hypothalamus suggests that NeuN levels may relate to circadian function (Geoghegan and Carter, 2008).
Our finding of greater activity period expression of Fos-IR cells is consistent with prior reports describing greater, cfos mRNA and Fos protein expression during the wake cycle (dark) than in the sleep cycle (light) (Grassi-Zucconi et al., 1993; Pompeiano et al., 1994; Cirelli and Tononi, 2000; Semba et al., 2001). The cfos-jun dimer, called AP-1, increases the transcription of IL1β, IL6, and TNFα (O'Neill and Greene, 1998; Van Wagoner and Benveniste, 1999; Guha et al., 2000; Xiao et al., 2004). The redox-sensitive transcription factors, AP-1 and NF-κB are also induced by TNFα and IL1β (Benveniste and Benos, 1995; Guha et al., 2000). Therefore the increases in cfos mRNA and Fos protein during the wake state may be activating increases in the cytokine network in response to activity during the wake cycle.
After application of IL1β or TNFα onto the Sctx, Fos- and IL1β-IR cells are induced in the reticular thalamus, the somatic region of the reticular nucleus of the thalamus (Churchill et al., 2005; Yasuda et al., 2007). Furthermore, cortical application of IL1β up-regulates Fos-IR cells in hypothalamic regions implicated in sleep regulation, such as the ventrolateral preoptic area and dorsal median preoptic nucleus (Yasuda et al., 2007). Further, unilateral cortical application of SRSs, such as IL1β and TNFα, enhance EEG SWA on the ipsilateral side (Yoshida et al., 2004; Yasuda et al., 2005b). Those findings coupled with the time-of-day dependency of IL1β-IR and the whisker stimulation induced IL1β-IR suggest an endogenous local source of SRSs. Indeed, when rats are sleep deprived after unilateral whisker removal, the side ipsilateral to the cut whiskers received disproportionate sensory stimulation and exhibited enhanced EEG delta power in subsequent sleep (Vyazovskiy et al., 2000; 2002). Other studies indicate that greater cortical afferent input is associated with deeper subsequent sleep in the region receiving the input. For example, excessive right hand stimulation during wakefulness increases EEG SWA during subsequent sleep in the left cortex in human (Kattler et al., 1994). Since rats increase their tactile and whisker activity and decrease their visual input during the dark, Sctx relative EEG SWA is higher than that of the Vctx (Yasuda et al., 2005a). Conversely in the light, relative EEG SWA of the Vctx is higher than that of the Sctx. These data and current results emphasize the importance of prior activity for gene expression and state oscillations.
In conclusion, the present study provides direct evidence that two SRSs, TNFα and IL1β, are up-regulated in the Sctx during the wake period (dark), while Vctx NGF is sensitive to light. These findings also support the hypotheses that sleep is an activity-dependent local event regulated in part by Sctx and Vctx expression of SRSs.
4. Experimental Procedures
4.1 Animals
Male Sprague-Dawley rats weighing 250–400 g were obtained from Taconic Farm, Inc. (Germantown, NY). All rats were maintained on a 12:12-hour light-dark cycle (lights on at 0000 h) at 21–23±2°C ambient temperature. The rats were housed in pairs in polycarbonate cages with pine shavings. To avoid light entering from the hallway during the kills in the dark, a darkroom door was used for entry into the rat room. Water and standard rodent Lab Diet (5001) food were available ad libitum throughout the experiment. Seven rats were killed at 7 min intervals between 11 and 12 h or 23 and 24 h after light onset. The use of rats was in accordance with Washington State University (WSU) and international guidelines and was approved by the WSU Institutional Animal Care and Use Committee.
4.2 Time of Day Differences
Rats (n=14) were adapted to handling for at least 3 days prior to the kill. On the first adaptation day, the rats were allowed to smell the ungloved hands of the investigators; while on the following two days, the rats were picked up and allowed to explore the lab coats of the handling investigators. On the day of the kill, the rats were anesthetized and perfused as described (Churchill et al., 2008; Hallett et al., in press), except that the postfixation was for 6 h. Briefly, the rats were anesthetized within a saturated atmosphere of isoflurane inside a large glass chamber located inside a hood and cardiac perfused with warm 0.9% saline, followed by cold 4% paraformaldehyde.
4.3 Immunohistochemistry
Brains were sectioned coronally with a sliding microtome at 30 μm thickness and collected at 360 μm intervals for each antigen. Immunohistochemistry was performed as described previously (Churchill et al., 2005, 2008), using a polyclonal anti-human Fos antibody produced in rabbit (1:10,000; Calbiochem (Oncogene Research Products), San Diego, CA), goat anti-rat IL1β (0.5 μg/ml, R&D Systems, Inc., Minneapolis, MN), goat anti-rat TNFα (0.5 μg/ml, R&D Systems, Inc., Minneapolis, MN), rabbit anti-mouse NGF that cross reacts with rat NGF (1:2500 or 1:5000; Chemicon, Temecula, CA) or mouse monoclonal antibody to NeuN (1:500; Chemicon, Temecula, CA). After 3 days of incubation at 4°C with gentle rocking and washing three times in phosphate-buffered saline (PBS) for 10 min, the sections were incubated for 2 h in biotinylated secondary horse antibody to goat (for IL1β or TNFα), biotinylated secondary goat antibody to rabbit (NGF or Fos) or biotinylated secondary horse antibody to mouse (NeuN). Negative controls for the secondary antibodies were performed by omitting the primary antibody. The specificity of the NGF, Fos and NeuN antibodies were previously published (Zhang et al., 2007; Berghorn et al., 1994; Mullen et al., 1992). The specificity of the IL1β and TNFα antibodies were previously published (Churchill et al., 2008; Leyva-Grado et al., 2009; Hallett et al., in press).
4.4 Imaging and Quantitative analysis
The Sctx or monocular region of the Vctx was identified in the brain sections as demarcated in the rat brain atlas by Paxinos and Watson (2007). The digital photographs were prepared on a Leica DMLB microscope with a Spot camera for quantitative analysis. The digital images were adjusted using Adobe Photoshop, only in contrast and brightness. In the Spot camera software, a rectangular box was prepared using a transparent micron ruler for calibration and superimposed onto the digital images over each of the Sctx or Vctx layers. NGF-, Fos- and NeuN-stained sections were photographed with the 10× objective and two 0.5 mm × 0.2 mm boxes were added to each of the Sctx or Vctx layers. IL1β-stained sections were photographed with a 20× objective and one 0.5 mm × 0.2 mm box was added to each of the neuronal Sctx or Vctx layers or three 0.23 mm by 0.08 mm were added to the white matter layers. The numbers of NGF-, TNFα-, NeuN-, Fos- and IL1β-IR cells were counted for each layer at 5 mm lateral to the midline on both sides in the Sctx and 2 mm lateral to the midline on both sides in the monocular region of the Vctx. For each antigen, three different sections from both the Sctx or Vctx were photographed and the data were averaged. For the NGF-IR cells, layer V of the Sctx was analyzed for density of staining using the Image J program. Quantification was done by individuals blind to the experimental treatment.
4.5 Statistical Analyses
A two-way ANOVA was used to evaluate the differences in the number of immunoreactive cells between 1100 and 2300 and the differences between the Sctx and Vctx. Probability less than 0.05 was considered significant. If a significant interaction occurred, then the paired Student's t-test was used to evaluate the differences between 1100 and 2300.
Acknowledgements
We would like to acknowledge the assistance of Bryan Slinker for his advice on statistical analyses. This research was supported by the NIH grants to JM Krueger, NS25378 and NS31453.
List of abbreviations
- EEG
encephalographic
- IR
immunoreactivity, immunoreactive
- IL1β
interleukin-1 beta
- NGF
nerve growth factor
- NeuN
neuronal nuclear protein
- NREM
Non rapid eye movement sleep
- Sctx
somatosensory cortex
- SWA
slow wave activity
- TNFα
tumor necrosis factor alpha
- Vctx
visual cortex
Footnotes
Publisher's Disclaimer: This is a PDF file of an unedited manuscript that has been accepted for publication. As a service to our customers we are providing this early version of the manuscript. The manuscript will undergo copyediting, typesetting, and review of the resulting proof before it is published in its final citable form. Please note that during the production process errors may be discovered which could affect the content, and all legal disclaimers that apply to the journal pertain.
References
- Alföldi P, Franken P, Tobler I, Borbély AA. Short light-dark cycles influence sleep stages and EEG power spectra in the rat. Beh. Brain Res. 1991;43:25–31. doi: 10.1016/s0166-4328(05)80062-2. [DOI] [PubMed] [Google Scholar]
- Benington JH, Heller HC. Restoration of brain energy metabolism as the function of sleep. Prog. Neurobiol. 1995;45:347–360. doi: 10.1016/0301-0082(94)00057-o. [DOI] [PubMed] [Google Scholar]
- Benveniste EN, Benos DJ. TNF-alpha- and IFN-gamma-mediated signal transduction pathways: effects on glial cell gene expression and function. FASEB J. 1995;9:577–584. doi: 10.1096/fasebj.9.15.8529837. [DOI] [PubMed] [Google Scholar]
- Berghorn KA, Bonnett JH, Hoffman GE. cFos immunoreactivity is enhanced with biotin amplification. J. Histochem. Cytochem. 1994;42:1635–1642. doi: 10.1177/42.12.7983364. [DOI] [PubMed] [Google Scholar]
- Boulanger LM, Poo MM. Presynaptic depolarization facilitates neurotrophin-induced synaptic potentiation. Nat. Neurosci. 1999;2:346–351. doi: 10.1038/7258. [DOI] [PubMed] [Google Scholar]
- Brandt JA, Churchill L, Guan Z, Fang J, Chen L, Krueger JM. Sleep deprivation but not a whisker trim increases nerve growth factor within barrel cortical neurons. Brain Res. 2001;898:105–112. doi: 10.1016/s0006-8993(01)02149-7. [DOI] [PubMed] [Google Scholar]
- Cavadini G, Petrzilka S, Kohler P, Jud C, Tobler I, Birchler T, Fontana A. TNF-alpha suppresses the expression of clock genes by interfering with E-box-mediated transcription. Proc. Natl. Acad. Sci. U S A. 2007;104:12843–12848. doi: 10.1073/pnas.0701466104. [DOI] [PMC free article] [PubMed] [Google Scholar]
- Churchill L, Yasuda K, Yasuda T, Blindheim KA, Falter M, Garcia-Garcia F, Krueger JM. Unilateral cortical application of tumor necrosis factor alpha induces asymmetry in Fos- and interleukin-1beta-immunoreactive cells within the corticothalamic projection. Brain Res. 2005;1055:15–24. doi: 10.1016/j.brainres.2005.06.052. [DOI] [PubMed] [Google Scholar]
- Churchill L, Rector DM, Yasuda K, Fix C, Rojas MJ, Yasuda T, Krueger JM. Tumor necrosis factor a: Activity dependent expression and promotion of cortical column sleep in rats. Neuroscience. 2008;156:71–80. doi: 10.1016/j.neuroscience.2008.06.066. [DOI] [PMC free article] [PubMed] [Google Scholar]
- Cellerino A, Maffei L. The action of neurotrophins in the development and plasticity of the visual cortex. Prog. Neurobiol. 1996;49:53–71. doi: 10.1016/0301-0082(96)00008-1. [DOI] [PubMed] [Google Scholar]
- Cirelli C, Tononi G. Gene expression in the brain across the sleep-waking cycle. Brain Res. 2000;885:303–321. doi: 10.1016/s0006-8993(00)03008-0. [DOI] [PubMed] [Google Scholar]
- Eriksson C, Van Dam AM, Lucassen PJ, Bol JG, Winblad B, Schultzberg M. Immunohistochemical localization of interleukin-1beta, interleukin-1 receptor antagonist and interleukin-1beta converting enzyme/caspase-1 in the rat brain after peripheral administration of kainic acid. Neuroscience. 1999;93:915–930. doi: 10.1016/s0306-4522(99)00178-5. [DOI] [PubMed] [Google Scholar]
- Fang J, Wang Y, Krueger JM. Mice lacking the TNF 55 kDa receptor fail to sleep more after TNFalpha treatment. J. Neurosci. 1997;17:5949–5955. doi: 10.1523/JNEUROSCI.17-15-05949.1997. [DOI] [PMC free article] [PubMed] [Google Scholar]
- Fang J, Wang Y, Krueger JM. Effects of interleukin-1 beta on sleep are mediated by the type I receptor. Am. J. Physiol. 1998;274:R655–R660. doi: 10.1152/ajpregu.1998.274.3.R655. [DOI] [PubMed] [Google Scholar]
- Geoghegan D, Carter DA. A novel site of adult doublecortin expression: neuropeptide neurons within the suprachiasmatic nucleus circadian clock. BMC Neurosci. 2008;9:1–9. doi: 10.1186/1471-2202-9-2. [DOI] [PMC free article] [PubMed] [Google Scholar]
- Grassi-Zucconi G, Menegazzi M, De Prati AC, Bassetti A, Montagnese P, Mandile P, Cosi C, Bentivoglio M. c-fos mRNA is spontaneously induced in the rat brain during the activity period of the circadian cycle. Eur. J. Neurosci. 1993;5:1071–1078. doi: 10.1111/j.1460-9568.1993.tb00960.x. [DOI] [PubMed] [Google Scholar]
- Guha M, Bai W, Nadler JL, Natarajan R. Molecular mechanisms of tumor necrosis factor alpha gene expression in monocytic cells via hyperglycemia-induced oxidant stress-dependent and -independent pathways. J. Biol. Chem. 2000;275:17728–17739. doi: 10.1074/jbc.275.23.17728. [DOI] [PubMed] [Google Scholar]
- Hallett H, Churchill L, Taishi P, De A, Krueger JM. Whisker stimulation increases expression of nerve growth factor and interleukin-1β immunoreactivity in the rat somatosensory cortex. Brain Res. 2010 doi: 10.1016/j.brainres.2010.03.048. in Press. [DOI] [PMC free article] [PubMed] [Google Scholar]
- Kattler H, Dijk DJ, Borbély AA. Effect of unilateral somatosensory stimulation prior to sleep on the sleep EEG in humans. J. Sleep Res. 1994;3:159–164. doi: 10.1111/j.1365-2869.1994.tb00123.x. [DOI] [PubMed] [Google Scholar]
- Kavanau JL. Sleep and dynamic stabilization of neural circuitry: a review and synthesis. Behav. Brain Res. 1994;63:111–126. doi: 10.1016/0166-4328(94)90082-5. [DOI] [PubMed] [Google Scholar]
- Konsman JP, Kelley K, Dantzer R. Temporal and spatial relationships between lipopolysaccharide-induced expression of Fos, interleukin-1beta and inducible nitric oxide synthase in rat brain. Neuroscience. 1999;89:535–548. doi: 10.1016/s0306-4522(98)00368-6. [DOI] [PubMed] [Google Scholar]
- Krueger JM, Obal F., Jr. A neuronal group theory of sleep function. J. Sleep Res. 1993;2:63–69. doi: 10.1111/j.1365-2869.1993.tb00064.x. [DOI] [PubMed] [Google Scholar]
- Krueger JM, Rector DM, Roy S, Van Dongen HP, Belenky G, Panksepp J. Sleep as a fundamental property of neuronal assemblies. Nat. Rev. Neurosci. 2008;9:910–919. doi: 10.1038/nrn2521. [DOI] [PMC free article] [PubMed] [Google Scholar]
- Levi-Montalcini R. The nerve growth factor: its mode of action on sensory and sympathetic nerve cells. Harvey Lect. 1966;60:217–259. [PubMed] [Google Scholar]
- Leyva-Grado VH, Churchill L, Wu M, Williams TJ, Taishi P, Majde JA, Krueger JM. Influenza virus- and cytokine-immunoreactive cells in the murine olfactory and central autonomic nervous systems before and after illness onset. J. Neuroimmunol. 2009;211:73–83. doi: 10.1016/j.jneuroim.2009.03.016. [DOI] [PMC free article] [PubMed] [Google Scholar]
- Majde JA, Krueger JM. Links between the innate immune system and sleep. J. Allergy Clin. Immunol. 2005;116:1188–1198. doi: 10.1016/j.jaci.2005.08.005. [DOI] [PubMed] [Google Scholar]
- Mistlberger RE. Food-anticipatory circadian rhythms: concepts and methods. Eur. J. Neurosci. 2009;30:1718–1729. doi: 10.1111/j.1460-9568.2009.06965.x. [DOI] [PubMed] [Google Scholar]
- Montero VM. c-fos induction in sensory pathways of rats exploring a novel complex environment: shifts of active thalamic reticular sectors by predominant sensory cues. Neuroscience. 1997;76:1069–1081. doi: 10.1016/s0306-4522(96)00417-4. [DOI] [PubMed] [Google Scholar]
- Mullen RJ, Buck CR, Smith AM. NeuN, a neuronal specific nuclear protein in vertebrates. Development. 1992;116:201–211. doi: 10.1242/dev.116.1.201. [DOI] [PubMed] [Google Scholar]
- O'Neill LA, Greene C. Signal transduction pathways activated by the IL-1 receptor family: ancient signaling machinery in mammals, insects, and plants. J. Leukoc. Biol. 1998;63:650–657. [PubMed] [Google Scholar]
- Paxinos G, Watson C. The rat brain in stereotaxic coordinates. 6th edition Elsevier Academic Press; San Diego, CA: 2007. [Google Scholar]
- Pompeiano M, Cirelli C, Tononi G. Immediate-early genes in spontaneous wakefulness and sleep: expression of c-fos and NGFI-A mRNA and protein. J. Sleep Res. 1994;3:80–96. doi: 10.1111/j.1365-2869.1994.tb00111.x. [DOI] [PubMed] [Google Scholar]
- Semba K, Pastorius J, Wilkinson M, Rusak B. Sleep deprivation-induced c-fos and junB expression in the rat brain: effects of duration and timing. Behav. Brain Res. 2001;120:75–86. doi: 10.1016/s0166-4328(00)00362-4. [DOI] [PubMed] [Google Scholar]
- Thoenen H. Neurotrophins and activity-dependent plasticity. Prog. Brain Res. 2000;128:183–191. doi: 10.1016/S0079-6123(00)28016-3. [DOI] [PubMed] [Google Scholar]
- Tononi G, Cirelli C. Sleep and synaptic homeostasis: a hypothesis. Brain Res. Bull. 2003;62:143–150. doi: 10.1016/j.brainresbull.2003.09.004. [DOI] [PubMed] [Google Scholar]
- Van Wagoner NJ, Benveniste EN. Interleukin-6 expression and regulation in astrocytes. J. Neuroimmunol. 1999;100:124–139. doi: 10.1016/s0165-5728(99)00187-3. [DOI] [PubMed] [Google Scholar]
- Vyazovskiy V, Borbély AA, Tobler I. Unilateral vibrissae stimulation during waking induces interhemispheric EEG asymmetry during subsequent sleep in the rat. J. Sleep Res. 2000;9:367–371. doi: 10.1046/j.1365-2869.2000.00230.x. [DOI] [PubMed] [Google Scholar]
- Vyazovskiy V, Borbély AA, Tobler I. Interhemispheric sleep EEG asymmetry in the rat is enhanced by sleep deprivation. J. Neurophysiol. 2002;88:2280–2286. doi: 10.1152/jn.00304.2002. [DOI] [PubMed] [Google Scholar]
- Vyazovskiy VV, Olcese U, Lazimy YM, Faraguna U, Esser SK, Williams JC, Cirelli C, Tononi G. Cortical firing and sleep homeostasis. Neuron. 2009;63:865–878. doi: 10.1016/j.neuron.2009.08.024. [DOI] [PMC free article] [PubMed] [Google Scholar]
- Weyer A, Schilling K. Developmental and cell type-specific expression of the neuronal marker NeuN in the murine cerebellum. J. Neurosci Res. 2003;73:400–409. doi: 10.1002/jnr.10655. [DOI] [PubMed] [Google Scholar]
- Xiao W, Hodge DR, Wang L, Yang X, Zhang X, Farrar WL. NF-kappaB activates IL-6 expression through cooperation with c-Jun and IL6-AP1 site, but is independent of its IL6-NFkappaB regulatory site in autocrine human multiple myeloma cells. Cancer Biol. Ther. 2004;3:1007–1017. doi: 10.4161/cbt.3.10.1141. [DOI] [PubMed] [Google Scholar]
- Yasuda K, Churchill L, Yasuda T, Blindheim K, Falter M, Krueger JM. Unilateral cortical application of interleukin-1β (IL1β) induces asymmetry in fos, IL1β and nerve growth factor immunoreactivity: Implications for sleep regulation. Brain Res. 2007;1131:44–59. doi: 10.1016/j.brainres.2006.11.051. [DOI] [PubMed] [Google Scholar]
- Yasuda T, Yasuda K, Brown RA, Krueger JM. State-dependent effects of light-dark cycle on somatosensory and visual cortex EEG in rats. Am. J. Physiol.Regul. Integr. Comp. Physiol. 2005a;289:R1083–R1089. doi: 10.1152/ajpregu.00112.2005. [DOI] [PubMed] [Google Scholar]
- Yasuda T, Yoshida H, Garcia-Garcia F, Kay D, Krueger JM. Interleukin-1β has a role in cerebral cortical state-dependent electroencephalographic slow-wave activity. Sleep. 2005b;28:177–184. doi: 10.1093/sleep/28.2.177. [DOI] [PubMed] [Google Scholar]
- Yoshida H, Peterfi Z, Garcia-Garcia F, Kirkpatrick R, Yasuda T, Krueger JM. State-specific asymmetries in EEG slow wave activity induced by local application of TNF alpha. Brain Res. 2004;1009:129–136. doi: 10.1016/j.brainres.2004.02.055. [DOI] [PubMed] [Google Scholar]
- Zhang HT, Li LY, Zou XL, Song XB, Hu YL, Feng ZT, Wang TT. Immunohistochemical distribution of NGF, BDNF, NT-3, and NT-4 in adult rhesus monkey brains. J. Histochem. Cytochem. 2007;55:1–19. doi: 10.1369/jhc.6A6952.2006. [DOI] [PubMed] [Google Scholar]


