

Abstract
BACKGROUND
Determination of left ventricular hypertrophy (LVH) via electrocardiogram (ECG) is a known independent risk factor for cardiovascular morbidity and mortality in hypertension. Dietary sodium and hypertension are both associated with unfavorable alterations in left ventricular mass, however to what extent their interplay affects ECG screening for LVH is unclear.
METHODS
The effects of controlled dietary sodium manipulation on ECG determinants of LVH in hypertensive subjects were evaluated using well established voltage criteria for LVH. ECG’s from 80 hypertensive subjects were evaluated following random sequence assignment to 7 days of high sodium (HS) intake (200 mEq/24h), and then 7 days of low sodium (LS) intake (10 mEq/24h).
RESULTS
Sodium restriction over 7 days resulted in significant decreases in overall, and LVH-specific, ECG voltages. Most subjects (72%) exhibited decrements in overall ECG voltage with sodium restriction, but a smaller minority (28%) displayed higher voltages when on LS intake (28%). The prevalence of ECG-determined LVH significantly declined with LS diet (HS diet 22/80 [28%] vs. LS diet 8/80 [10%], p<0.05). Subjects exhibiting reversal of LVH status with sodium restriction were younger, demonstrated salt-sensitivity of blood pressure, and lower LVH-specific ECG voltage.
CONCLUSIONS
Short-term dietary sodium fluctuations can significantly alter overall ECG voltage and the prevalence of ECG-determined LVH in hypertensive individuals. Inclusion of dietary sodium assessment when screening hypertensive subjects for LVH by ECG may improve the consistency of cardiac risk assessment.
Keywords: Left Ventricular Hypertrophy, Hypertension, Electrocardiogram, Sodium, Diet, Voltage
The electrocardiogram (ECG) is a specific, but poorly sensitive tool for diagnosing left ventricular hypertrophy (LVH)1–3. Despite this relative insensitivity, it is still extensively used as a primary screening modality for LVH. The impetus for this lies in decades of research consistently establishing LVH on the ECG as a potent independent risk factor for death and cardiovascular disease (CVD) outcomes4–7. Data from the Framingham cohort and LIFE studies have shown improvement of CVD risk when LVH features regress on the ECG of subjects with hypertension (HTN), and worsening risk with their progression, underscoring the relevance of early risk assessment in the hypertensive population7–9.
Restriction of dietary sodium stimulates the renin-angiotensin-aldosterone system (RAAS), yet is associated with decreased prevalence of HTN and subsequent CVD outcomes10, 11. Evidence supporting the association between salt intake and HTN has been well established10, 12, however dietary sodium intake is also a blood pressure independent determinant of left ventricular mass in HTN13–15. This intertwined relationship highlights the role of both dietary sodium and HTN in adverse cardiac structural adaptation. Echocardiographic studies have demonstrated regression of left-ventricular mass with prolonged sodium restriction, illustrating the plasticity of ventricular structural geometry when dietary sodium is modulated13, 14, 16–19. These dietary sodium dependent left ventricular structural changes have been described predominantly using echocardiography, however, rigorous studies evaluating the influence of acute changes in dietary sodium on LVH determined by ECG criteria are lacking.
We postulate that acute variations in dietary sodium intake may alter ECG voltage, and influence the detection of LVH on ECG, thus potentially interfering with consistent cardiovascular risk assessment on primary screening. Here we describe the evaluation of electrocardiographic LVH features in subjects with HTN undergoing controlled, short-term, dietary sodium manipulation.
METHODS
Participants
At the time of this analysis, a total of 558 hypertensive subjects had participated in the HyperPath Project, designed to characterize the genetic underpinnings of cardiovascular disease in an international cohort of patients with stage I and mild stage II hypertension. The characteristics, inclusion, and exclusion criteria of this population have been described previously20–22. ECG’s were obtained from 80 unrelated hypertensive subjects from this population (see protocol below). As part of this study, approval was obtained from each institution’s Human Research Committee and informed consent obtained from each subject prior to enrollment.
Protocol
Subjects with suggested or known secondary causes of hypertension were excluded as per the original protocol design. Subjects were withdrawn of all anti-hypertensive medications two weeks prior to study initiation. At the initiation of the study, all participants were randomized to a high sodium (HS) diet, 200 mEq/24h, or low sodium (LS) diet, 10 mEq/24h, for 7 days and then crossed over to the opposite diet for an additional 7 days. Diets were prepared by the metabolic kitchen of the center’s General Clinical Research Center. External sodium balance and compliance on both diets was confirmed with 24-hour urine collections for creatinine and sodium at the end of each study week. HS diet required a 24-hour urinary sodium excretion > 180 mEq/24h and LS diet < 30 mEq/24h.
At the end of each diet period, subjects were admitted to the General Clinical Research Center for 1 night and 1 day and underwent blood pressure measurement and biochemical analyses. ECG’s were obtained from subjects at the end of each dietary period. Because the specific study design was to address the influence of controlled dietary sodium intake on ECG voltage, ECG’s were not obtained at study commencement in order to avoid the potential variability of sodium intake on an ad lib diet23. Blood pressure used in the analysis was obtained while supine, in the morning, following 10 h of overnight rest using the average of five readings from an indirect recording sphygmomanometer.
ECG Analysis
ECG’s obtained at the end of each diet period were analyzed for the presence of LVH. For each subject, QRS voltage height was measured in all leads to the nearest 0.05 mV. LVH was determined based on established criteria, and considered present if any or all of the following 3 criteria were met: 1) SV1 + RV5 or RV6 ≥ 3.5 mV (Sokolow-Lyon), 2) SV3 + RaVL ≥ 2.8 mV (Cornell in men) or SV3 + RaVL ≥ 2.0 mV (Cornell in women), or 3) RaVL > 1.1 mV. These LVH criteria were chosen based on their established use in the literature1–3, 24, 25, and because their inclusion of pre-cordial and limb leads minimizes the role of lead placement variability in ECG interpretation. ECG’s were initially assessed by an observer not blinded to dietary interventions. Subsequently, a second observer blinded to diet interventions provided independent assessment of ECG voltage. Intra-observer and inter-observer variability of ECG voltage interpretation were very low (CV% = 1.9% and 3.6% respectively). Both observers demonstrated concordance in the detection of LVH.
Laboratory Analyses
Blood samples were collected on ice and centrifuged for 20 min. Samples were stored at −20°C without preservatives until assayed. Plasma renin activity (PRA), serum aldosterone concentration, sodium, potassium and creatinine were measured as previously described, after at least 3 weeks of medication washout20.
Statistical Analysis
All data are presented as mean values ± standard error of means. Homogeneity testing was performed to assess possible differences across the study sites before proceeding with pooled analysis. Paired t-tests were used to compare means within subjects (HS vs. LS interventions). Student’s t-tests were used to compare means between independent populations. For the analysis of aldosterone and PRA measurements, which are not normally distributed, we used the non-parametric tests Wilcoxon Signed Ranks Test and Mann-Whitney U test when appropriate. Chi square tests were used to detect statistical differences between group frequencies. The level for significance for all tests conducted was set at α=0.05. Pearson correlation estimates were used to investigate the relationship between the change in ECG voltage and change in systolic blood pressure with dietary modulation (HS minus LS), followed by partial correlation estimates to account for baseline HS diet blood pressure. Data analyses were performed using Statistical Package for Social Sciences, version 15 (SPSS, Inc., Chicago, IL, USA).
RESULTS
Study Population
Characteristics of the study population are displayed in Table 1. Males represented 45% of the 80 total subjects. As anticipated, sodium restriction resulted in significant decreases in mean blood pressure, and stimulation of PRA and aldosterone.
Table 1.
Characteristics of hypertensive subjects at the end of each dietary week
| Total Patients | N=80 | |
|---|---|---|
| Males | 36 (45%) | |
| Females | 44 (55%) | |
| White | 67 (84%) | |
| Black | 13 (16%) | |
| Age (yrs) | 48.8 ± 0.9 | |
| HS | LS | |
| BMI (kg/m2) | 26.9 ± 0.4 | 26.0 ± 0.4* |
| Mean SBP (mmHg) | 156 ± 1 | 141 ± 3* |
| Mean DBP (mmHg) | 90 ± 1 | 82 ± 2* |
| Mean Aldosterone (ng/dL) | 5.65 [3.7, 9.5] | 16.5 [9.8, 25.0]*§ |
| Mean PRA (ng/mL/hr) | 0.60 [0.20, 0.95] | 1.30 [0.80, 2.55]*§ |
| Urine Potassium (mEq/24h) | 65.0 ± 2.4 | 68.9 ± 2.8* |
| Urine Sodium (mEq/24h) | 187 ± 7.9 | 15.0 ± 7.9* |
BMI – Body Mass Index
DBP = Diastolic Blood Pressure
HS= High Dietary Sodium
LS = Low Dietary Sodium
PRA = Plasma Renin Activity
SBP = Systolic Blood Pressure
p<0.01,
reported as median and interquartile ranges
ECG Features
Mean total ECG voltage (sum of R+S in all leads) was appreciably lower following 1 week of LS consumption (HS: 14.4 ± 0.4 mV vs. LS: 13.5 ± 0.4 mV, p<0.001) as seen in Figure 1. The large majority of subjects exhibited higher mean total ECG voltage when on HS intake (72%), while a smaller proportion (28%) displayed a higher mean total ECG voltage when on LS diet. Individuals who demonstrated decreased mean total ECG voltage in response to LS diet tended to also have greater decrements in systolic blood pressure with LS diet when compared to individuals with increasing ECG voltage on LS diet (ΔSBP: −16.4 ± 2.2 mmHg vs. −10.2 ± 3.1 mmHg, p=0.11). No significant differences in age, BMI, change in aldosterone or PRA, were observed between subjects who had increased, versus decreased, voltage with LS intake.
Figure 1. Sodium Dependent Voltage Changes.
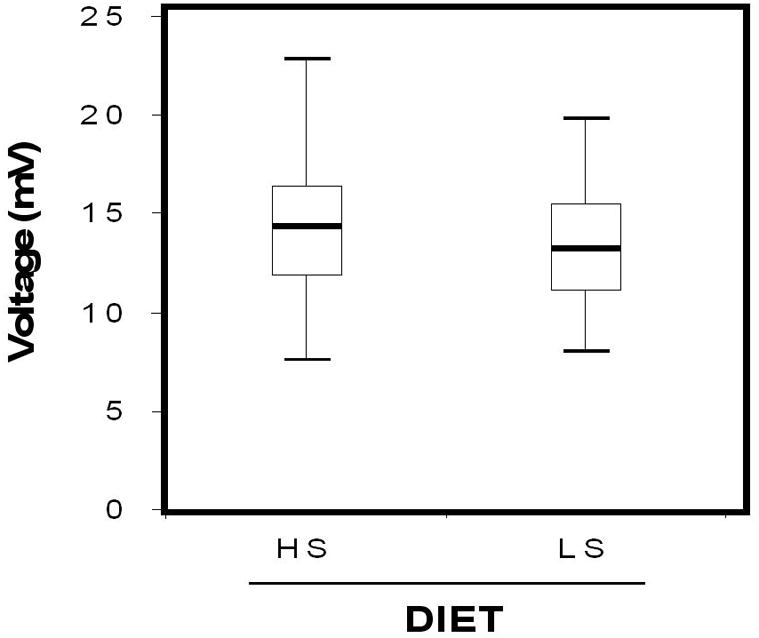
Box plots comparing total ECG voltage (sum of all R + S waves) between HS and LS diets. Boxes depict voltages within the 25th–75th percentiles, whiskers denote the largest non-outlier voltages within 1.5 fold the interquartile range, and the line depicts median voltage.
No significant relationship between the change in systolic blood pressure and the change in mean total ECG voltage was observed with sodium restriction (r=0.13, P=0.27), even when accounting for baseline HS systolic blood pressure (r=0.12, P=0.28). Similarly, no positive association was observed between changes in blood pressure and changes in any of the individual LVH voltage criteria.
When established LVH voltage criteria were evaluated between diets, LS intake was associated with significantly lower mean LVH voltages in both genders and study races (aVL HS: 0.61 ± 0.04 mV vs LS: 0.48 ± 0.04 mV, p<0.001; Sokolow-Lyon HS: 2.60 ± 0.1 mV vs LS: 2.40 ± 0.1 mV, p<0.001; Cornell Males HS: 1.59 ± 0.13 mV vs LS: 1.44 ± 0.12 mV, p<0.05; Cornell Females HS: 1.35 ± 0.07 mV vs LS: 1.18 ± 0.07 mV, p<0.05) (Figure 2).
Figure 2. LVH-Specific Voltage Changes.
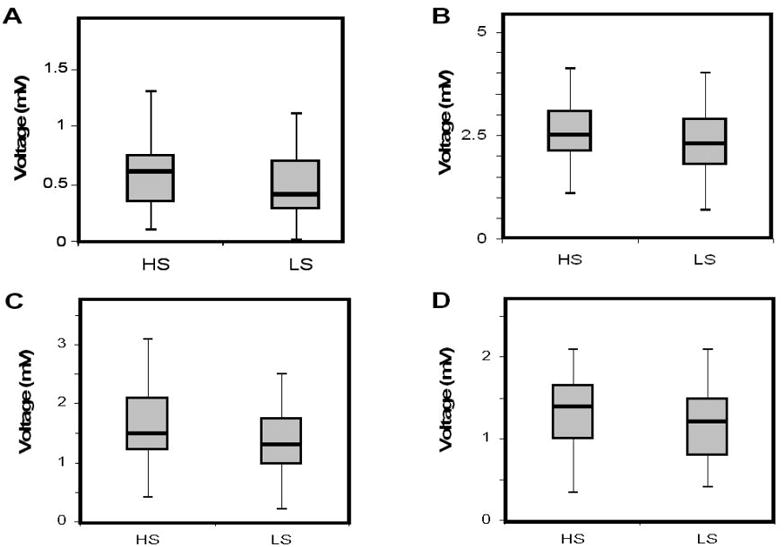
Box plots depicting specific ECG voltage criteria for LVH between HS and LS diets. A) aVL voltage, B) Sokolow-Lyon voltage, C) Cornell voltage for males, D) Cornell voltage for females.
Prevalence of LVH
LVH was identified in 22 of 80 subjects (28%) following HS diet. With LS intake, 14 of these 22 individuals no longer met criteria for LVH, while the remaining 8 continued to meet ECG-determined LVH, decreasing the prevalence of LVH from 28% to 10% following LS conditions (p<0.05).
The 8 subjects who met criteria for LVH on ECG on both HS and LS diets were labeled as having “Persistent-LVH”, while the 14 subjects whose ECG-defined LVH receded with LS diet were termed as having “Responsive-LVH.” Both Persistent and Responsive-LVH groups had similar distributions of gender, race, and body-mass index, however the Responsive-LVH subset was significantly younger (45.4 ± 2.0 y, vs. 51.1 ± 2.1 y, p<0.05) and more likely to have salt-sensitive blood pressure, defined as a decrease in systolic blood pressure by greater than 10 mmHg with LS diet (11 of 14 [78%] with Responsive-LVH had salt-sensitive blood pressure, versus 3 of 8 [38%] with Persistent-LVH, p=0.053). Responsive-LVH status was associated with lower overall LVH-specific voltages than Persistent-LVH on HS diet, and demonstrated greater voltage reductions with sodium restriction, however this did not meet statistical significance.
DISCUSSION
We set forth to assess the effect of dietary sodium intake on electrocardiographic LVH in hypertensive subjects, and observed significant disparities in ECG voltages following controlled dietary manipulation. Sodium restricting hypertensives resulted in overall decreased mean ECG voltage, as well as decrements in individual well-established criteria for LVH. Additionally, the prevalence of LVH declined by nearly 3-fold with a short duration sodium restricted diet. While former studies have shown echocardiographic evidence of left-ventricular mass reduction with prolonged sodium restriction13, 16, our results are notable for several reasons. First, these findings were detected using electrocardiography, a modality known to be markedly less sensitive at detecting LVH than echocardiography, but far more commonly used for initial screening. Second, since LVH on ECG is known to confer an independent risk for CVD outcomes and mortality4–6, variations in detection akin to those we observed can impair accurate screening and risk-stratification of cardiovascular risk. Finally, the decline in the prevalence of LVH was observed after a brief intervention (7 days) of sodium restriction, suggesting even short-term fluctuations in salt consumption can lead to significant changes in screening ECG’s.
Average sodium consumption in Western countries is estimated to be ~2300–5500 mg/day23, 26, roughly the equivalent of our HS diet conditions. Consequently, HS ECG findings may represent baseline features for many patients, while the LS diet voltage reductions may reflect the predominant intervention arm of this study. The degree of sodium restriction on LS diet typically would not be encountered in the general population, but was deliberately selected in order to accentuate mean effect differences with smaller sample sizes.
The long-term benefits of dietary sodium restriction on cardiovascular health have been reported previously in the DASH and TOHP trials10, 11, and in separate reports, Framingham and LIFE investigators have described the favorable implications of long-term electrocardiographic LVH voltage reduction on cardiovascular risk prognosis8, 9. Our demonstration of short-term sodium modulation acutely altering the prevalence of detectable LVH on ECG is a unique observation that introduces new angles into the relationship between sodium intake and cardiovascular physiology. Hypothesizing the basis of this phenomenon is worthy of consideration. While many factors can contribute to perceived LVH on an ECG, prior investigations by Antman et al. have elegantly shown that the fundamental influence on voltage detection by surface ECG electrodes involves the product of myocardial wall thickness (h) and ventricular chamber diameter (R)27. It is plausible that the variable component of voltage quantification in our short study reflects increased ventricular chamber diameter with HS diet. This potentially explains the significantly decreased voltages seen following LS diet: fixed myocardial wall thickness coupled with decreased ventricular chamber diameter would result in a decreased product h × R, and hence reduced detectable surface electrode voltage.
Conversely, approximately 30% of subjects demonstrated an increased mean total ECG voltage when sodium restricted, suggesting that intravascular volume alterations as a result of fluctuating sodium status may not be the only mechanism contributing to electrocardiographic LVH. There may be a differential blood pressure response to dietary sodium involved in this observation, however our small sample size limits more detailed analysis. This potential mechanistic heterogeneity warrants future study with larger power, and echocardiographic techniques to assist in quantifying contributions by volume, and intrinsic myocardial structure. Reports from small animal studies have shown measurable cardiac structural hypertrophy with short duration pressure overload28–31. To what extent, if any, acute myocyte hypertrophy plays in our observed ECG voltage changes is not clear.
The mechanism for the apparent dichotomy in response to dietary sodium restriction (Responsive vs Persistent) within subjects with LVH under HS conditions remains speculative at this stage. The Responsive-LVH subset tended to be younger, exhibited increased salt-sensitivity of blood pressure, and appeared to have lower absolute ECG voltages (a trait that has been shown to confer lower cardiovascular risk8) on both diets when compared to the Persistent-LVH group. A potential hypothesis for this observation is that hypertensive subjects with sodium-responsive LVH on ECG (Responsive-LVH) have a relatively superior ventricular compliance, however, larger population size, imaging studies, and hemodynamic measurements would be required to support this theory.
Notable limitations to our study include its small number of participants and their heterogeneous racial distribution, however all of our voltage observations carried similar trends on gender and racial comparisons. The duration of hypertension and the duration and type of anti-hypertensive therapy were not known, which could lead to confounding interpretations. The study protocol included a medication washout period to limit this effect. Although it is likely that our HS diet approximates typical western dietary sodium intake23, 26, we focused on studying only strictly controlled dietary interventions in order to reduce confounding of results from potentially variable ambulatory sodium intake12, 32. Accordingly, we did not obtain ECG’s prior to diet interventions. The hypertensive population was powered to effectively compare voltage changes and fluctuations in the prevalence of LVH; however the dietary sodium-dependent subsets that emerged thereafter were small enough to introduce some statistical error and are therefore speculative at this stage. The ability to compare the hypertensive data to a normotensive population has substantial merit when investigating whether the phenomenon of salt-sensitive voltage changes is unique to hypertensives. Further recruitment of normotensive subjects may aid in explaining the observed findings, and potentially elucidate explanations for this unique behavior. Despite the insensitivity of LVH assessment on ECG, this method has been repeatedly shown to be an effective research tool33, 34, however additional research using echocardiography would serve to confirm our findings, demonstrate their reproducibility, and shed light on underlying structural and geometric changes facilitating these observations.
In summary, our findings propose that absolute voltage, and the prevalence of LVH on ECG, may be substantially altered with short-term dietary sodium modulation. While prior studies have demonstrated regression of left ventricular mass with prolonged sodium restriction, our findings suggest that even acute sodium intake fluctuations may affect the interpretation of left ventricular mass by ECG. Inclusion of dietary sodium assessment when screening hypertensive subjects for LVH by ECG may improve the consistency of cardiac risk assessment.
Acknowledgments
We gratefully acknowledge Ms. Stacey Brown who assisted in data collection and analysis. The Brigham and Women’s Hospital General Clinical Research Center receives funding from the National Institutes of Health, National Center for Research Resources (M01 RR 02635). Additional funding support courtesy of National Institutes of Health grants K23 HL084236, K23 RR023333, HL47651, HL59424, HL77234, DK63214, Specialized Center of Research in Hypertension (HL55000).
Footnotes
Disclosure: There are no conflicts of interest
References
- 1.Reichek N, Devereux RB. Left ventricular hypertrophy: relationship of anatomic, echocardiographic and electrocardiographic findings. Circulation. 1981;63(6):1391–1398. doi: 10.1161/01.cir.63.6.1391. [DOI] [PubMed] [Google Scholar]
- 2.Levy D, Labib SB, Anderson KM, Christiansen JC, Kannel WB, Castelli WP. Determinants of sensitivity and specificity of electrocardiographic criteria for left ventricular hypertrophy. Circulation. 1990;81(3):815–820. doi: 10.1161/01.cir.81.3.815. [DOI] [PubMed] [Google Scholar]
- 3.Pewsner D, Juni P, Egger M, Battaglia M, Sundstrom J, Bachmann LM. Accuracy of electrocardiography in diagnosis of left ventricular hypertrophy in arterial hypertension: systematic review. Bmj. 2007;335(7622):711. doi: 10.1136/bmj.39276.636354.AE. [DOI] [PMC free article] [PubMed] [Google Scholar]
- 4.Kannel WB, Gordon T, Offutt D. Left ventricular hypertrophy by electrocardiogram. Prevalence, incidence, and mortality in the Framingham study. Ann Intern Med. 1969;71(1):89–105. doi: 10.7326/0003-4819-71-1-89. [DOI] [PubMed] [Google Scholar]
- 5.Gordon T, Kannel WB. Premature mortality from coronary heart disease. The Framingham study. Jama. 1971;215(10):1617–1625. [PubMed] [Google Scholar]
- 6.Kannel WB. Prevalence and natural history of electrocardiographic left ventricular hypertrophy. Am J Med. 1983;75(3A):4–11. doi: 10.1016/0002-9343(83)90111-0. [DOI] [PubMed] [Google Scholar]
- 7.Levy D, Garrison RJ, Savage DD, Kannel WB, Castelli WP. Left ventricular mass and incidence of coronary heart disease in an elderly cohort. The Framingham Heart Study. Ann Intern Med. 1989;110(2):101–107. doi: 10.7326/0003-4819-110-2-101. [DOI] [PubMed] [Google Scholar]
- 8.Levy D, Salomon M, D’Agostino RB, Belanger AJ, Kannel WB. Prognostic implications of baseline electrocardiographic features and their serial changes in subjects with left ventricular hypertrophy. Circulation. 1994;90(4):1786–1793. doi: 10.1161/01.cir.90.4.1786. [DOI] [PubMed] [Google Scholar]
- 9.Okin PM, Devereux RB, Jern S, Kjeldsen SE, Julius S, Nieminen MS, Snapinn S, Harris KE, Aurup P, Edelman JM, Wedel H, Lindholm LH, Dahlof B. Regression of electrocardiographic left ventricular hypertrophy during antihypertensive treatment and the prediction of major cardiovascular events. Jama. 2004;292(19):2343–2349. doi: 10.1001/jama.292.19.2343. [DOI] [PubMed] [Google Scholar]
- 10.Sacks FM, Svetkey LP, Vollmer WM, Appel LJ, Bray GA, Harsha D, Obarzanek E, Conlin PR, Miller ER, 3rd, Simons-Morton DG, Karanja N, Lin PH. Effects on blood pressure of reduced dietary sodium and the Dietary Approaches to Stop Hypertension (DASH) diet. DASH-Sodium Collaborative Research Group. N Engl J Med. 2001;344(1):3–10. doi: 10.1056/NEJM200101043440101. [DOI] [PubMed] [Google Scholar]
- 11.Cook NR, Cutler JA, Obarzanek E, Buring JE, Rexrode KM, Kumanyika SK, Appel LJ, Whelton PK. Long term effects of dietary sodium reduction on cardiovascular disease outcomes: observational follow-up of the trials of hypertension prevention (TOHP) Bmj. 2007;334(7599):885. doi: 10.1136/bmj.39147.604896.55. [DOI] [PMC free article] [PubMed] [Google Scholar]
- 12.Intersalt: an international study of electrolyte excretion and blood pressure. Results for 24 hour urinary sodium and potassium excretion. Intersalt Cooperative Research Group. Bmj. 1988;297(6644):319–328. doi: 10.1136/bmj.297.6644.319. [DOI] [PMC free article] [PubMed] [Google Scholar]
- 13.Ferrara LA, de Simone G, Pasanisi F, Mancini M, Mancini M. Left ventricular mass reduction during salt depletion in arterial hypertension. Hypertension. 1984;6(5):755–759. doi: 10.1161/01.hyp.6.5.755. [DOI] [PubMed] [Google Scholar]
- 14.Schmieder RE, Messerli FH, Garavaglia GE, Nunez BD. Dietary salt intake. A determinant of cardiac involvement in essential hypertension. Circulation. 1988;78(4):951–956. doi: 10.1161/01.cir.78.4.951. [DOI] [PubMed] [Google Scholar]
- 15.Du Cailar G, Ribstein J, Daures JP, Mimran A. Sodium and left ventricular mass in untreated hypertensive and normotensive subjects. Am J Physiol. 1992;263(1 Pt 2):H177–181. doi: 10.1152/ajpheart.1992.263.1.H177. [DOI] [PubMed] [Google Scholar]
- 16.Dahlof B, Pennert K, Hansson L. Reversal of left ventricular hypertrophy in hypertensive patients. A metaanalysis of 109 treatment studies. Am J Hypertens. 1992;5(2):95–110. doi: 10.1093/ajh/5.2.95. [DOI] [PubMed] [Google Scholar]
- 17.Dahlof B, Devereux RB, Kjeldsen SE, Julius S, Beevers G, de Faire U, Fyhrquist F, Ibsen H, Kristiansson K, Lederballe-Pedersen O, Lindholm LH, Nieminen MS, Omvik P, Oparil S, Wedel H. Cardiovascular morbidity and mortality in the Losartan Intervention For Endpoint reduction in hypertension study (LIFE): a randomised trial against atenolol. Lancet. 2002;359(9311):995–1003. doi: 10.1016/S0140-6736(02)08089-3. [DOI] [PubMed] [Google Scholar]
- 18.Koren MJ, Ulin RJ, Koren AT, Laragh JH, Devereux RB. Left ventricular mass change during treatment and outcome in patients with essential hypertension. Am J Hypertens. 2002;15(12):1021–1028. doi: 10.1016/s0895-7061(02)03061-3. [DOI] [PubMed] [Google Scholar]
- 19.Wachtell K, Okin PM, Olsen MH, Dahlof B, Devereux RB, Ibsen H, Kjeldsen SE, Lindholm LH, Nieminen MS, Thygesen K. Regression of electrocardiographic left ventricular hypertrophy during antihypertensive therapy and reduction in sudden cardiac death: the LIFE Study. Circulation. 2007;116(7):700–705. doi: 10.1161/CIRCULATIONAHA.106.666594. [DOI] [PubMed] [Google Scholar]
- 20.Fisher ND, Hurwitz S, Ferri C, Jeunemaitre X, Hollenberg NK, Williams GH. Altered adrenal sensitivity to angiotensin II in low-renin essential hypertension. Hypertension. 1999;34(3):388–394. doi: 10.1161/01.hyp.34.3.388. [DOI] [PubMed] [Google Scholar]
- 21.Raji A, Williams GH, Jeunemaitre X, Hopkins PN, Hunt SC, Hollenberg NK, Seely EW. Insulin resistance in hypertensives: effect of salt sensitivity, renin status and sodium intake. J Hypertens. 2001;19(1):99–105. doi: 10.1097/00004872-200101000-00013. [DOI] [PubMed] [Google Scholar]
- 22.Williams JS, Williams GH, Jeunemaitre X, Hopkins PN, Conlin PR. Influence of dietary sodium on the renin-angiotensin-aldosterone system and prevalence of left ventricular hypertrophy by EKG criteria. J Hum Hypertens. 2005;19(2):133–138. doi: 10.1038/sj.jhh.1001784. [DOI] [PubMed] [Google Scholar]
- 23.Dickinson BD, Havas S. Reducing the population burden of cardiovascular disease by reducing sodium intake: a report of the Council on Science and Public Health. Arch Intern Med. 2007;167(14):1460–1468. doi: 10.1001/archinte.167.14.1460. [DOI] [PubMed] [Google Scholar]
- 24.Sokolow M, Lyon TP. The ventricular complex in left ventricular hypertrophy as obtained by unipolar precordial and limb leads. Am Heart J. 1949;37(2):161–186. doi: 10.1016/0002-8703(49)90562-1. [DOI] [PubMed] [Google Scholar]
- 25.Casale PN, Devereux RB, Alonso DR, Campo E, Kligfield P. Improved sex-specific criteria of left ventricular hypertrophy for clinical and computer interpretation of electrocardiograms: validation with autopsy findings. Circulation. 1987;75(3):565–572. doi: 10.1161/01.cir.75.3.565. [DOI] [PubMed] [Google Scholar]
- 26.Centers for Disease Control and Prevention. The Third National Health and Nutrition Examination Survey (NHANES III 1988–94) Reference Manuals and Reports [CD-ROM] National Center for Health Statistics; Bethesda, Md: 1996. [Google Scholar]
- 27.Antman EM, Green LH, Grossman W. Physiologic determinants of the electrocardiographic diagnosis of left ventricular hypertrophy. Circulation. 1979;60(2):386–396. doi: 10.1161/01.cir.60.2.386. [DOI] [PubMed] [Google Scholar]
- 28.Rockman HA, Ross RS, Harris AN, Knowlton KU, Steinhelper ME, Field LJ, Ross J, Jr, Chien KR. Segregation of atrial-specific and inducible expression of an atrial natriuretic factor transgene in an in vivo murine model of cardiac hypertrophy. Proc Natl Acad Sci U S A. 1991;88(18):8277–8281. doi: 10.1073/pnas.88.18.8277. [DOI] [PMC free article] [PubMed] [Google Scholar]
- 29.Imamura T, McDermott PJ, Kent RL, Nagatsu M, Cooper Gt, Carabello BA. Acute changes in myosin heavy chain synthesis rate in pressure versus volume overload. Circ Res. 1994;75(3):418–425. doi: 10.1161/01.res.75.3.418. [DOI] [PubMed] [Google Scholar]
- 30.Hill JA, Karimi M, Kutschke W, Davisson RL, Zimmerman K, Wang Z, Kerber RE, Weiss RM. Cardiac hypertrophy is not a required compensatory response to short-term pressure overload. Circulation. 2000;101(24):2863–2869. doi: 10.1161/01.cir.101.24.2863. [DOI] [PubMed] [Google Scholar]
- 31.Hill JA, Olson EN. Cardiac plasticity. N Engl J Med. 2008;358(13):1370–1380. doi: 10.1056/NEJMra072139. [DOI] [PubMed] [Google Scholar]
- 32.Keven K, Yalcin S, Canbakan B, Kutlay S, Sengul S, Erturk S, Erbay B. The impact of daily sodium intake on posttransplant hypertension in kidney allograft recipients. Transplant Proc. 2006;38(5):1323–1326. doi: 10.1016/j.transproceed.2006.02.103. [DOI] [PubMed] [Google Scholar]
- 33.Devereux RB, Bella J, Boman K, Gerdts E, Nieminen MS, Rokkedal J, Papademetriou V, Wachtell K, Wright J, Paranicas M, Okin PM, Roman MJ, Smith G, Dahlof B. Echocardiographic left ventricular geometry in hypertensive patients with electrocardiographic left ventricular hypertrophy: The LIFE Study. Blood Press. 2001;10(2):74–82. doi: 10.1080/08037050152112050. [DOI] [PubMed] [Google Scholar]
- 34.Verdecchia P, Angeli F, Reboldi G, Carluccio E, Benemio G, Gattobigio R, Borgioni C, Bentivoglio M, Porcellati C, Ambrosio G. Improved cardiovascular risk stratification by a simple ECG index in hypertension. Am J Hypertens. 2003;16(8):646–652. doi: 10.1016/s0895-7061(03)00912-9. [DOI] [PubMed] [Google Scholar]