

Abstract
The endoplasmic reticulum (ER) is an essential cellular compartment responsible for Ca2+ sequestration, signaling, protein translation, folding as well as transport. Several acute and chronic disease conditions impair ER function leading to ER stress. To study the impact of ER stress on synaptic transmission we applied tunicamycin (TM) or thapsigargin (TG) to hippocampal neurons, which triggered sustained elevation of key ER stress markers. We monitored evoked and spontaneous neurotransmission during 4 d of TM or TG treatment and detected only a 20% increase in paired pulse depression suggesting an increase in neurotransmitter release probability. However, the treatments did not significantly affect the number of active synapses or the size of the total recycling vesicle pool as measured by uptake and release of styryl dye FM1-43. In contrast, under the same conditions, we observed a dramatic fourfold increase in spontaneous excitatory transmission, which could be reversed by chronic treatment with the NMDA receptor blocker AP-5 or by treatment with salubrinal, a selective inhibitor of eukaryotic translation initiation factor 2 (eIF2α) dephosphorylation. Furthermore, ER stress caused NMDA receptor-dependent suppression of eukaryotic elongation factor-2 (eEF2) phosphorylation thus reversing downstream signaling mediated by spontaneous release. Together, these findings suggest that chronic ER stress augments spontaneous excitatory neurotransmission and reverses its downstream signaling in a NMDA receptor-dependent manner, which may contribute to neuronal circuitry abnormalities that precede synapse degeneration in several neurological disorders.
Introduction
The endoplasmic reticulum (ER) is a continuous system of membranous cisterns and tubules present in all eukaryotic cells including neuronal processes and dendritic spines (Martone et al., 1993; Terasaki et al., 1994; Spacek and Harris, 1997). The ER is an essential cellular compartment responsible for calcium sequestration and signaling as well as protein translation, folding, and transport (Paschen and Frandsen, 2001). The ER lumen contains the highest Ca2+ concentration within the cell, which is maintained by Ca2+ ATPases of the SERCA (sarco/endoplasmic reticulum Ca2+-ATPase) family. ER possesses several Ca2+-dependent molecular chaperons such as BiP, Grp94, calnexin, and calreticulin (Lee, 1992; Little et al., 1994) and numerous protein disulfide isomerases (Braakman et al., 1991) providing critical environment for the formation of disulfide bonds and correct protein folding. Improperly folded proteins undergo ER-associated protein degradation through the proteosomal pathway (Werner et al., 1996; Friedlander et al., 2000).
Conditions such as ischemia, disruption of Ca2+ homeostasis, nitrosative and oxidative stress, glucose or nutrient deprivation, viral infections can interfere with ER function and lead to ER stress (He et al., 1997; Kaufman et al., 2002; Dimcheff et al., 2004; Lipton, 2007; Doroudgar et al., 2009). Under ER stress unfolded proteins are accumulated within the ER lumen and trigger an adaptive response known as the ER stress response or unfolded protein response which acts to restore normal ER function by bringing back the protein-folding capacity of the ER. However, if the ER stress persists and cellular homeostasis cannot be restored, the ER stress response can lead to apoptosis. ER stress-mediated apoptosis is triggered by upregulation of glucose-regulated protein 78 (GRP78) or CHOP (C/EBP homologous protein)/GADD153 (growth arrest- and DNA damage-inducible gene 153) expression leading to caspase-12 activation (Barone et al., 1994; Matsumoto et al., 1996; Nakagawa et al., 2000; Marciniak et al., 2004; Lin et al., 2007).
Several neurological and neuropsychiatric disorders that include Alzheimer's disease, Parkinson's disease, polyglutamine expansion diseases, amyotrophic lateral sclerosis as well as tuberous sclerosis involve ER stress and unfolded protein response which may underlie their pathophysiology (Di Nardo et al., 2009; Scheper and Hoozemans, 2009). These disease states have also been associated with synaptic deficits, which precede synapse degeneration and neuronal loss (Hartley et al., 1999; Kamenetz et al., 2003; Tang et al., 2003; Ting et al., 2007; Nikolaus et al., 2009). ER stress response has also been linked to potential alterations in synaptic function, because modulation of ATF4/CREB transcriptional pathway, which plays a key role in ER stress response, regulates synaptic plasticity as well as learning and memory (Costa-Mattioli et al., 2005).
Despite the evidence linking several brain disorders to ER stress and synaptic deficits, very little is known about the direct impact of stress conditions on synaptic transmission. Here, to study the impact of ER stress on synaptic transmission in hippocampal neurons, we used electrophysiological and optical imaging techniques after ER stress induction by tunicamycin (TM) or thapsigargin (TG) application (Gething and Sambrook, 1992; Kaneko and Tsukamoto, 1994; Pérez-Sala and Mollinedo, 1995; Chang and Korolev, 1996).
Materials and Methods
Cell culture.
Dissociated hippocampal cultures were prepared as previously described (Kavalali et al., 1999). Briefly, whole hippocampi were dissected from postnatal day 0–3 (P0–P3) Sprague Dawley rats. Tissue was trypsinized (10 mg/ml trypsin) for 10 min at 37°C mechanically dissociated by pipetting and plated on Matrigel or poly-lysine-coated coverslips. Cytosine arabinoside (4 μm AraC, Sigma) was added at day 1 in vitro (1 DIV); at 4 DIV, AraC concentration was reduced to 2 μm. All experiments were performed on 14–21 DIV cultures. All experiments were performed on at least three independent cultures.
Drug treatment and cell viability.
dl-2-Amino-5-phosphonopentanoate (AP5, Sigma), 6-cyano-7-nitroquinoxaline-2,3-dione (CNQX, Sigma), tetrodotoxin (TTX, Calbiochem), and picrotoxin (PTX, Sigma) were added to solutions as indicated.
Tunicamycin and thapsigargin.
To induce ER stress neurons were treated in conditioned media with 5 μm TM (Sigma) or 300 nm TG (Sigma). The drugs were applied either alone or with 50 μm AP5 or 1 μm TTX. TTX was applied 12 h and AP5 at least 2 h before treatment with TM or TG.
Salubrinal.
Neurons were incubated with salubrinal (5 μm, Tocris Bioscience) 72 h before application of tunicamycin or thapsigargin.
EGTA-AM, BAPTA-AM.
Neurons were incubated in Ca2+-free Tyrode's solution either with 100 μm EGTA-AM for 15 min, or with 10 μm BAPTA-AM for 20 min, then washed with Tyrode's solution containing the following (in μm): 1 TTX, 50 AP5, and 50 PTX, before miniature EPSC (mEPSC) recordings.
NMDA.
Cultured hippocampal neurons were treated with 50 μm NMDA for 30 min, washed with PBS once and placed back in conditioned growth medium. mEPSCs were recorded 2 h after treatment. Samples for Western blot analysis were collected at 2 and 24 h after treatment.
Terminal deoxynucleotidyl transferase-mediated biotinylated UTP nick end labeling staining.
The number of apoptotic cells was assessed with terminal deoxynucleotidyl transferase-mediated biotinylated UTP nick end labeling (TUNEL) staining (Promega) according to the manufacturer's protocol (supplemental Fig. 1, available at www.jneurosci.org as supplemental material).
Immunocytochemistry.
Hippocampal neurons were grown on poly-lysine covered coverslips for all immunocytochemistry experiments. Cells were washed once with PBS and fixed in 4% (w/v) paraformaldehyde (Sigma) in PBS at room temperature (RT) for 15 min. After 4× rinse with PBS, cells were incubated for 10 min at RT in 1% (w/v) glycine in PBS to reduce fixative-induced autofluorescence. Next, cells were permeabilized with 0.2% (v/v) Triton X-100 (Roche, Roche Diagnostics) in PBS for 10 min at RT. After incubation for 1 h at RT in NGS blocking solution (10% (v/v) normal goat serum (Sigma), 5% (w/v) bovine serum albumin (Sigma) and 0.025% (v/v) Triton X-100 in PBS) cells were incubated for 1 h at RT with primary antibody rabbit anti-CHOP (1:200) and mouse anti-MAP2 (1:200). After incubation with primary antibody cells were washed 3 times with PBS-T for 10 min each at RT. Cells were then incubated with goat anti-mouse secondary antibodies conjugated to Alexa Fluor 488 (1:1000, Invitrogen) and goat anti-rabbit secondary antibodies conjugated to Alexa Fluor 594 (1:1000, Invitrogen) for 1 h at RT in the dark. Following this incubation cells were washed 3 times with PBS-T for 10 min each then coverslips were mounted using Aqua Poly/Mount (Polysciences) and allowed to cure overnight at RT in the dark before imaging. Images were obtained by a Zeiss LSM 510 META laser-scanning microscope equipped with LSM 510 Laser module (Carl Zeiss) and analyzed with ImageJ software.
Western blotting.
Samples of treated neurons were collected with 1× loading buffer containing the following (in mm): 62.5 Tris-HCl, pH 6.8 at 25°C, 2% w/v SDS, 10% glycerol, 50 DTT, 0.01% w/v bromophenol blue. Samples were sonicated for 30 s, and boiled for 5 min at 95°C, 20 μl of each sample were then loaded and separated on 8% SDS PAGE, then transferred to nitrocellulose membranes. After blocking for 60 min at room temperature in blocking solution [Tris-buffered saline (TBS), 0.1% Tween 20, 5% w/v nonfat dry milk] blots were washed tree times with TBS-T and incubated overnight at 4°C with the following primary antibodies: anti-phospho eIF2a (1:1000), anti-eIF2α (1:1000), anti-phospho eEF2 (1:1000), anti-eEF2 (1:1000) (all rabbit polyclonal antibodies from Cell Signaling Technology), mouse monoclonal anti-CHOP (1:1000, Affinity Bioreagents), mouse monoclonal anti-GDI (1:15,000) (gift from Dr. T. Südhof, Stanford University, Stanford, CA). Primary antibody dilution buffer contained: TBS, 0.1% Tween 20 with 5% BSA. After washing three times with TBS-T, blots were incubated with HRP-conjugated anti-rabbit (1:2000, Cell Signaling Technology) or anti-mouse (1:2500, Millipore Bioscience Research Reagents) secondary antibodies. Immunoreactive bands were visualized by enhanced chemiluminescence, captured on autoradiography film (Eastman Kodak). Digital images were produced by densitometric scans of autoradiographs on ScanJet 4300C (Hewlett Packard) and quantified using ImageJ software. The amount of total eEF2 and eIF2α proteins were adjusted to GDI loading control. The phospho/total and CHOP/GDI protein ratios were calculated for each condition and presented as a percentage of condition control.
Electrophysiology.
Whole-cell patch-clamp recordings were performed on hippocampal pyramidal neurons. Data were acquired using a MultiClamp 700B amplifier and Clampex 9.0 software (Molecular Devices). Recordings were filtered at 2 kHz and sampled at 200 μs. A modified Tyrode's solution containing the following (in mm): 150 NaCl, 4 KCl, 2 MgCl2, 2 CaCl2, 10 glucose, 10 HEPES, pH 7.4 was used as external bath solution. For isolation of mEPSCs, 1 μm TTX, 50 μm PTX, and 50 μm AP5 were added. For isolation of miniature IPSCs (mIPSCs) 1 μm TTX, 50 μm AP5, and 10 μm CNQX were added. Evoked EPSCs were recorded in presence of 50 μm PTX. The pipette internal solution contained the following (in mm): 115 Cs-MeSO3, 10 CsCl, 5 NaCl, 10 HEPES, 0.6 EGTA, 20 tetraethylammonium-Cl, 4 Mg-ATP, 0.3 Na3GTP, pH 7.35, and 10 QX-314 [N-(2,6-dimethylphenylcarbamoylmethyl)-triethylammonium bromide], 300 mOsm. Field stimulation was applied through parallel bipolar electrodes (FHC) immersed in the perfusion chamber, delivering 15–20 mA pulses. Series resistance ranged between 10 and 30 MΩ.
Fluorescence imaging with FM1-43.
Synaptic boutons were loaded with FM1-43 during 90 s incubation in Tyrode's solution containing 47 mm K+. After washing with dye-free Tyrode's solution for 10 min, synaptic terminals were destained using three 90 s applications of a 90 mm K+ Tyrode's solution with each separated by 60 s intervals. All staining and washing solutions contained 10 μm CNQX and 50 μm AP5 to prevent recurrent activity. Isolated boutons were selected during the wash and fluorescence changes were measured during destaining. Images were obtained by a cooled, intensified CCD camera (Roper Scientific, Duluth, GA) during illumination at 480 nm via an optical switch (Sutter Instruments). Images were acquired and analyzed using imaging software (Molecular Devices).
Quantifying the number of functional synaptic boutons using FM1-43.
For each neuron FM1-43 puncta were counted at least on three dendrites. These numbers were averaged to represent the synapse density for a given neuron. Measurements were obtained from at least 10 neurons from three independent cultures for a given condition.
Calcium imaging.
Fura-2 Ca2+ imaging experiments with neuronal cultures were performed as previously described (Tang et al., 2003) using a DeltaRAM illuminator, an IC-300 camera, and ImageMaster Pro software (all from PTI). Briefly, the cultured neurons were maintained in artificial CSF (ACSF) containing the following (in mm): 140 NaCl, 5 KCl, 1 MgCl2, 2 CaCl2, and 10 HEPES, pH 7.3, at 37°C during measurements (PH1 heater, Warner Instruments). Fura-2 340/380 ratio images for baseline (2 min) measurements were collected every 6 s for the duration of the experiment.
Statistics.
Paired t test or one-way ANOVA with Tukey post hoc test was used to determine statistical significance. The mean difference was taken as significant at p < 0.05.
Results
Induction of ER stress in hippocampal neurons
To study the impact of ER stress on synaptic transmission, we applied TM and TG to cultured hippocampal neurons. Here, dissociated primary cultures provide a distinct advantage by allowing examination of synaptic function independent of potential general alterations in brain homeostasis, thereby enabling a distinction between cell-autonomous defects and global systemic as well as metabolic dysfunction. To monitor the progression of ER stress we examined alterations in the levels of phosphorylated eukaryotic translation initiation factor 2 α (p-eIF2α) and CHOP proteins. Alpha subunit of the translation initiation factor 2 (eIF2α) is phosphorylated by PKR-like kinase (PERK) in response to ER stress (Harding et al., 1999; Hinnebusch, 2000). CHOP protein triggers ER stress-mediated apoptosis. Thus, both, p-eIF2α and CHOP protein indicate the presence of ER stress. Treatment of hippocampal cultures with 5 μm TM or 300 nm TG caused a rapid elevation in the levels of these markers within 4 h (Fig. 1A–F). Continued TM or TG treatment sustained this increase up to 96 h. To visualize the distribution of ER stress across neurons in the culture, we coimmunostained hippocampal cultures with an antibody against the neuronal marker MAP-2 and CHOP after 24 h of TM or TG application (Fig. 1G). Quantitative analysis of immunofluorescence in neurons identified with their MAP-2 staining revealed a nearly homogeneous increase in the levels of CHOP staining across the culture (Fig. 1H), indicating that under these conditions nearly all neurons were experiencing ER stress. As a consequence of the wide spread ER stress, neurons gradually transitioned into apoptosis. However, between 48 and 72 h after ER stress induction, only a small fraction of cells displayed apoptotic markers. When we quantified apoptotic neurons using TUNEL staining, we found that the number of apoptotic cells increased with the time of drug application and comprised on average 10–20% of control neurons at 72 h after application of TM or TG respectively (supplemental Fig. 1, available at www.jneurosci.org as supplemental material).
Figure 1.
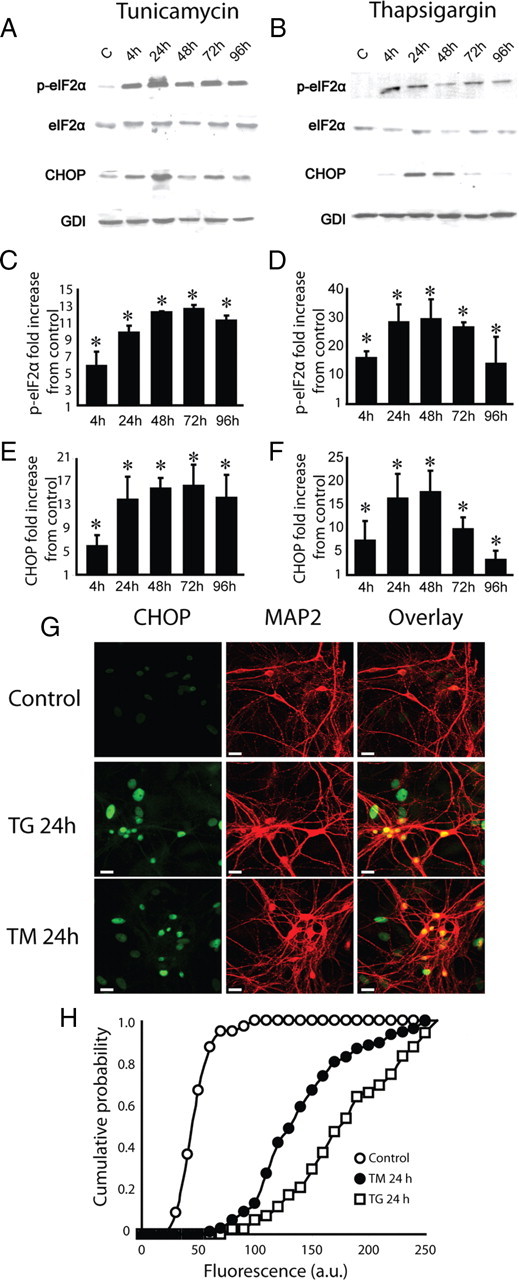
Induction of chronic stress in hippocampal neurons. To induce ER stress hippocampal cultures were treated with 5 μm tunicamycin or 300 nm thapsigargin. Representative Western blots (A, B) and quantitative data (C–F) using antibodies specific for p-eIF2α, eIF2α, CHOP and GDI (loading control) from control cultures and cultures treated with TM or TG for 4–96 h. Number of experiments for TM or TG treatments is 3 and 2 respectively. Both TM and TG cause significant long term increase in levels of expression of p-eIF2α and CHOP. For all panels t test p < 0.05 versus control. G, Dissociated hippocampal cultures were immunostained with antibodies specific for MAP2 (red) and CHOP (green) after 24 h of application of TM or TG to estimate the number of neurons are under ER stress. Green fluorescence in MAP2-positive cells was compared in control and neurons treated either with TM or TG. H, Cumulative histogram of green fluorescence associated with CHOP expression shows that it is significantly higher in treated neurons. Kolmogorov–Smirnov statistic is 95 and 96 for TM- and TG-treated neurons, respectively, t test p < 0.001 versus control. Number of coverslips per condition is 6. Calibration bar, 20 μm.
Chronic ER stress leaves functional integrity of presynaptic nerve terminals intact
Next, we assessed the impact of this global ER stress induction paradigm on the functional integrity of individual presynaptic nerve terminals by monitoring activity-dependent uptake and release of the styryl dye FM1-43 (Betz et al., 1996). Elevated potassium stimulation (47 mm K+ for 90 s) triggers near maximal uptake of FM1-43 into the total recycling synaptic vesicle pool (Harata et al., 2001) and subsequent application of 90 mm K+ stimulation causes swift dye loss due to rapid mobilization and fusion of these dye labeled vesicles. The amount of dye uptake and the kinetics of dye release monitored during this protocol are extremely susceptible to differences in maturational states of presynaptic terminals (Mozhayeva et al., 2002) or potential defects in their neurotransmitter release machinery (Schoch et al., 2001; Bronk et al., 2007).
Surprisingly, sustained treatment with TM or TG up to 72 h did not induce a significant change in the number of functional presynaptic terminals detected using this protocol along dendritic processes (Fig. 2A–D). Moreover, 72 h of TM or TG treatment failed to trigger a significant alteration in the kinetics of dye release during elevated potassium depolarization (Fig. 2E–H) despite its ability to induce maximal wide spread ER stress across neurons (Fig. 1).
Figure 2.
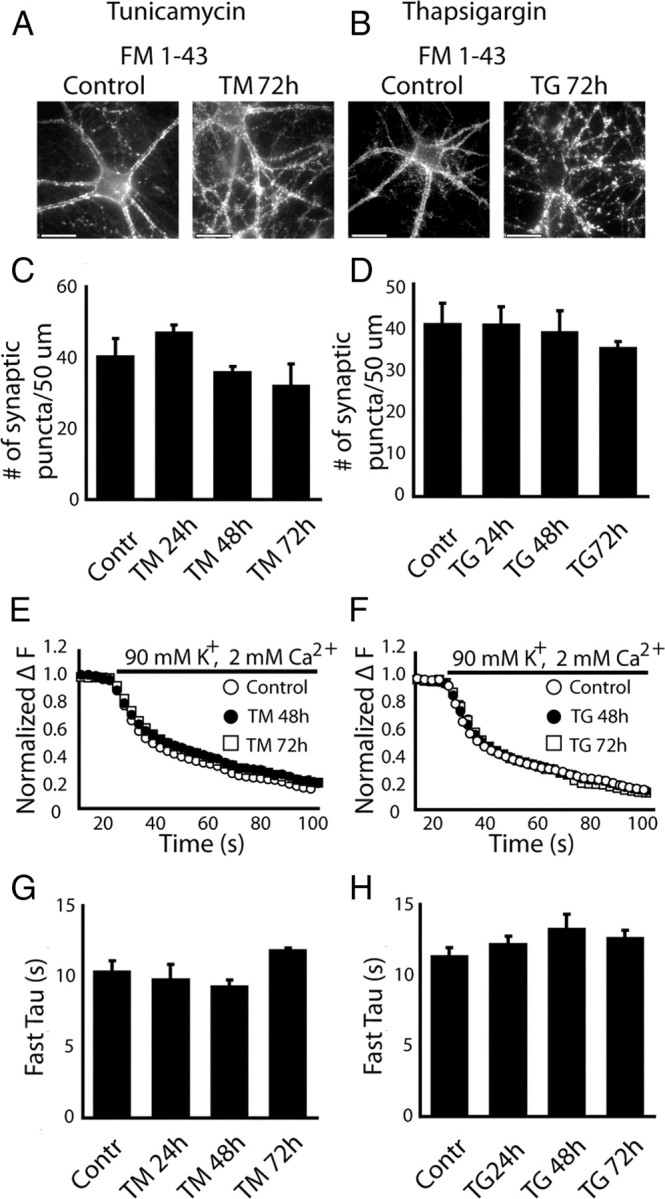
Impact of chronic ER stress on individual presynaptic nerve terminals. Total recycling synaptic vesicle pool was labeled with FM 1–43 using 47 mm K+-induced depolarization. A, B, Representative images of synaptic boutons labeled with FM 1-43 in control and after 72 h of incubation with TM or TG. Three dendrites, 50 μm long per neuron, were selected for synaptic puncta count. C, D, Incubation of neurons with TM or TG for 24–72 h did not affect the number of synaptic puncta; (C, Control, n = 6; TM 24 h, n = 3; TM 48 h, n = 5; TM 72 h, n = 3; D, Control, n = 6; TG 24 h, n = 4; TG 48 h, n = 3; TG 72 h, n = 5). E, F, Labeled synaptic vesicles were destained using 90 mm K+-induced depolarization. The kinetics of destaining was not different among control synapses and synapses treated with TM or TG for 24–72 h. G, H, Time constants of synaptic vesicle mobilization. The bar graphs indicate that time constants of synaptic vesicle mobilization were not significantly different in control synapses compared with synapses between neurons treated with TM or TG for 24–72 h; (G, Control, n = 11; TM 24 h, n = 4; TM 48 h, n = 6; TM 72 h, n = 8; H, Control, n = 13; TG 24 h, n = 9; TG 48 h, n = 6; TG 72 h, n = 5). Calibration bar, 10 μm.
Properties of evoked excitatory neurotransmission during ER stress
Our findings so far suggest that under these conditions ER stress induction does not compromise gross functional integrity of neurons or their presynaptic nerve terminals. In the next set of experiments, we assessed whether the same ER stress conditions elicited alterations in the properties of excitatory synaptic transmission using whole-cell recordings of evoked synaptic responses. Excitatory synaptic responses triggered during sustained 10 Hz stimulation showed robust depression and swift recovery under control as well as TG or TM treatment conditions up to 72 h with similar kinetics under all conditions (Fig. 3A,B). In contrast, 20 Hz stimulation induced more rapid depression in TM- or TG-treated neurons compared with controls, although under both conditions subsequent low-frequency stimulation produced a swift response recovery back to baseline levels with similar kinetics (Fig. 3C,D). This increased depression could be attributed to a small but significant elevation in neurotransmitter release probability, as incubation with either TM or TG induced a decrease in paired pulse facilitation of EPSCs within 48 h of treatment (Fig. 3E,F).
Figure 3.

Alterations in evoked excitatory neurotransmission associated with ER stress. A, B (left), Sample traces of the first 5 and last 5 evoked EPSCs recorded in presence of PTX in response to 10 Hz field stimulation from neurons treated with TM or TG. A, B (right), Average normalized EPSC amplitudes from treated neurons measured during 1 min of 10 Hz stimulation show no changes in synaptic depression after treatment with TM or TG for 48–72 h compared with controls; (A, Control, n = 11; TM 48 h, n = 6; TM 72 h, n = 3; B, control, n = 11; TG 48 h, n = 3; TG 72 h, n = 4). C, D (left), Sample traces of the first 5 and last 5 evoked EPSCs, recorded in presence of PTX in response to 20 Hz field stimulation from neurons treated with TM or TG. C, D (right), Average normalized EPSC amplitudes from treated neurons measured during 2 s of 20 Hz stimulation show significant difference in response depression after treatment with TM for 72 h, and after treatment with TG for 48 and 72 h compared with control; (C, Control, n = 15; TM 48 h, n = 4; TM 72 h, n = 6; D, Control, n = 15; TG 48 h, n = 6; TG 72 h, n = 3). E, F, Paired-pulse ratios of the first two evoked EPSCs in response to stimulation with paired pulses with different inter pulse intervals. There is small but not significant reduction in PPF ratios at 50 ms IPI after 48 h of treatment with TM or TG compared with control; (number of experiments for interpulse intervals of 50, 100, 2000 ms respectively: E, Control, n = 7, 5, 12; TM 24 h, n = 7, 5, 4; TM 48 h, n = 3, 3, 3; TM 72 h, n = 3, 3, 3; F, Control, n = 7, 8, 6; TG 24 h, n = 8, 9, 11; TG 48 h, n = 9, 5, 8; TG 73 h, n = 6, 5, 4). G, H (left), Representative traces of evoked NMDAR (1)- and AMPAR (2)-dependent EPSCs in neurons treated with TM or TG for 72 h. Recordings were made in the absence of AP5. G, H (right), Bar graphs show no change in NMDA/AMPA ratio after 24–72 h treatment with TM or TG compared with control; (G, Control, n = 13; TM 24 h, n = 6; TM 48 h, n = 4; TM 72 h n = 5; H, Control, = 14; TG 24 h, n = 5; TG 48 h, n = 9; TG 72 h, n = 3).
We also evaluated whether the ER stress paradigm altered the balance between AMPA receptor-mediated and NMDA receptor-mediated evoked excitatory neurotransmission, a known hallmark of postsynaptic maturation in addition to being a key substrate for long-term synaptic plasticity (Poncer and Malinow, 2001; Chubykin et al., 2007). The ratios of evoked AMPA and NMDA receptor-mediated EPSCs detected in individual neurons were not significantly different during the course of 72 h of TM or TG treatment (Fig. 3G,H). Together, these results suggest that chronic ER stress induction causes a mild but significant elevation in neurotransmitter release probability coupled with increased synaptic depression during high-frequency stimulation while it leaves several other key markers of evoked excitatory neurotransmission intact.
Augmentation of excitatory spontaneous neurotransmission during ER stress
In the next set of experiments we investigated whether chronic ER stress alters the properties of spontaneous excitatory neurotransmission. Changes in spontaneous neurotransmission could underlie functional neuronal deficits associated with several neurological as well as neuropsychiatric disorders that are coupled to ER stress (Rossi et al., 2000; Lipton, 2007; Zhang et al., 2009). Interestingly, treatment with TM or TG resulted in a robust two- to fourfold increase in the frequency of mEPSCs within 48 h (Fig. 4A–D), and in the case of TG this increase in mEPSC frequency was maintained up to 72 h (Fig. 4B,D). The elevation in spontaneous synaptic activity was not mediated by increases in overall network activity as the miniature events were recorded in the presence of tetrodoxin (TTX) and AP-5 to block action potential generation and NMDA receptor activation. In contrast, inclusion of TTX or AP-5 together with TM or TG during ER stress induction abolished this increase in mEPSC frequency (Fig. 4C,D) without significantly changing the amplitudes of mEPSCs (Fig. 4E,F).
Figure 4.

Chronic ER stress augments spontaneous excitatory neurotransmission in an activity-dependent manner. A, B, Sample traces of mEPSCs recorded from neurons treated with TM or TG for 24–72 h. C, D, Bar graphs show significant increase in mEPSC frequency after treatment with TM for 48 h and after treatment with TG for 48–72 h. There was no increase in mEPSC frequency if AP5 or/and TTX were applied together with TM or TG for the same amount of time. One-way ANOVA showed significant difference for TM within “No treatment/Drug only” group (white bars) F(3,57) = 5.9, p = 0.001, and between TM and TM+AP5 and TM+TTX at 48 h, F(2,31) = 3.45, p = 0.0456. For TG, one-way ANOVA showed significant difference within “No treatment/Drug only” group (white bars) F(3,61) = 5.92, p = 0.001, and within 48 h of TG, TG+AP5 and TG+TTX treatment; F(2,29) = 5.525, p = 0.01. E, F, The amplitudes of mEPSCs were not affected by the application of TM or TG. The event amplitudes were stable when the drugs were applied together with AP5 or/and TTX; (No treatment/Drug only, Drug+AP5, Drug+TTX respectively: C, E, Control, n = 21, 12, 12; TM 24 h, n = 9, 6, 6; TM 48 h, n = 20, 6, 7; TM 72 h, n = 8, 5, 3; D, F, Control, n = 16, 20, 20; TG 24 h, n = 16, 5, 5; TG 48 h, n = 18, 8, 6; TG 72 h, n = 6, 5, 4).
Acute NMDA treatment-induced excitotoxicity triggers ER stress and augments mEPSC frequency
In the next set of experiments we tested whether NMDA receptor activation alone was sufficient to trigger ER stress and augment spontaneous neurotransmission in the absence of TM or TG treatment. Indeed, 30 min long treatment with 50 μm NMDA triggered robust ER stress as early as 2 h after treatment as indicated by the elevation in p-eIF2α and CHOP protein levels. This elevation in key ER stress markers was sustained up to 24 h following brief NMDA application (Fig. 5A). Unlike TM or TG treatment, however, acute NMDA-mediated excitotoxicity triggered rapid neuronal death after 24 h. Therefore, we restricted our electrophysiological analysis to the 2 h time point after initial NMDA treatment. Under these conditions, we observed approximately twofold increase in mEPSC frequency (Control: 2.16 ± 0.26 Hz; NMDA: 4.46 ± 1.09 Hz; p < 0.05) (Fig. 5B) without a significant change in the amplitudes of individual events (Control: 23.74 ± 1.26 pA; NMDA: 30.0 ± 3.6 pA; p > 0.05). This increase in mEPSC frequency after brief NMDA exposure agrees well with earlier results (Malgaroli and Tsien, 1992) and strongly suggests that pathophysiological events that produce ER stress such as excitotoxicity (Sokka et al., 2007) or ischemia (Hayashi et al., 2003; Tajiri et al., 2004) could mimic the effect of TM or TG treatment and lead to a similar increase in spontaneous excitatory neurotransmission.
Figure 5.

NMDA-induced ER stress and alterations in synaptic transmission. A, Representative Western blots performed using antibodies specific for p-eIF2α, eIF2α, CHOP and GDI (loading control) from control cultures and cultures treated with 50 μm NMDA at 2 or 24 h after treatment. B, Sample traces of mEPSCs recorded from control neurons and from neurons treated with 50 μm NMDA, 2 h after treatment. Note the increase in mEPSC frequency upon NMDA treatment.
Impact of cytosolic Ca2+ on spontaneous neurotransmission during ER stress
Earlier studies have shown that acute treatment of neurons with agents such as TG could significantly elevate the rate of spontaneous neurotransmission by increasing cytosolic Ca2+ levels (Xu et al., 2009). To address whether the increased mEPSC frequency after chronic treatment with TM or TG was due to elevated cytosolic Ca2+, or an increase in Ca2+ sensitivity of the neurotransmitter release machinery, we recorded mEPSCs after acute application of the cell-permeable Ca2+ buffer EGTA-AM or BAPTA-AM (Fig. 6A–D). Under control conditions EGTA-AM or BAPTA-AM incubation resulted in a twofold decrease in mEPSC frequency suggesting that baseline mEPSC frequency is facilitated by resting cytosolic Ca2+ levels (Fig. 6E–H). Likewise, the increased mEPSC frequency detected after 48 h incubation with TM or TG was also extremely susceptible to EGTA-AM or BAPTA-AM treatment, producing a two- to fourfold decrease in mEPSC frequency in the case of EGTA-AM, 10- to 25-fold decrease in the case of BAPTA-AM (Fig. 6E–H) under both conditions.
Figure 6.

The increase of spontaneous synaptic activity caused by ER stress is Ca 2+ sensitive. A–D, Sample traces of mEPSCs recorded from control neurons, neurons treated with TM or TG for 48 h and neurons treated with TM or TG which were incubated with either EGTA-AM or BAPTA-AM for 20 min before recording. E–H, Summary graphs, 3-fold increase in mEPSC frequency after treatment with TM or TG and decrease of mEPSC frequency after application of 100 μm EGTA-AM or 10 μm BAPTA-AM (E, Control, n = 5; Control+EGTA-AM, n = 3; TM 48 h, n = 5; TM 48 h+EGTA-AM, n = 4; F, Control n = 5; Control+EGTA-AM, n = 4; TG 48 h, n = 3; TG 48 h+EGTA-AM, n = 5; G, Control, n = 7; Control+BAPTA-AM, n = 5; TM 48 h, n = 5; TM 48 h+BATA-AM, n = 5; H- Control, n = 5; Control+BAPTA-AM, n = 5; TG 48 h, n = 4; TG 48 h+BATA-AM, n = 5). Application of EGTA-AM as well as BAPTA-AM significantly reduced mEPSC frequency in TM- and TG-treated neurons. E, F, One-way ANOVA test: F(3,16) = 4.49, p < 0.023; F(3,16) = 6.49, p < 0.006 for TM and TG neurons treated with EGTA-AM respectively. G, H, One-way ANOVA test, F(5,81) = 10.2, p < 0.001 for TM and TG neurons treated with BAPTA-AM respectively. I, Basal levels of cytosolic Ca2+ in neurons were not altered after application of TM or TG for 48 h. Number of cells per condition, 5.
Next, we asked whether this ER stress-induced increase in mEPSC frequency is due to a sustained increase in cytosolic Ca2+. For this purpose, we used the cell-permeable ratiometric Ca2+ indicator dye FURA-2AM to estimate differences in basal Ca2+ levels. We loaded control as well as TM or TG neurons treated with FURA2-AM and monitored FURA-2 fluorescence emission in response to ultraviolet excitation at 340 or 380 nm. The ratio of fluorescence emission after excitation at these two wavelengths is an indicator of free Ca2+ levels (Grynkiewicz et al., 1985). These experiments were conducted 48 h after TM or TG treatments under conditions similar to our mEPSC recordings. In this setting, we did not detect a significant change in resting cytosolic Ca2+ levels (Fig. 6I). This finding suggests that the augmentation of mEPSC frequency during ER stress is mainly due to increased sensitivity of spontaneous release machinery to Ca2+ rather than a significant increase in basal Ca2+ levels. This premise is also consistent with the observation that the increase in mEPSC frequency takes 48 h to develop after induction of ER stress indicating a long-term modification of the release machinery rather than a sustained increase in Ca2+. A sustained increase in Ca2+ would have been expected to have dramatic impact on several other synaptic parameters including evoked neurotransmission as well as miniature IPSCs, which were all largely unaltered (supplemental Fig. 2, available at www.jneurosci.org as supplemental material).
Treatment with ER stress inhibitor salubrinal blocks the augmentation of mEPSC frequency after TM or TG application
To test whether there is a causal link between activation of ER stress response and augmentation of excitatory spontaneous neurotransmission, we tested the impact of salubrinal on ER stress-induced increase in neurotransmission. Salubrinal inhibits ER stress-activated phosphatase complexes and stabilizes phosphorylated eIF2α. Recent work had identified salubrinal in a molecule screen against ER stress-induced apoptosis following tunicamycin treatment in a rat pheochromocytoma (PC12) cell line (Boyce et al., 2005). In these experiments we incubated neurons with salubrinal (5 μm) 72 h before application of TM or TG. mEPSC recordings performed 48 h after TM (Fig. 7A) or TG (Fig. 7B) exposure revealed significant block of the augmentation of mEPSC frequency induced by ER stress in response to salubrinal treatment (Fig. 7C). The same conditions did not alter the amplitudes of individual mEPSCs (Fig. 7D). This result indicates that decrease in eIF2α phosphorylation and possibly ER stress-dependent apoptosis initiate the observed increases in spontaneous neurotransmission. This premise is in line with earlier work which had suggested a role for apoptotic signaling cascade in regulation of neurotransmission (Reimertz et al., 2003; Li et al., 2008). However, it is important to note that in the absence of salubrinal, the fraction of apoptotic cells did not exceed 20% even after 48 h of TM or TG treatment (supplemental Fig. 1, available at www.jneurosci.org as supplemental material) although nearly all cells experienced ER stress (Fig. 1). Therefore, the augmentation of mEPSC is more likely to be a direct consequence of eIF2α dephosphorylation or possibly ER stress induced phosphatase activities rather than concomitant apoptosis.
Figure 7.

Salubrinal blocks augmentation in mEPSC frequency induced by ER stress. A, B, Sample traces of mEPSCs recorded from control neurons and neurons treated with salubrinal or with TM or TG in the presence of salubrinal. C, Bar graphs show that significant increase of mEPSC frequency is observed in neurons after 48 h incubation with TM or TG. TM or TG applied in the presence of salubrinal do not induce changes in mEPSC. One-way ANOVA: F(5,44) = 5.53, p < 0.001. (Control, n = 8; SAL, salubrinal, n = 7; TM 48 h, n = 8; TM+SAL, n = 7; TG 48 h, n = 10; TG+SAL, n = 9). D, Amplitudes of mEPSCs were unchanged in the presence of salubrinal, TM, TG or salubrinal plus TM or TG compared with control.
Disruption of eukaryotic elongation factor-2 phosphorylation under ER stress
Recent studies suggest that spontaneous neurotransmitter release, rather than evoked release, specifically suppresses dendritic protein translation machinery by promoting phosphorylation and inactivation of eukaryotic elongation factor-2 (eEF2), a critical catalytic factor for ribosomal translocation during protein synthesis (Sutton et al., 2007). This chronic suppression of protein translation, in turn, stabilizes postsynaptic sensitivity to released neurotransmitters by maintaining subunit composition glutamate receptors (Sutton et al., 2004, 2006).
In the next set of experiments, we examined whether the sustained increase in spontaneous release seen after chronic ER stress could augment eEF2 phosphorylation. To monitor alterations in eEF2 phosphorylation we used antibodies specific to phosphorylated (Thr 56) and total eEF2 and performed Western blot analysis after blockade of action potentials with TTX as well as after blockade of spontaneous NMDA mEPSCs (TTX+AP-5) (Fig. 8A). Under control conditions, action potential blockade caused a slight but statistically insignificant increase in phospho-eEF2 (p-eEF2). In contrast, in agreement with earlier observations, blockade of NMDA mEPSCs significantly decreased levels of p-eEF2 (Sutton et al., 2007). Surprisingly, under ER stress (48 h long TM or TG treatment) p-eEF2 levels were significantly lower compared with controls. Application of TTX with TM or TG maintained the low levels of p-eEF2, whereas application of TM (but not TG) together with TTX and AP5 (to suppress NMDA-mEPSCs) resulted in a significant increase in p-eEF2 toward control levels (Fig. 8B). These results suggest that under ER stress regulation of eEF2 phosphorylation by spontaneous release events operates in reverse aiming to maintain a relatively dephosphorylated eEF2 thus potentially leading to facilitation of protein translation machinery. Given the overall attenuation of protein translation during ER stress (Harding et al., 1999), the positive regulation of translational machinery by spontaneous release events may ensure maintenance of homeostatic regulation and synapse stability under the stress conditions.
Figure 8.
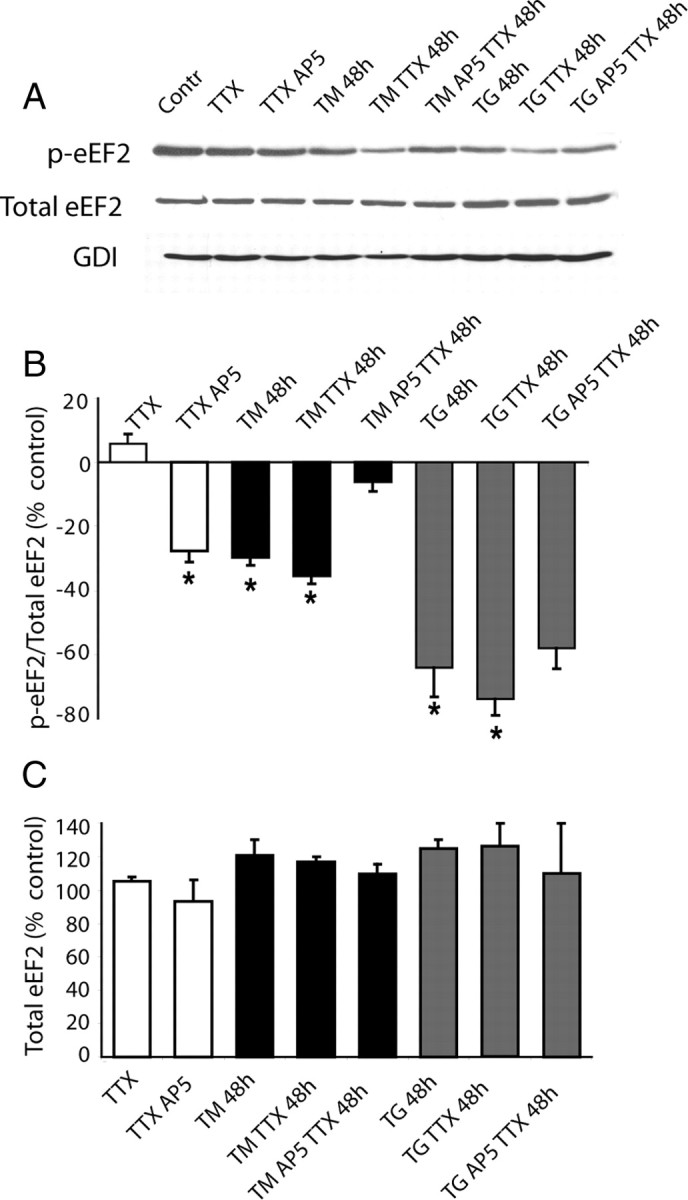
Regulation of eEf2 phosphorylation under stress condition. Representative Western blots (A) and summary data (B) using antibodies specific to phosphorylated (Thr 56) and total eEF2, GDI (loading control) are shown. A, TTX alone slightly increases levels of p-eEF2, blockade of NMDA mEPSCs significantly decreases levels of p-eEF2. B, Under ER stress (48 h of TM or TG treatment) levels of peEF2 are significantly lower compared with control. Application of TTX with TM or TG keeps levels of p-eEF2 low. Application of TM or TG together with TTX and AP5 restored p-eEF2 levels close to normal in case of TM, but not incase of TG. Number of experiments, 3 per condition. One-way ANOVA for neurons treated with TM only or with TM in presence of TTX /and AP5: F(5,19) = 6.74, p < 0.013; for neurons treated with TG only or with TG in presence of TTX/and AP5: F(5,14) = 22.67, p < 0.001. C, Levels of total eEF2 did not show significant changes under all conditions.
Discussion
In this study, we chronically treated cultured hippocampal neurons with TM or TG, two agents that compromise ER homeostasis via different mechanisms. TM blocks the synthesis of all N-linked glycoproteins causing unfolded protein response leading to ER stress, whereas, TG is an inhibitor of ER Ca2+-ATPase that blocks Ca2+ sequestration within the ER lumen leading to depletion of ER Ca2+ stores. Regardless of their mechanisms of action, chronic treatment with these compounds caused a sustained increase in ER stress markers and spontaneous excitatory neurotransmission without substantial changes in resting Ca2+ levels suggesting a causal link between ER stress response and regulation of neurotransmission. This link is further supported by the finding that the augmentation of excitatory spontaneous neurotransmission during ER stress was susceptible to treatment with salubrinal, a selective inhibitor of eukaryotic translation initiation factor 2 (eIF2α) dephosphorylation, a key component of the ER stress response.
Surprisingly, these chronic ER stress conditions could be maintained up to 72 h without significant apoptosis as indicated by TUNEL staining or in the absence of degeneration in the overall integrity of presynaptic function, synapse numbers or postsynaptic responsiveness when assessed with a combination of morphological and functional markers. More detailed examination of the properties of synaptic transmission revealed a mild increase (∼20%) in paired pulse depression of evoked EPSCs coupled with facilitation of synaptic depression detected during sustained stimulation at 20 Hz. In contrast to this modest alteration in evoked excitatory transmission, chronic ER stress conditions caused a robust increase in mEPSC frequency, which could be countered by increased Ca2+ buffering by acute EGTA-AM or BAPTA-AM incubation. In the absence of significant changes in baseline Ca2+ levels, this result suggests an increase in Ca2+ sensitivity of spontaneous neurotransmitter release machinery, akin to observations after knock out of synaptic vesicle associated Ca2+ sensor synaptotagmin-1 (Xu et al., 2009). However, under ER stress the increase in spontaneous release was specific to excitatory synapses as the frequency of mIPSCs were largely unaltered under the same conditions.
Substantial increases in the rate of spontaneous release can have deleterious consequences on neuronal function. Increased release under resting conditions can augment glutamatergic tone and render neurons more vulnerable to excitotoxicity (Cavelier and Attwell, 2005, Wasser and Kavalali, 2009; Nakanishi et al., 2009). In addition, given spontaneous release events' impact on neuronal activity (Otmakhov et al., 1993; Carter and Regehr, 2002), uncontrolled augmentation of this form of release may adversely impact neuronal information processing by altering spike timing and fidelity. Recent studies also suggest that in contrast to evoked release spontaneous neurotransmitter release events tonically suppress protein translation machinery by maintaining the key regulator eEF2 in a phosphorylated state (Sutton et al., 2007). These observations are supported by recent findings from our group which suggest that spontaneous release events activate a population of NMDA receptors relatively isolated from receptors activated in response to evoked release (Atasoy et al., 2008). Furthermore, under physiological resting membrane potentials and Mg2+ levels spontaneous release events can trigger significant NMDA receptor-dependent activation and signaling due to incomplete Mg2+ block (Espinosa and Kavalali, 2009). In this study, we also evaluated downstream signaling mediated by spontaneous release events during ER stress and found that the regulation of eEF2 phosphorylation by mEPSCs was altered. In agreement with earlier work, under control conditions blockade of resting NMDA receptor activity caused a significant decrease in eEF2 phosphorylation (Sutton et al., 2007). In contrast, ER stress conditions caused a significant decrease in baseline levels of eEF2 phosphorylation despite a concomitant increase in the rate of mEPSCs. Interestingly, blockade of resting NMDA receptor activation during ER stress resulted in restoration of p-eEF2 levels toward the baseline. However, this reversal was specific to TM-induced ER stress, whereas blocking NMDA receptor activity did not alter the decrease in p-eEF2 levels seen after TG treatment. This discrepancy may suggest that the ability of NMDA-mEPSC suppression to prevent the effects of ER stress on eEF2 phosphorylation may require Ca2+ release from ER stores.
These results suggest that in central neurons ER stress reverses the direction of downstream signaling mediated by spontaneous release events. This finding is in contrast to a recent study which had shown that in nonneuronal cell lines ER stress itself induces eEF2 kinase-dependent eEF2 phosphorylation implicating a direct impact of ER stress on eEF2 function in the absence of glutamatergic signaling (Boyce et al., 2008). However, it remains to be determined whether this reversal in mEPSC-mediated signaling (i.e., the decrease in p-eEF2 levels) serves to preserve a significant dynamic range for homeostatic plasticity during stress, or alternatively it represents a defect in synaptic signaling potentially contributing to neurodegenerative effects of long-term stress. It is important to note that in the ER stress model we used here, long term blockade of NMDA receptors did not significantly alter expression of ER stress markers or rescue neuronal loss seen after 96 h of continued stress. This observation favors the former premise that resting NMDA receptor activity and its downstream signaling acts to maintain homeostasis rather than facilitating degenerative decline.
Together our findings suggest that chronic treatment of hippocampal neurons with TM or TG, unlike acute NMDA-mediated excitotoxicity, creates an in vitro condition that mimics chronic neuronal stress without substantial neuronal death or synaptic disintegration. This condition resembles several clinical observations that accompany neurological disorders, which suggest synaptic transmission and signaling abnormalities precede synapse degeneration and neuron loss (Hartley et al., 1999; Kamenetz et al., 2003). Strikingly, a major consequence of chronic stress on synaptic transmission is slow elevation of spontaneous excitatory transmission in 48 h. The facilitation of spontaneous release we observed here may be triggered by the ER stress-induced transcriptional program altering Ca2+ sensitivity of release. Interestingly, this effect of ER stress on excitatory neurotransmission is not shared by inhibitory spontaneous neurotransmission leading to an imbalance between inhibitory and excitatory input at rest. Such an imbalance between excitation and inhibition has been suggested as possible underlying cellular factor for certain neurodevelopmental disorders (Rubenstein and Merzenich, 2003; Dani et al., 2005). Resilience of spontaneous inhibitory neurotransmission to ER stress may arise from inherently increased Ca2+ buffering capacity of inhibitory interneurons (Lee et al., 2000).
Importantly, the impact on ER stress on spontaneous glutamatergic signaling could be alleviated by NMDA receptor blockade. This finding may explain therapeutic effectiveness of NMDA receptor blockers in several neurological and neuropsychiatric conditions that are accompanied with chronic neuronal stress and imply NMDA receptor signaling mediated by spontaneous glutamate release as potential therapeutic target.
Footnotes
This work was supported by grants from the National Institute of Mental Health to E.T.K. E.T.K. is an Established Investigator of the American Heart Association. We thank Drs. Ilya Bezprozvanny, Lisa Monteggia, and Michael Morris for advice, discussions, and comments on the manuscript.
References
- Atasoy D, Ertunc M, Moulder KL, Blackwell J, Chung C, Su J, Kavalali ET. Spontaneous and evoked glutamate release activate two populations of NMDA receptors with limited overlap. J Neurosci. 2008;28:10151–10166. doi: 10.1523/JNEUROSCI.2432-08.2008. [DOI] [PMC free article] [PubMed] [Google Scholar]
- Barone MV, Crozat A, Tabaee A, Philipson L, Ron D. Chop (GADD153) and its oncogenic variant, TLS-Chop, have opposing effects on the induction of G1/S arrest. Genes Dev. 1994;8:453–464. doi: 10.1101/gad.8.4.453. [DOI] [PubMed] [Google Scholar]
- Betz WJ, Mao F, Smith CB. Imaging exocytosis and endocytosis. Curr Opin Neurobiol. 1996;6:365–371. doi: 10.1016/s0959-4388(96)80121-8. [DOI] [PubMed] [Google Scholar]
- Boyce M, Bryant KF, Jousse C, Long K, Harding HP, Scheuner D, Kaufman RJ, Ma D, Coen DM, Ron D, Yuan J. A selective inhibitor of eIF2a dephosphorylation protects cells from ER stress. Science. 2005;307:935–939. doi: 10.1126/science.1101902. [DOI] [PubMed] [Google Scholar]
- Boyce M, Py BF, Ryazanov AG, Minden JS, Long K, Ma D, Yuan J. A pharmacoproteomic approach implicates eukaryotic elongation factor 2 kinase in ER stress-induced cell death. Cell Death Differ. 2008;15:589–599. doi: 10.1038/sj.cdd.4402296. [DOI] [PubMed] [Google Scholar]
- Braakman I, Hoover-Litty H, Wagner KR, Helenius A. Folding of influenza hemagglutinin in the endoplasmic reticulum. J Cell Biol. 1991;114:401–411. doi: 10.1083/jcb.114.3.401. [DOI] [PMC free article] [PubMed] [Google Scholar]
- Bronk P, Deák F, Wilson MC, Liu X, Südhof TC, Kavalali ET. Differential effects of SNAP-25 deletion on Ca2+-dependent and Ca2+-independent neurotransmission. J Neurophysiol. 2007;98:794–806. doi: 10.1152/jn.00226.2007. [DOI] [PubMed] [Google Scholar]
- Carter AG, Regehr WG. Quantal events shape cerebellar interneuron firing. Nat Neurosci. 2002;5:1309–1318. doi: 10.1038/nn970. [DOI] [PubMed] [Google Scholar]
- Cavelier P, Attwell D. Tonic release of glutamate by a DIDS-sensitive mechanism in rat hippocampal slices. J Physiol. 2005;564:397–410. doi: 10.1113/jphysiol.2004.082131. [DOI] [PMC free article] [PubMed] [Google Scholar]
- Chang JY, Korolev VV. Specific toxicity of tunicamycin in induction of programmed cell death of sympathetic neurons. Exp Neurol. 1996;137:201–211. doi: 10.1006/exnr.1996.0019. [DOI] [PubMed] [Google Scholar]
- Chubykin AA, Atasoy D, Etherton MR, Brose N, Kavalali ET, Gibson JR, Südhof TC. Activity-dependent validation of excitatory versus inhibitory synapses by neuroligin-1 versus neuroligin-2. Neuron. 2007;54:919–931. doi: 10.1016/j.neuron.2007.05.029. [DOI] [PMC free article] [PubMed] [Google Scholar]
- Costa-Mattioli M, Gobert D, Harding H, Herdy B, Azzi M, Bruno M, Bidinosti M, Ben Mamou C, Marcinkiewicz E, Yoshida M, Imataka H, Cuello AC, Seidah N, Sossin W, Lacaille JC, Ron D, Nader K, Sonenberg N. Translational control of hippocampal synaptic plasticity and memory by the eIF2α kinase GCN2. Nature. 2005;436:1166–1173. doi: 10.1038/nature03897. [DOI] [PMC free article] [PubMed] [Google Scholar]
- Dani VS, Chang Q, Maffei A, Turrigiano GG, Jaenisch R, Nelson SB. Reduced cortical activity due to a shift in the balance between excitation and inhibition in a mouse model of Rett syndrome. Proc Natl Acad Sci U S A. 2005;102:12560–12565. doi: 10.1073/pnas.0506071102. [DOI] [PMC free article] [PubMed] [Google Scholar]
- Dimcheff DE, Faasse MA, McAtee FJ, Portis JL. Endoplasmic reticulum (ER) stress induced by a neurovirulent mouse retrovirus is associated with prolonged BiP binding and retention of a viral protein in the ER. J Biol Chem. 2004;279:33782–33790. doi: 10.1074/jbc.M403304200. [DOI] [PubMed] [Google Scholar]
- Di Nardo A, Kramvis I, Cho N, Sadowski A, Meikle L, Kwiatkowski DJ, Sahin M. Tuberous sclerosis complex activity is required to control neuronal stress responses in an mTOR-dependent manner. J Neurosci. 2009;29:5926–5937. doi: 10.1523/JNEUROSCI.0778-09.2009. [DOI] [PMC free article] [PubMed] [Google Scholar]
- Doroudgar S, Thuerauf DJ, Marcinko MC, Belmont PJ, Glembotski CC. Ischemia activates the ATF6 branch of the endoplasmic reticulum (ER) stress response. J Biol Chem. 2009;284:29735–29745. doi: 10.1074/jbc.M109.018036. [DOI] [PMC free article] [PubMed] [Google Scholar]
- Espinosa F, Kavalali ET. NMDA receptor activation by spontaneous glutamatergic neurotransmission. J Neurophysiol. 2009;101:2290–2296. doi: 10.1152/jn.90754.2008. [DOI] [PMC free article] [PubMed] [Google Scholar]
- Friedlander R, Jarosch E, Urban J, Volkwein C, Sommer T. A regulatory link between ER-associated protein degradation and the unfolded-protein response. Nat Cell Biol. 2000;2:379–384. doi: 10.1038/35017001. [DOI] [PubMed] [Google Scholar]
- Gething MJ, Sambrook J. Protein folding in the cell. Nature. 1992;355:33–45. doi: 10.1038/355033a0. [DOI] [PubMed] [Google Scholar]
- Grynkiewicz G, Poenie M, Tsien RY. A new generation of Ca2+ indicators with greatly improved fluorescence properties. J Biol Chem. 1985;260:3440–3450. [PubMed] [Google Scholar]
- Harata N, Pyle JL, Aravanis AM, Mozhayeva M, Kavalali ET, Tsien RW. Limited numbers of recycling vesicles in small CNS nerve terminals: implications for neural signaling and vesicular cycling. Trends Neurosci. 2001;24:637–643. doi: 10.1016/s0166-2236(00)02030-0. [DOI] [PubMed] [Google Scholar]
- Harding HP, Zhang Y, Ron D. Protein translation and folding are coupled by endoplasmic-reticulum-resident kinase. Nature. 1999;397:271–274. doi: 10.1038/16729. [DOI] [PubMed] [Google Scholar]
- Hartley DM, Walsh DM, Ye CP, Diehl T, Vasquez S, Vassilev PM, Teplow DB, Selkoe DJ. Protofibrillar intermediates of amyloid β-protein induce acute electrophysiological changes and progressive neurotoxicity in cortical neurons. J Neurosci. 1999;19:8876–8884. doi: 10.1523/JNEUROSCI.19-20-08876.1999. [DOI] [PMC free article] [PubMed] [Google Scholar]
- Hayashi T, Saito A, Okuno S, Ferrand-Drake M, Dodd RL, Nishi T, Maier CM, Kinouchi H, Chan PH. Oxidative damage to the endoplasmic reticulum is implicated in ischemic neuronal cell death. J Cereb Blood Flow Metab. 2003;23:1117–1128. doi: 10.1097/01.WCB.0000089600.87125.AD. [DOI] [PubMed] [Google Scholar]
- He H, Lam M, McCormick TS, Distelhorst CW. Maintenance of calcium homeostasis in the endoplasmic reticulum by Bcl-2. J Cell Biol. 1997;138:1219–1228. doi: 10.1083/jcb.138.6.1219. [DOI] [PMC free article] [PubMed] [Google Scholar]
- Hinnebusch AG. Mechanism and regulation of initiator methionyl-tRNA binding to ribosomes. In: Sonenberg N, Hershey JW, Mathews MB, editors. Translational control of gene expression. Cold Spring Harbor, NY: Cold Spring Harbor Laboratory; 2000. pp. 185–244. [Google Scholar]
- Kamenetz F, Tomita T, Hsien H, Seabrook G, Borchelt D, Iwatsubo T, Sisodia S, Malinow R. APP processing and synaptic function. Neuron. 2003;37:925–937. doi: 10.1016/s0896-6273(03)00124-7. [DOI] [PubMed] [Google Scholar]
- Kaneko Y, Tsukamoto A. Thapsigargin-induced persistent intracellular calcium pool depletion and apoptosis in human hepatoma cells. Cancer Lett. 1994;79:147–155. doi: 10.1016/0304-3835(94)90253-4. [DOI] [PubMed] [Google Scholar]
- Kaufman RJ, Scheuner D, Schroder M, Shen X, Lee K, Liu CY, Arnold SM. The unfolded protein response in nutrient sensing and differentiation. Nat Rev Mol Cell Biol. 2002;3:411–421. doi: 10.1038/nrm829. [DOI] [PubMed] [Google Scholar]
- Kavalali ET, Klingauf J, Tsien RW. Activity dependent regulation of synaptic clustering in a hippocampal culture system. Proc Natl Acad Sci U S A. 1999;96:12893–12900. doi: 10.1073/pnas.96.22.12893. [DOI] [PMC free article] [PubMed] [Google Scholar]
- Lee AS. Mammalian stress response: induction of the glucose-regulated protein family. Curr Opin Cell Biol. 1992;4:267–273. doi: 10.1016/0955-0674(92)90042-b. [DOI] [PubMed] [Google Scholar]
- Lee SH, Rosenmund C, Schwaller B, Neher E. Differences in Ca2+ buffering properties between excitatory and inhibitory hippocampal neurons from the rat. J Physiol. 2000;525:405–418. doi: 10.1111/j.1469-7793.2000.t01-3-00405.x. [DOI] [PMC free article] [PubMed] [Google Scholar]
- Li H, Chen Y, Jones AF, Sanger RH, Collis LP, Flannery R, McNay EC, Yu T, Schwarzenbacher R, Bossy B, Bossy-Wetzel E, Bennett MV, Pypaert M, Hickman JA, Smith PJ, Hardwick JM, Jonas EA. Bcl-xL induces Drp1-dependent synapse formation in cultured hippocampal neurons. Proc Natl Acad Sci U S A. 2008;105:2169–2174. doi: 10.1073/pnas.0711647105. [DOI] [PMC free article] [PubMed] [Google Scholar]
- Lin JH, Li H, Yasumura D, Cohen HR, Zhang C, Panning B, Shokat KM, Lavail MM, Walter P. IRE1 signaling affects cell fate during the unfolded protein response. Science. 2007;318:944–949. doi: 10.1126/science.1146361. [DOI] [PMC free article] [PubMed] [Google Scholar]
- Lipton SA. Pathologically activated therapeutics for neuroprotection: mechanism of NMDA receptor block by memantine and S-nitrosylation. Curr Drug Targets. 2007;8:621–632. doi: 10.2174/138945007780618472. [DOI] [PubMed] [Google Scholar]
- Little E, Ramakrishnan M, Roy B, Gazit G, Lee AS. The glucose-regulated proteins (GRP78 and GRP94): functions, gene regulation, and applications. Crit Rev Eukaryot Gene Exp. 1994;4:1–18. doi: 10.1615/critreveukargeneexpr.v4.i1.10. [DOI] [PubMed] [Google Scholar]
- Malgaroli A, Tsien RW. Glutamate-induced long-term potentiation of the frequency of miniature synaptic currents in cultured hippocampal neurons. Nature. 1992;357:134–139. doi: 10.1038/357134a0. [DOI] [PubMed] [Google Scholar]
- Marciniak SJ, Yun CY, Oyadomari S, Novoa I, Zhang Y, Jungreis R, Nagata K, Harding HP, Ron D. CHOP induces death by promoting protein synthesis and oxidation in the stressed endoplasmic reticulum. Genes Dev. 2004;18:3066–3077. doi: 10.1101/gad.1250704. [DOI] [PMC free article] [PubMed] [Google Scholar]
- Martone ME, Zhang Y, Simpliciano VM, Carragher BO, Ellisman MH. Three-dimensional visualization of the smooth endoplasmic reticulum in Purkinje cell dendrites. J Neurosci. 1993;13:4636–4646. doi: 10.1523/JNEUROSCI.13-11-04636.1993. [DOI] [PMC free article] [PubMed] [Google Scholar]
- Matsumoto M, Minami M, Takeda K, Sakao Y, Akira S. Ectopic expression of Chop (GADD153) induces apoptosis in M1 myeloblastic leukemia cells. FEBS Lett. 1996;395:143–147. doi: 10.1016/0014-5793(96)01016-2. [DOI] [PubMed] [Google Scholar]
- Mozhayeva MG, Sara Y, Liu X, Kavalali ET. Development of vesicle pools during maturation of hippocampal synapses. J Neurosci. 2002;22:654–665. doi: 10.1523/JNEUROSCI.22-03-00654.2002. [DOI] [PMC free article] [PubMed] [Google Scholar]
- Nakagawa T, Zhu H, Morishima N, Li E, Xu J, Yankner BA, Yuan J. Caspase-12 mediates endoplasmic-reticulum-specific apoptosis and cytotoxicity by amyloid-β. Nature. 2000;403:98–103. doi: 10.1038/47513. [DOI] [PubMed] [Google Scholar]
- Nakanishi N, Tu S, Shin Y, Cui J, Kurokawa T, Zhang D, Chen HS, Tong G, Lipton SA. Neuroprotection by the NR3A subunit of the NMDA receptor. J Neurosci. 2009;29:5260–5265. doi: 10.1523/JNEUROSCI.1067-09.2009. [DOI] [PMC free article] [PubMed] [Google Scholar]
- Nikolaus S, Antke C, Müller HW. In vivo imaging of synaptic function in the central nervous system. I. Movement disorders and dementia. Behav Brain Res. 2009;204:32–66. doi: 10.1016/j.bbr.2009.06.008. [DOI] [PubMed] [Google Scholar]
- Otmakhov N, Shirke AM, Malinow R. Measuring the impact of probabilistic transmission on neuronal output. Neuron. 1993;6:1101–1111. doi: 10.1016/0896-6273(93)90058-y. [DOI] [PubMed] [Google Scholar]
- Paschen W, Frandsen A. Endoplasmic reticulum dysfunction a common denominator for cell injury in acute and degenerative diseases of the brain. J Neurochem. 2001;79:719–725. doi: 10.1046/j.1471-4159.2001.00623.x. [DOI] [PubMed] [Google Scholar]
- Pérez-Sala D, Mollinedo F. Inhibition of N-linked glycosylation induces early apoptosis in human promyelocytic HL-60 cells. J Cell Physiol. 1995;163:523–531. doi: 10.1002/jcp.1041630312. [DOI] [PubMed] [Google Scholar]
- Poncer JC, Malinow R. Postsynaptic conversion of silent synapses during LTP affects synaptic gain and transmission dynamics. Nat Neurosci. 2001;4:989–996. doi: 10.1038/nn719. [DOI] [PubMed] [Google Scholar]
- Reimertz C, Kögel D, Rami A, Chittenden T, Prehn JH. Gene expression during ER stress-induced apoptosis in neurons: induction of the BH3-only protein Bbc3/PUMA and activation of the mitochondrial apoptosis pathway. J Cell Biol. 2003;162:587–597. doi: 10.1083/jcb.200305149. [DOI] [PMC free article] [PubMed] [Google Scholar]
- Rossi DJ, Oshima T, Attwell D. Glutamate release in severe brain ischemia is mainly by reversed uptake. Nature. 2000;403:316–321. doi: 10.1038/35002090. [DOI] [PubMed] [Google Scholar]
- Rubenstein JL, Merzenich MM. Model of autism: increased ratio of excitation/inhibition in key neural systems. Genes Brain Behav. 2003;2:255–267. doi: 10.1034/j.1601-183x.2003.00037.x. [DOI] [PMC free article] [PubMed] [Google Scholar]
- Scheper W, Hoozemans JJ. Endoplasmic reticulum protein quality control in neurodegenerative disease: the good, the bad and the therapy. Curr Med Chem. 2009;16:615–626. doi: 10.2174/092986709787458506. [DOI] [PubMed] [Google Scholar]
- Schoch S, Deák F, Königstorfer A, Mozhayeva M, Sara Y, Südhof TC, Kavalali ET. SNARE function analyzed in synaptobrevin/VAMP knockout mice. Science. 2001;294:1117–1122. doi: 10.1126/science.1064335. [DOI] [PubMed] [Google Scholar]
- Sokka AL, Putkonen N, Mudo G, Pryazhnikov E, Reijonen S, Khiroug L, Belluardo N, Lindholm D, Korhonen L. Endoplasmic reticulum stress inhibition protects against excitotoxic neuronal injury in the rat brain. J Neurosci. 2007;27:901–908. doi: 10.1523/JNEUROSCI.4289-06.2007. [DOI] [PMC free article] [PubMed] [Google Scholar]
- Spacek J, Harris KM. Three-dimentional organization of smooth endoplasmic reticulum in hippocampal CA1 dendrites and dendritic spines of the immature and mature rat. J Neurosci. 1997;17:190–203. doi: 10.1523/JNEUROSCI.17-01-00190.1997. [DOI] [PMC free article] [PubMed] [Google Scholar]
- Sutton MA, Wall NR, Aakalu GN, Schuman EM. Regulation of dendritic protein synthesis by miniature synaptic events. Science. 2004;304:1979–1983. doi: 10.1126/science.1096202. [DOI] [PubMed] [Google Scholar]
- Sutton MA, Ito HT, Cressy P, Kempf C, Woo JC, Schuman EM. Miniature neurotransmission stabilizes synaptic function via tonic suppression of local dendritic protein synthesis. Cell. 2006;125:785–799. doi: 10.1016/j.cell.2006.03.040. [DOI] [PubMed] [Google Scholar]
- Sutton MA, Taylor AM, Ito HT, Pham A, Schuman EM. Postsynaptic decoding of neural activity: eEF2 as a biochemical sensor coupling miniature synaptic transmission to local protein synthesis. Neuron. 2007;55:648–661. doi: 10.1016/j.neuron.2007.07.030. [DOI] [PubMed] [Google Scholar]
- Tajiri S, Oyadomari S, Yano S, Morioka M, Gotoh T, Hamada JI, Ushio Y, Mori M. Ischemia-induced neuronal cell death is mediated by the endoplasmic reticulum stress pathway involving CHOP. Cell Death Differ. 2004;11:403–415. doi: 10.1038/sj.cdd.4401365. [DOI] [PubMed] [Google Scholar]
- Tang TS, Tu H, Chan EY, Maximov A, Wang Z, Wellington CL, Hayden MR, Bezprozvanny I. Hungtingtin and Huntingtin-associated protein 1 influence neuronal calcium signaling mediated by inositol-(1,4,5) trisphosphate receptor type 1. Neuron. 2003;39:227–239. doi: 10.1016/s0896-6273(03)00366-0. [DOI] [PMC free article] [PubMed] [Google Scholar]
- Terasaki M, Slater NT, Fein A, Schmidek A, Reese TS. Continuous network of endoplasmic reticulum in cerebellar Purkinje neurons. Proc Natl Acad Sci U S A. 1994;91:7510–7514. doi: 10.1073/pnas.91.16.7510. [DOI] [PMC free article] [PubMed] [Google Scholar]
- Ting JT, Kelley BG, Lambert TJ, Cook DG, Sullivan JM. Amyloid precursor protein overexpression depresses excitatory transmission through both presynaptic and postsynaptic mechanisms. Proc Natl Acad Sci U S A. 2007;104:353–358. doi: 10.1073/pnas.0608807104. [DOI] [PMC free article] [PubMed] [Google Scholar]
- Wasser CR, Kavalali ET. Leaky synapses: regulation of spontaneous neurotransmission in central synapses. Neuroscience. 2009;158:177–188. doi: 10.1016/j.neuroscience.2008.03.028. [DOI] [PMC free article] [PubMed] [Google Scholar]
- Werner ED, Brodsky JL, McCracken AA. Proteasome-dependent endoplasmic reticulum-associated protein degradation: an unconventional route to a familiar fate. Proc Natl Acad Sci U S A. 1996;93:13797–13801. doi: 10.1073/pnas.93.24.13797. [DOI] [PMC free article] [PubMed] [Google Scholar]
- Xu J, Pang ZP, Shin OH, Südhof TC. Synaptotagmin-1 functions as a Ca2+ sensor for spontaneous release. Nat Neurosci. 2009;12:759–766. doi: 10.1038/nn.2320. [DOI] [PMC free article] [PubMed] [Google Scholar]
- Zhang C, Wu B, Beglopoulos V, Wines-Samuelson M, Zhang D, Dragatsis I, Südhof TC, Shen J. Presenilins are essential for regulating neurotransmitter release. Nature. 2009;460:632–636. doi: 10.1038/nature08177. [DOI] [PMC free article] [PubMed] [Google Scholar]