Abstract
The endothelin-1 antagonist, Atrasentan (ABT-627) was used to modify perfusion in the human tumor xenograft model, HT29, growing in nude mice. Atrasentan produced a significant increase in perfusion, as measured in vivo by Gd-DTPA DCE-MRI. Changes in tumor hypoxia were assessed by comparing the binding of two hypoxia tracers, pimonidazole and EF5 given before and after Atrasentan administration. In vehicle-treated controls, the distribution of EF5 and pimonidazole was very similar. However, Atrasentan treatment was associated with decreased uptake of the second hypoxia tracer (EF5), relative to the first (pimonidazole). Although Atrasentan had no independent effect on the growth of HT29 tumors, Atrasentan combined with 20 Gy radiation led to a modest but significant increase in tumor growth delay compared to radiation alone.
Keywords: Atrasentan, tumor hypoxia, tumor perfusion, HT29, pimonidazole, EF5
Introduction
The endothelins (ET-1, ET-2 and ET-3) are 21 amino acid peptides involved primarily in controlling vascular tone. ET1, the most common, is a potent vasoconstrictor that acts through binding to the cell surface receptors ETA and ETB.1 ETA and ETB receptors antagonize each other; ETA receptors induce vasoconstriction, while ETB receptors induce vasodilation. All three endothelins can bind equally to ETB, but only ET-1 and ET-2 can bind ETA.2 ETA receptors are expressed in vascular smooth muscle cells, where ET-1 binding induces vasoconstriction. ETA receptors are also present on a variety of other normal tissues,3–5 and in cancer cells,6–10 where receptor binding suppresses paclitaxel-induced apoptosis11–14 and induces mitogenesis.8,15,16 Multiple ETA antagonists have been advanced into clinical trials, to treat both cancer17–19 and vascular pathologies, principally pulmonary arterial hypertension.20
While oncologists have mostly been interested in the cytotoxicity of inhibiting ETA in tumor cells, recent results from Martinive et al. suggest that the vasodilatory effects of ETA inhibition could increase tumor perfusion, thus enhancing drug delivery21 and reducing tumor hypoxia.22 In vitro, hypoxia has long been known to significantly reduce the cytotoxic effects of ionizing radiation, and reducing tumor hypoxia in the clinic improves the response to radiotherapy.23 Thus ETA blockade offers three advantages in cancer therapy: increased drug supply to the tumor; increased sensitivity to the drug; and increased sensitivity to radiation via better oxygenation. In some radiotherapy protocols, nicotinamide is used to increase perfusion.24 However, nicotinamide does not seem to be effective in every tumor25 and an alternative treatment would be valuable.
The Martinive studies achieved ETA inhibition by the peptide BQ123.21 However BQ123 is not considered a clinically useful agent, partly because of cost issues. Instead pharmaceutical companies have developed a class of agents known as the “sentans,” of which five antagonize both the ETA and ETB receptors, while ten are specific ETA antagonists.20
One such agent is Atrasentan (ABT-627), which is currently in clinical trials.17–19 It is highly specific for the ETA receptor,26 and has been shown to restrict the growth of cervical cancer xenografts27 and enhance the effects of taxane therapy in prostate cancer xenografts.28 Moreover, it has been demonstrated to reduce vasoconstriction in rats29,30 and mice.31 In this report, we asked whether, like BQ123, Atrasentan could increase perfusion and reduce hypoxia in an experimental tumor model.
Hypoxic tissue can be detected through immunohistochemistry using the 2-nitro-imidazole compounds pimonidazole and EF5. Both agents are subject to enzyme-mediated reduction, followed by covalent binding to macromolecules, and the bound adducts can be recognized by antibodies. The process is inhibited in the presence of oxygen. Both pimonidazole and EF5 have been used clinically to determine tumor hypoxia.32,33 By administering nitroimidazole markers separately, it is possible to determine changes in tumor hypoxia in the interval between tracer injections, a technique pioneered by Ljungkvist et al.34
Results
Effect of atrasentan on tumor perfusion
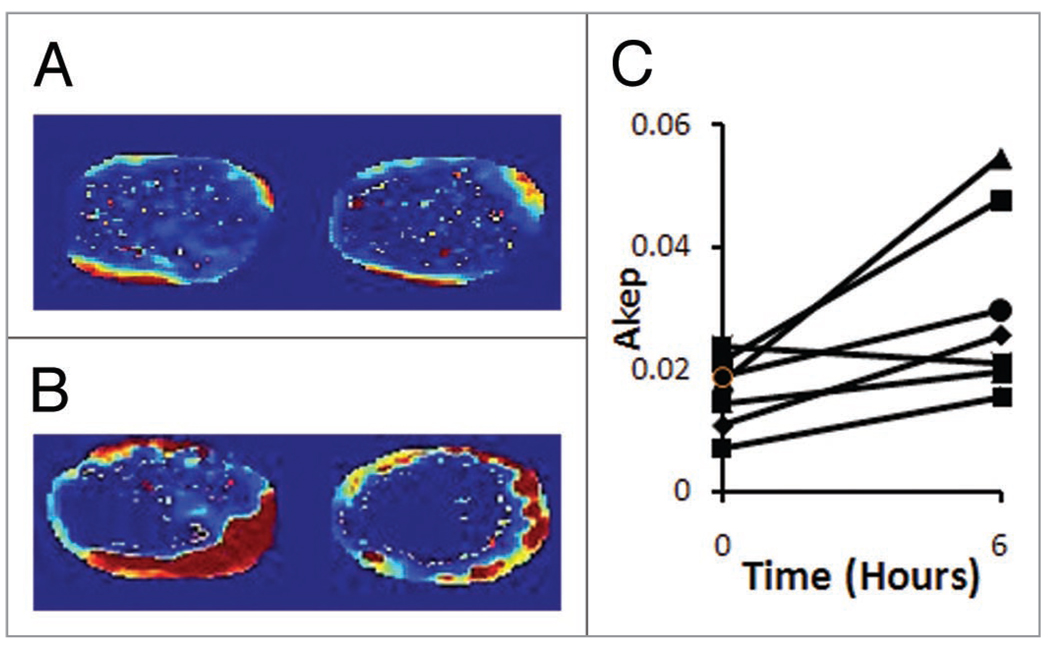
To test whether Atrasentan enhanced tumor perfusion, seven tumor bearing mice were subjected to Gd DTPA DCE MRI. MRI was performed immediately before Atrasentan injection, and repeated six h later. Akep maps of a representative tumor are shown in Figure 1. Areas of highest perfusion are represented in red; areas of lowest perfusion are represented in blue. Figure 1A shows representative MR slices before treatment; Figure 1B shows maps from the same tumor after the treatment. For six out of seven tumors, the median Akep values increased in the post-treatment scan (Fig. 1C). Overall there was a significant increase in the median Akep values after treatment; significance was judged by a two-tailed paired t-test (p = 0.032). Atrasentan treatment approximately doubled tumor Akep values: the mean ratio of Akeps post-treatment relative to pre-treatment was 1.95, with 95% confidence intervals of 1.4–2.5.
Figure 1.
Tumor perfusion as measured by DCE-MRI. (A) Two slices from a pretreatment tumor. (B) Slices from the same tumor 6 h after Atrasentan administration. (C) Median AKep values over the course of the experiment.
Effect of atrasentan on tumor hypoxia
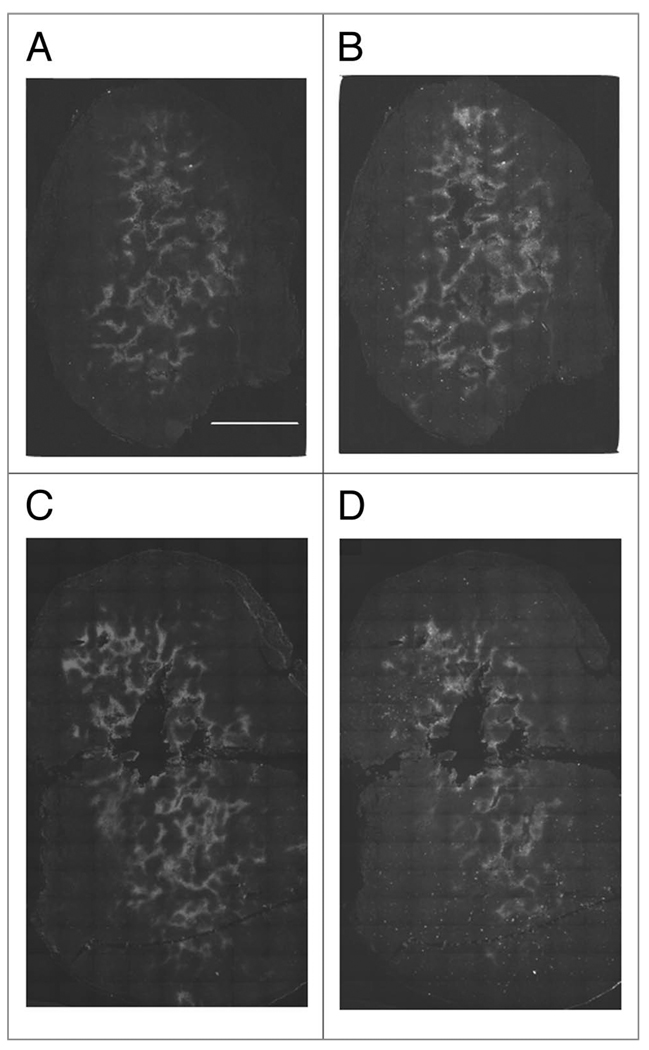
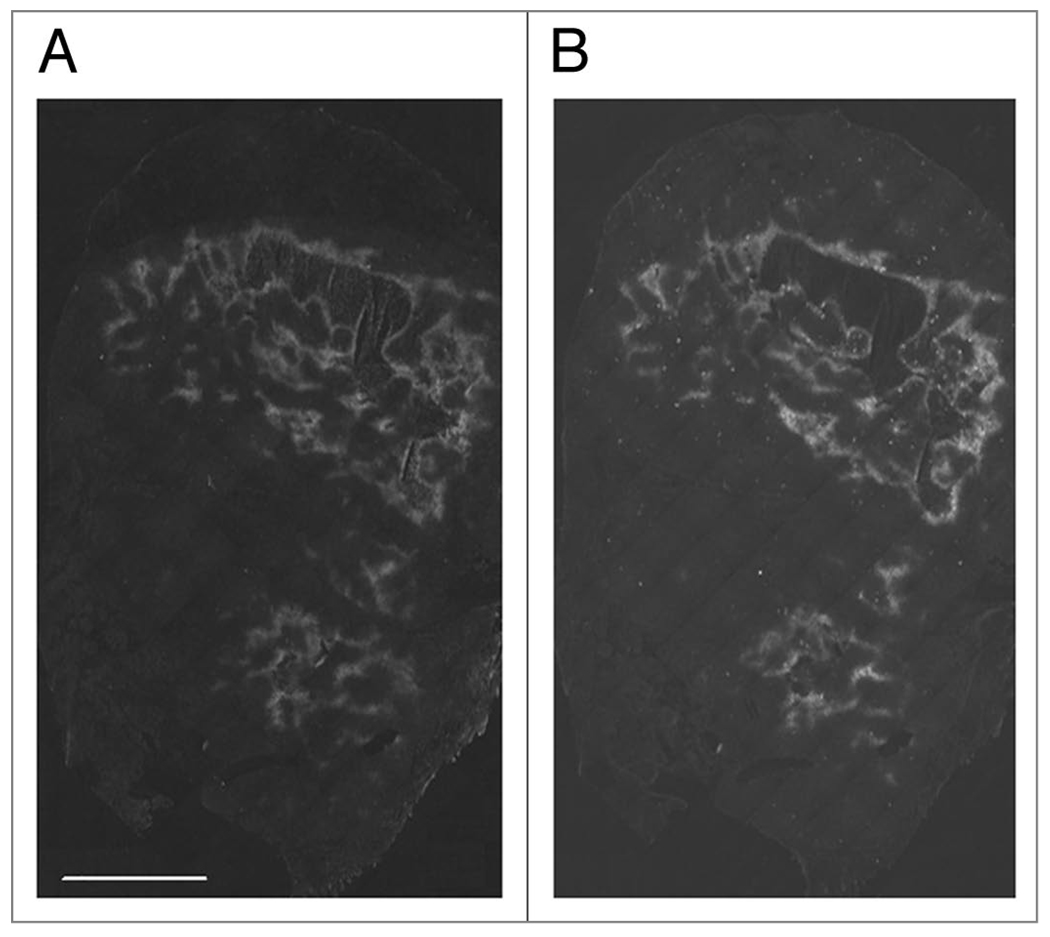
To determine whether increased perfusion would lead to decreased tumor hypoxia, tumor bearing mice were injected with the hypoxia markers pimonidazole and EF5, separated by 24 h. In HT29 tumors we have previously shown that pimonidazole and EF5 yield identical staining patterns when co-injected. We have also shown in this model that tumor hypoxia changes spontaneously over 24 hours, with the appearance of both newly hypoxic and newly oxygenated tissue. However, this effect is very limited in scale; it was not sufficient to prevent the observation of carbogen-induced changes in hypoxia and would not be expected to prevent observation of drug-induced changes in hypoxia.35 We have also shown that this protocol is efficient at detecting artificially induced changes in hypoxia in the HT29 system. A total of four control and five treated mice were used. Figure 2A and B show images of a control tumor stained for pimonidazole and EF5 respectively. The control tumors show good agreement between pimonidazole and EF5—i.e., the staining patterns are remarkably similar. As seen in Figure 2C and D, Atrasentan treatment clearly reduces EF5 (Fig. 2D) uptake relative to pimonidazole (Fig. 2C). Subjectively, it seems to be the case that EF5 uptake is least affected in peri-necrotic tissue. For the tumor in Figure 2C and D, pre-treatment hypoxia is found both adjacent to large areas of necrosis, and spread through the tumor in small islands. It was these islands that were most susceptible to Atrasentan treatment. The tumor shown in Figure 3A and B was also treated with Atrasentan. However, the effect of Atrasentan is not detectable, and this may be due to the largely peri-necrotic nature of the hypoxia found in this tumor.
Figure 2.
Changes in tumor hypoxia after Atrasentan administration. (A) Pimonidazole staining in a control tumor. The scale bar equals 2 mm, and all images are on the same scale. (B) The same section stained for EF5. EF5 was administered 24 h after pimonidazole. (C) Pimonidazole staining in a tumor treated with Atrasentan. (D) The same section stained for EF5.
Figure 3.
Tumor hypoxia after Atrasentan administration. (A) Pimonidazole staining in a tumor treated with Atrasentan. (B) The same section stained for EF5.
Quantitative analysis of immunohistochemical staining
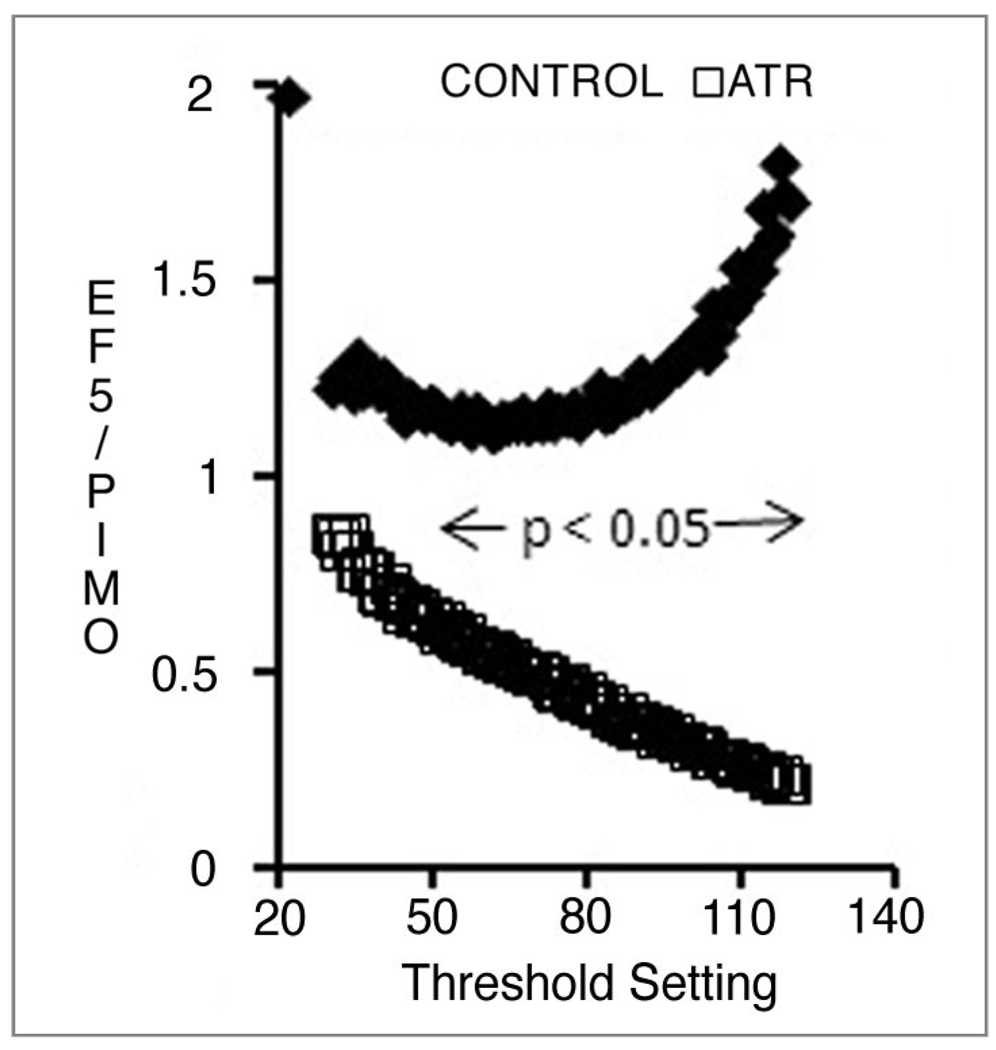
We quantified the staining in two ways: thresholds were applied to the pimonidazole and EF5 images to derive the fractions of the tumor section that was positive for each marker. The results are shown in Table 1, which was derived by applying a threshold of 70 to all images. Threshold values are inevitably arbitrary, and subject to the possibility that a different threshold value would yield different results. To investigate this possibility, we exported all image histograms into Excel and generated positive fractions for each threshold value. In addition statistical significance was calculated for each threshold value using a two-tailed t-test and assigning significance to all p values <0.05. As shown in Figure 4, a significant difference between treated and control images would be obtained over a wide range of threshold values. The upward curve of the controls seems to indicate a discrepancy between EF5 and pimonidazole staining at high thresholds. However, in the control data set at high threshold values there was a lot of scatter, and the ratio of EF5 to pimonidazole was not significantly different from unity. Moreover, using this analysis technique, we have previously found the EF5 to pimonidazole ratio to closely approximate unity.35 Thus we do not think that this plot suggests some fundamental difference in the behavior of these two tracers.
Table 1.
Binary analysis of hypoxia tracer staining
| Percent of section positive for: | ||||
|---|---|---|---|---|
| Pimonidazole | EF5 | EF5/PIMO | p | |
| Control | 10.8 (4.8–16.8) | 11.4 (6.4–16.4) | 1.1 (0.7–1.5) | 0.012 |
| Atrasentan | 9.4 (6.3–12.6) | 4.4 (3.5–5.3) | 0.5 (0.3–0.7) | |
The percent of the tumor section positive was obtained by applying the arbitrarily chosen threshold value of 70 to both markers. Numbers in parentheses represent the 95% confidence range.
Figure 4.
The fraction of tumor area positive for EF5 relative to the fraction positive for pimonidazole, as a function of threshold setting. Points represent the mean of 4 (control) and 5 (Atrasentan-treated) tumors; the horizontal line shows the range over which a statistically significant difference exists between the two groups.
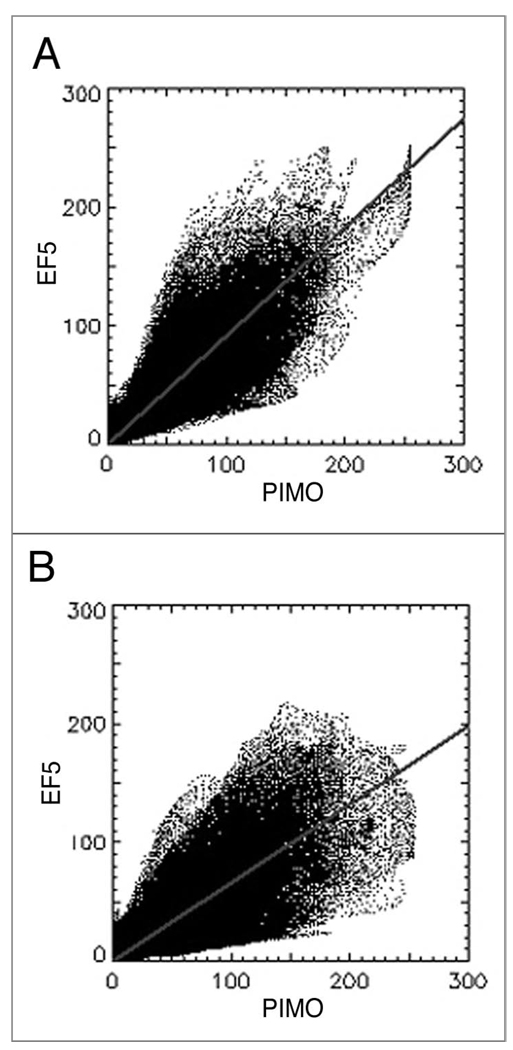
Secondly, the red and green values for each pixel in viable tumor tissue were entered into correlation analysis, using software written in-house. Examples of representative dot-plots generated for control and treated tumors are shown in Figure 5A and B, respectively. The slopes of the regression lines were consistently shallower for treated tumors relative to controls—0.98 compared to 0.69, p = 0.04.
Figure 5.
Representative scatter-plots of EF5 and pimonidazole intensity. (A) control, (B) Atrasentan-treated. Lines represent least squares fit.
Effect of atrasentan on tumor response to radiation
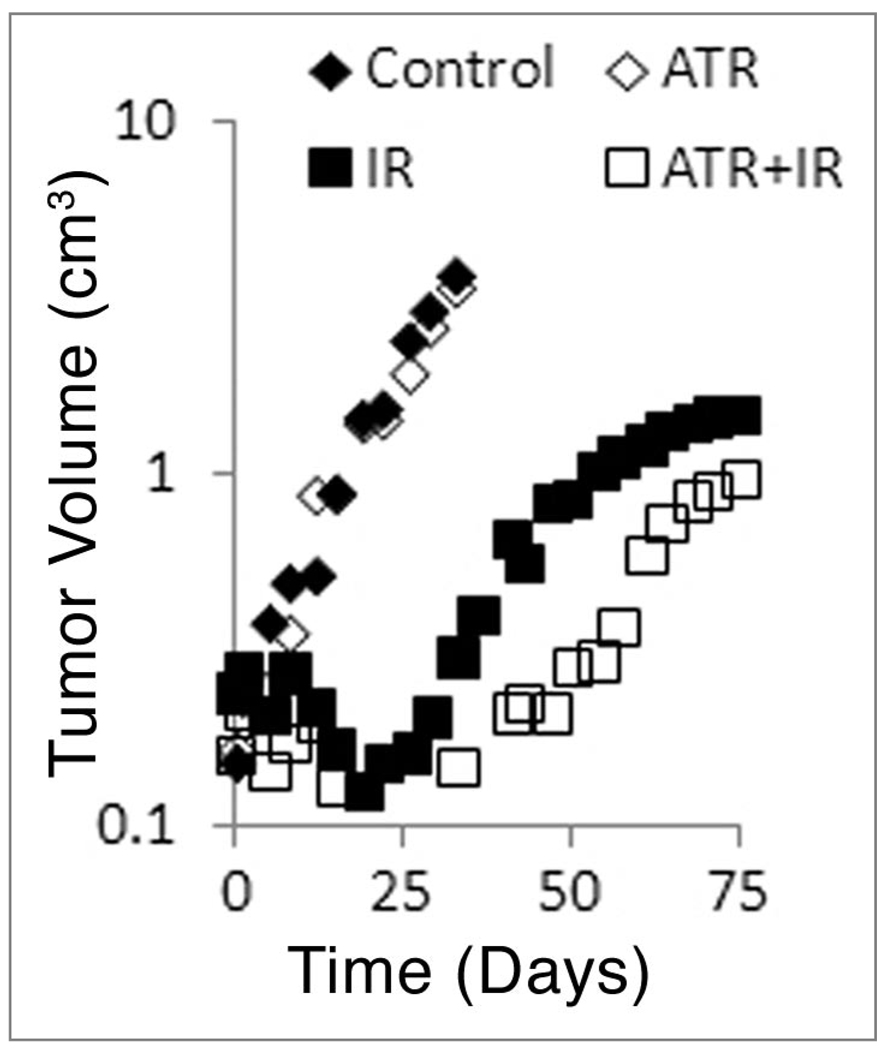
We tested whether the reduced hypoxia that we observed by immunohistochemistry would translate into an increased response to radiation. Figure 6 shows the regrowth of tumors after Atrasentan treatment, 20 Gy ionizing radiation, and Atrasentan plus ionizing radiation. Atrasentan itself had no effect on tumor growth. However, there was a modest increase in the median growth delay when Atrasentan was combined with radiation (52.6 vs. 60.3 d). The data was analyzed by a two-tailed Mann-Whitney test; this yielded a p value of 0.046 for radiation versus radiation plus Atrasentan. Figure 6 shows the median tumor volume, as opposed to the more conventional mean. The median was selected as plotting the mean volume inappropriately overstated the difference between radiation and radiation plus Atrasentan.
Figure 6.
Regrowth of HT29 tumors. Each point represents the median tumor volume at the specified time. The non-normal distribution of tumor volumes precludes the use of the mean. Tumor volume is plotted on a logarithmic scale.
Discussion
We have shown that Atrasentan increases tumor perfusion as measured by Gd DTPA DCE MRI. There was an approximate doubling of the Akep value due to Atrasentan, observable at 6 h after treatment. This time was selected based on work by Opgenorth et al.36 who showed that Atrasentan was active in rats over a period of 4–24 h post-dosing. Also Verhaar et al. showed that while Atrasentan could reduce vasoconstriction in humans, the effect was not seen immediately: they attributed this lag to the time needed to displace Endothelin 1 from the ETA receptor.37 However, Sonveaux et al. were able to demonstrate changes in perfusion and hypoxia in mice one hour after BQ123 administration, 22 suggesting that Atrasentan would also have been active at earlier time points in mice.
Enhanced perfusion was followed by diminished hypoxia. The ratio of EF5 to pimonidazole represents the fractional change in hypoxia over the course of the experiment, and this ratio was significantly lower in treated tumors compared to controls. The ratio of EF5 to pimonidazole is obtained by applying thresholds to the immunostained images and classifying area of tumor as positive or negative. Statistical significance was largely independent of the threshold setting. However, the magnitude of the effect was not: at a threshold of 70 (Table 1), there was an approximately 50% reduction in EF5/pimonidazole in the treated group. This value would increase or decrease with higher or lower threshold values respectively. Thus it is not possible to precisely quantify the effects of Atrasentan on tumor hypoxia.
In this context it should be noted that hypoxia in the HT29 models appears in two patterns: it can be present in apparently viable tissue, or it can be seen bordering large areas of necrosis. Regions of viable hypoxic tissue are generally small, being typically about 100 microns thick. Atrasentan generally did not reduce hypoxia in peri-necrotic regions, but was effective against hypoxia in fully viable tissue. An example of this is shown in Figures 2 and 3.
When Atrasentan was combined with radiation there was a modest but real effect on tumor regrowth. A dose of 20 Gy has been shown to reduce survival in HT29 tumors to well below 1% of the total;38 thus this treatment should have effectively sterilized all non-hypoxic cells in the tumor. Regrowth of the tumor should be due to expansion of those cells which were hypoxic at the time of radiation. Atrasentan could only influence tumor response to 20 Gy by acting on the hypoxic cells in some manner. While the regrowth data does not rule out the possibility that Atrasentan radiosensitized the hypoxic population, based on the results discussed above, we consider it more likely that Atrasentan had reduced the size of the hypoxic population.
However, although Atrasentan could clearly reduce tumor hypoxia, we did not in these experiments observe that it had the ability to abolish hypoxia. Subjectively, the immunochemistry images seemed to indicate that Atrasentan was least effective against peri-necrotic hypoxia, and the MRI images also indicated the largest Atrasentan effect was in the tumor periphery. This may reflect a specific limitation of the agent, or it may be that there is a more general limit to vasodilation, since to enhance tumor perfusion there must first be a concentration of unperfused vessels. Our data suggest that Endothelin-1 antagonism deserves further study as a means to reduce tumor hypoxia, particularly in combination with carbogen, which is currently used to augment nicotinamide-induced vasoldilation.24
Materials and Methods
Tumor model
The human colorectal carcinoma cell line HT29 was obtained from ATCC (Manassas, VA) and maintained in exponential growth phase in McCoy’s 5A modified medium supplemented with 10% fetal calf serum. Xenografts were generated by subcutaneously injecting 5 × 10⁶ tumor cells in 100 µl of PBS in the flank adjacent to the right hind limb of male immune-compromised NCI nu/nu mice (~20 g, Frederick Cancer Research Institute, Frederick, MD). Experiments were performed when tumours reached 10–13 mm in diameter. The mice were maintained and used according to protocols approved by the Institutional Animal Care and Use Committee of Memorial Sloan Kettering Cancer Center.
Animal manipulation
Atrasentan was generously supplied by Abbott Laboratories (Chicago, IL). Atrasentan was dissolved in ethanol at 80 mg/ml, and further diluted in 0.05 N NaOH/saline to 4 mg/ml, pH 12. Atrasentan was prepared prior to each experiment, and injected intraperitoneally at 20 mg/kg, in an injection volume of 0.1 ml. Control animals were injected with vehicle. EF5 (provided by Dr. C.J. Koch), and pimonidazole hydrochloride (Hypoxyprobe-1, HPI, Burlington, MA) were dissolved in PBS and administered via the tail vein at 30, and 120 mg/kg respectively. The injection volumes were 0.2 ml. Pimonidazole and EF5 were injected 24 hours and one hour before sacrifice, respectively. Atrasentan was injected 5 hours before sacrifice.
After the mice were sacrificed, the tumours were removed and frozen in OCT mounting medium (Sakura Finetek, Torrance, CA). Consecutive 10 µm thick sections were cut on a Microm HM500 cryostat microtome (Microm International GmbH, Walldorf, Germany). Each treatment group contained three to four mice.
DCE-MRI
The DCE-MRI experiments were performed on a Bruker 4.7T BioSpin (Bruker, Germany). A syringe filled with the contrast agent Gd-DTPA; 0.1 mmol Gd/kg, (Magnevist®, Berlex Laboratories, Inc., Wayne, NJ) was connected to an INT stopper (B. Braun Medical Inc., Bethlehem, PA) via a Gd-DTPA-filled tubing (Inner Diameter: 0.8 mm, Length: 16 inches, Masterflex Norprene® tubing, 6402-13). Animals were placed prone inside a whole-body bird cage MR coil (diameter, 1.5 inches; length, 5-1/2 inches, Bruker, Germany) with a respiration monitor pad (SA Instruments, Inc., Stonybrook, NY) placed under the abdomen for monitoring during the study. With the help of a horizontal bubble level and the axial MR profile, the tumor was placed in the center of the magnet. The MRI coil was tuned and matched to the proton frequency (200 MHz) inside the magnet, followed by shimming of the sample. The coronal slices of interest were determined from a pilot scan. T2-weighted MR images (Rapid Acquisition with Refocused Echoes: relaxation time, 2,000 ms; excitation time, 40 ms; number of repeat images, 1; number of averages 8; slice thickness 1 mm; number of slices 2; field of view 2 cm × 2.5 cm, matrix = 160 × 128) were acquired to visualize clearly the boundary between tumor and muscle tissue. T1-weighted DCE-MRI (Gradient Echo: relaxation time, 50 ms; excitation time, 2.3 ms; number of repeat images, 125; number of averages, 2; slice thickness, 1 mm; number of slices, 2; field of view, 2 cm × 2.5 cm; matrix = 128 × 96; flip angle, 30°) was performed at 9 s temporal resolution. The contrast agent Gd-DTPA was injected via tail vein after 2 minutes of baseline acquisition followed by 20 minutes of dynamic acquisition. After the MRI acquisition, animals were removed from the animal holder, Atrasentan was injected intraperitoneally, and the animals were returned to the cage. The catheter was kept patent by injection of heparinized saline. Six hours after the baseline DCE-MRI experiment, another DCE-MRI experiment was performed to monitor the change in perfusion due to the injection of drug. The animal was re-positioned in the MR coil and was placed in the center of the magnet following the same procedure as used for the baseline DCE-MRI scan. After shimming, T2-weighted MR images were obtained, followed by T1-weighted DCE-MRI using the same MR parameters with baseline experiment. The contrast agent Gd-DTPA was also injected via tail vein after 2 minutes of baseline acquisition followed by 20 minutes of dynamic acquisition. After post DCE-MRI scan, animals were removed from the MR coil and sacrificed.
MR time-signal curves from tumor slices before and after treatment were obtained from the T1-weighted signal intensity of each individual voxel in the dynamic MR images after Gd-DTPA administration. To obtain these time-signal curves, the reconstructed Bruker MR image files were converted to Analyze format using Micro Bruker2AnlyzeConverter (Bru2Anz, by C. Rorden, Columbia, SC, http://www.sph.sc.edu/comd/rorden/bru2anz.html) software and the MR images in Analyze format were processed with custom-written MatLab (The MathWorks, Inc., Natick, MA) scripts. The experimental time-signal curves for each individual voxel in the MR images were normalized with respect to the baseline signal (averaged over initial 2 minutes of acquisition without the contrast agent) and were fitted using the model developed by Hoffman et al.39 for each slice. This model is based on the linear relationship between measured saturation recovery MR signal and the concentration of Gd-DTPA in the tissue. An amplitude (A), which reflects the degree of relative MR signal enhancement and an exchange rate (kep), which characterizes the velocity of MR signal increase can be obtained via pharmacokinetic modeling of the two compartment model. Consequently, the value of Akep is analogous to the slope of MR signal enhancement for initial time and is considered an approximate measure of vascular flow/perfusion of the tumor tissue. The Hoffman model was used to estimate Akep values of individual voxels from the dynamic build up curves, and Akep maps were generated for tumor slices before and after treatment. It has been observed that the majority of tumors have necrotic regions in the core as verified by modest Gd-DTPA uptake in the core of tumors. To quantify the change in the perfusion of tumor due to the treatment excluding the necrotic area, a mask including a 1.5 mm-thick rim of tumor was generated using T2-weighted images of the corresponding slice. A histogram analysis was performed for both Akep values in the rim of tumors before and after treatment. To calculate the median values of Akep distribution for each rim of tumor, Akep values from two MR slices for each animal were added and one median value was calculated for a corresponding tumor rim before and after treatment. The effect of Atrasentan was assessed by a paired two-tailed t-test; a value of p < 0.05 was considered significant.
Immunohistochemical staining
For EF5 and pimonidazole staining, sections were air-dried for 30 min, fixed in icecold methanol for 30 min and incubated in SuperBlock® (Pierce, Rockford, IL) overnight at 4°C. Cy3 conjugated anti-EF5 (supplied by Dr. C.J. Koch) was applied at a concentration of 75 µg/ml for 1 h at room temperature. Slides were washed three times in PBS, and treated with sheep anti-cyanine (25 µg/ml, US Biologicals, Marblehead, MA) in mouse serum/Superblock (1:1) for one hour at room temperature. Slides were washed again and simultaneously exposed to FITC-conjugated anti-pimonidazole (1:20, HPI) and Alexafluor 568 anti-sheep (InVitrogen, Carlsbad CA) at 20 µg/ml in Superblock. Slides were washed three times and imaged on a fluorescent microscope.
Image acquisition and analysis
Images were acquired using a Nikon Diaphot 300 microscope (Nikon Instruments, Melville, NY) equipped with a xenon arc lamp (Sutter Instrument, Novato, CA) and appropriate filters for FITC and TRITC fluorescence (Chroma Technology, Rockland VT). Entire tumor sections were captured by collecting multiple fields using a ×10 objective lens. Individual fields were acquired using a computer-controlled stage motor (LUDL Electronic Products, Hawthorne, NY) and a Coolsnap cooled charge-coupled device digital camera (Photometrics, Tuscon, AZ). Composite images were stitched together using ImagePro software (MediaCybernetics, Silver Spring, MD). Images were saved in 8-bit format for analysis in Adobe Photoshop (Adobe, San Jose, CA).
Necrosis could be easily recognized on the fluorescent images and these areas were excluded from analysis. For each image, the background (off-section) brightness was obtained, and subtracted from the total image. Then regions displaying the brightest staining of EF5 and pimonidazole were manually selected in Photoshop. The brightness of the top 1% of pixels in this region was used to define the maximum brightness for the entire section. In effect, this assumes that the brightest pixels in the pimonidazole and EF5 images represent the same level of hypoxia—i.e., complete anoxia; and that all sections contain regions of complete anoxia. In defense of this assumption, the brightest regions for both markers were immediately adjacent to areas of necrosis, where complete anoxia would be expected.
Using the Optipix Wide Histogram plugin (Reindeer Graphics, Ashville NC), the histograms of fluorescent intensity were exported to Excel where they were converted into cumulative form. Images of hypoxia markers are frequently analyzed by applying a threshold, and obtaining the positive fraction defined as the fraction of pixels greater than the threshold. Cumulative histograms show how the positive fraction would change as a function of the threshold. Further, it is possible to calculate the ratio of the fraction staining positive for marker 1 compared to marker 2 for each threshold value. This calculation was performed over the threshold range 30–120. A value of 30 is close to background—i.e., the minimum level of fluorescence found throughout the sections. We consider values beyond 120 irrelevant since a threshold value of 120 treats pixels that are clearly positive (they have a brightness more than twice that of background) as negative for marker. This process was applied to all tumors in each treatment group, so that for every threshold value we obtained the mean ratio. Also for each threshold value, controls and treated groups were compared and a p-value obtained, using a two tailed unpaired t-test.
Correlation of red and green fluorescence intensities for each pixel in the viable tumor area was achieved using in-house software written in Interactive Data Language (RSI Boulder, CO). Processed images from Photoshop were imported into the program, where they were co-registered, and regions of interest drawn to exclude areas of necrosis.
Tumor irradiation
5 × 10⁶ HT29 cells were implanted into the right hind leg of male Balb/c athymic nude mice (Shizuoka Laboratory Center, Hamamatsu, Japan). Experiments were performed when the mean tumor volume was 170 mm3. Mice were randomly assigned to one of four groups: control; Atrasentan alone; radiation alone; Atrasentan plus radiation. Atrasentan was delivered as above 6 h prior to radiation. Irradiation was delivered using a 60Co., Teletherapy unit (Theratron 780, Atomic Energy of Canada, Chalk River, Canada) to tumor covered with a 5 mm thick tissue equivalence bolus. Tumors received a single dose of 20 Gy at a dose rate of 122.58 cGy/min. Mice were anesthetized with Zoletil/Xylazine prior to irradiation. Each group contained five animals. Two perpendicular diameters of tumors were measured every two days with a digital caliper and tumor volume was calculated according to the following formula: V (mm3) = π/6 × length × width2. Measurement was continued until tumor volume reached at least four times the starting volume. Growth delay—defined as the time to reach four times the starting volume were compared using a 2-tailed Mann-Whitney test (www.quantitativeskills.com/sisa/). All animal protocols and studies were conducted in accordance with the guidelines of the Institutional Animal Care and Use Committee of the Korea Institute of Radiological and Medical Sciences, Korea.
Acknowledgements
This work was funded by NIH-NCI PO1CA115675-A1, R24CA83084 and CA098505. This publication acknowledges Grant Number NCI P30-CA 08748, which provides partial support for the Research Animal Resource Center. K.M.Y. was supported by funds from the Korean Cancer Research Institute.
Atrasentan was supplied by Abbott Laboratories, Chicago, IL.
Abbreviations
- DCE-MRI
dynamic contrast enhanced magnetic resonance imaging
- EF5
2-(2-nitro-1H-imidazol-1-yl)-N-(2,2,3,3,3-pentafluoropropyl)acetamide
- ET
endothelin
- Gd DTPA
gadolinium diethylenetriaminopentaacetic acid
- IR
ionizing radiation
References
- 1.Nelson J, Bagnato A, Battistini B, Nisen P. The endothelin axis: emerging role in cancer. Nat Rev Cancer. 2003;3:110–116. doi: 10.1038/nrc990. [DOI] [PubMed] [Google Scholar]
- 2.Schneider MP, Boesen EI, Pollock DM. Contrasting actions of endothelin ET(A) and ET(B) receptors in cardiovascular disease. Annu Rev Pharmacol Toxicol. 2007;47:731–759. doi: 10.1146/annurev.pharmtox.47.120505.105134. [DOI] [PMC free article] [PubMed] [Google Scholar]
- 3.Hayasaki Y, Nakajima M, Kitano Y, Iwasaki T, Shimamura T, Iwaki K. ICAM-1 expression on cardiac myocytes and aortic endothelial cells via their specific endothelin receptor subtype. Biochem Biophys Res Commun. 1996;229:817–824. doi: 10.1006/bbrc.1996.1886. [DOI] [PubMed] [Google Scholar]
- 4.Kallakuri S, Kreipke CW, Rossi N, Rafols JA, Petrov T. Spatial alterations in endothelin receptor expression are temporally associated with the altered microcirculation after brain trauma. Neurol Res. 2007;29:362–368. doi: 10.1179/016164107X204675. [DOI] [PubMed] [Google Scholar]
- 5.Yokomori H, Oda M, Ogi M, Kamegaya Y, Tsukada N, Nakamura M, Ishii H. Enhanced expression of endothelin receptor subtypes in cirrhotic rat liver. Liver. 2001;21:114–122. doi: 10.1034/j.1600-0676.2001.021002114.x. [DOI] [PubMed] [Google Scholar]
- 6.Asham E, Shankar A, Loizidou M, Fredericks S, Miller K, Boulos PB, et al. Increased endothelin-1 in colorectal cancer and reduction of tumour growth by ET(A) receptor antagonism. Br J Cancer. 2001;85:1759–1763. doi: 10.1054/bjoc.2001.2193. [DOI] [PMC free article] [PubMed] [Google Scholar]
- 7.Donckier JE, Michel L, Van Beneden R, Delos M, Havaux X. Increased expression of endothelin-1 and its mitogenic receptor ETA in human papillary thyroid carcinoma. Clin Endocrinol (Oxf) 2003;59:354–360. doi: 10.1046/j.1365-2265.2003.01855.x. [DOI] [PubMed] [Google Scholar]
- 8.Ali H, Loizidou M, Dashwood M, Savage F, Sheard C, Taylor I. Stimulation of colorectal cancer cell line growth by ET-1 and its inhibition by ET(A) antagonists. Gut. 2000;47:685–688. doi: 10.1136/gut.47.5.685. [DOI] [PMC free article] [PubMed] [Google Scholar]
- 9.Berry PA, Zhang YF, Carter ND, Jeffery S, Burchill SA. Decreased wild-type full-length Et-A and -B receptors in neuroblastoma and Ewing sarcoma cells. Med Pediatr Oncol. 2001;36:142–146. doi: 10.1002/1096-911X(20010101)36:1<142::AID-MPO1034>3.0.CO;2-Z. [DOI] [PubMed] [Google Scholar]
- 10.Grant ES, Brown T, Roach A, Williams BC, Habib FK. In vitro expression of endothelin-1 (ET-1) and the ETA and ETB ET receptors by the prostatic epithelium and stroma. J Clin Endocrinol Metab. 1997;82:508–513. doi: 10.1210/jcem.82.2.3724. [DOI] [PubMed] [Google Scholar]
- 11.Pflug BR, Zheng H, Udan MS, D’Antonio JM, Marshall FF, Brooks JD, Nelson JB. Endothelin-1 promotes cell survival in renal cell carcinoma through the ET(A) receptor. Cancer Lett. 2007;246:139–148. doi: 10.1016/j.canlet.2006.02.007. [DOI] [PubMed] [Google Scholar]
- 12.Nelson JB, Udan MS, Guruli G, Pflug BR. Endothelin-1 inhibits apoptosis in prostate cancer. Neoplasia. 2005;7:631–637. doi: 10.1593/neo.04787. [DOI] [PMC free article] [PubMed] [Google Scholar]
- 13.Wu-Wong JR, Chiou WJ, Wang J. Extracellular signal-regulated kinases are involved in the antiapoptotic effect of endothelin-1. J Pharmacol Exp Ther. 2000;293:514–521. [PubMed] [Google Scholar]
- 14.Del Bufalo D, Di Castro V, Biroccio A, Varmi M, Salani D, Rosano L, et al. Endothelin-1 protects ovarian carcinoma cells against paclitaxel-induced apoptosis: requirement for Akt activation. Mol Pharmacol. 2002;61:524–532. doi: 10.1124/mol.61.3.524. [DOI] [PubMed] [Google Scholar]
- 15.Panettieri RA, Jr, Goldie RG, Rigby PJ, Eszterhas AJ, Hay DW. Endothelin-1-induced potentiation of human airway smooth muscle proliferation: an ETA receptor-mediated phenomenon. Br J Pharmacol. 1996;118:191–197. doi: 10.1111/j.1476-5381.1996.tb15385.x. [DOI] [PMC free article] [PubMed] [Google Scholar]
- 16.Hafizi S, Allen SP, Goodwin AT, Chester AH, Yacoub MH. Endothelin-1 stimulates proliferation of human coronary smooth muscle cells via the ET(A) receptor and is co-mitogenic with growth factors. Atherosclerosis. 1999;146:351–359. doi: 10.1016/s0021-9150(99)00178-1. [DOI] [PubMed] [Google Scholar]
- 17.Armstrong AJ, Creel P, Turnbull J, Moore C, Jaffe TA, Haley S, et al. A phase I-II study of docetaxel and atrasentan in men with castration-resistant metastatic prostate cancer. Clin Cancer Res. 2008;14:6270–6276. doi: 10.1158/1078-0432.CCR-08-1085. [DOI] [PubMed] [Google Scholar]
- 18.Chiappori AA, Haura E, Rodriguez FA, Boulware D, Kapoor R, Neuger AM, et al. Phase I/II study of atrasentan, an endothelin A receptor antagonist, in combination with paclitaxel and carboplatin as first-line therapy in advanced non-small cell lung cancer. Clin Cancer Res. 2008;14:1464–1469. doi: 10.1158/1078-0432.CCR-07-1508. [DOI] [PubMed] [Google Scholar]
- 19.Nelson JB, Love W, Chin JL, Saad F, Schulman CC, Sleep DJ, et al. Phase 3, randomized, controlled trial of atrasentan in patients with nonmetastatic, hormone-refractory prostate cancer. Cancer. 2008;113:2478–2487. doi: 10.1002/cncr.23864. [DOI] [PMC free article] [PubMed] [Google Scholar]
- 20.Battistini B, Berthiaume N, Kelland NF, Webb DJ, Kohan DE. Profile of past and current clinical trials involving endothelin receptor antagonists: the novel “-sentan” class of drug. Exp Biol Med (Maywood) 2006;231:653–695. [PubMed] [Google Scholar]
- 21.Martinive P, De Wever J, Bouzin C, Baudelet C, Sonveaux P, Grégoire V, et al. Reversal of temporal and spatial heterogeneities in tumor perfusion identifies the tumor vascular tone as a tunable variable to improve drug delivery. Mol Cancer Ther. 2006;5:1620–1627. doi: 10.1158/1535-7163.MCT-05-0472. [DOI] [PubMed] [Google Scholar]
- 22.Sonveaux P, Dessy C, Martinive P, Havaux X, Jordan BF, Gallez B, et al. Endothelin-1 is a critical mediator of myogenic tone in tumor arterioles: implications for cancer treatment. Cancer Res. 2004;64:3209–3214. doi: 10.1158/0008-5472.can-03-1291. [DOI] [PubMed] [Google Scholar]
- 23.Overgaard J. Hypoxic radiosensitization: adored and ignored. J Clin Oncol. 2007;25:4066–4074. doi: 10.1200/JCO.2007.12.7878. [DOI] [PubMed] [Google Scholar]
- 24.Kaanders JH, Bussink J, van der Kogel AJ. ARCON: a novel biology-based approach in radiotherapy. Lancet Oncol. 2002;3:728–737. doi: 10.1016/s1470-2045(02)00929-4. [DOI] [PubMed] [Google Scholar]
- 25.Hulshof MC, Rehmann CJ, Booij J, van Royen EA, Bosch DA, Gonzalez Gonzalez D. Lack of perfusion enhancement after administration of nicotin-amide and carbogen in patients with glioblastoma: a 99mTc-HMPAO SPECT study. Radiother Oncol. 1998;48:135–142. doi: 10.1016/s0167-8140(98)00053-x. [DOI] [PubMed] [Google Scholar]
- 26.Wu-Wong JR, Dixon DB, Chiou WJ, Sorensen BK, Liu G, Jae HS, et al. Pharmacology of endothelin receptor antagonists ABT-627, ABT-546, A-182086 and A-192621: in vitro studies. Clin Sci (Lond) 2002;103:107–111. doi: 10.1042/CS103S107S. [DOI] [PubMed] [Google Scholar]
- 27.Bagnato A, Cirilli A, Salani D, Simeone P, Muller A, Nicotra MR, et al. Growth inhibition of cervix carcinoma cells in vivo by endothelin A receptor blockade. Cancer Res. 2002;62:6381–6384. [PubMed] [Google Scholar]
- 28.Banerjee S, Hussain M, Wang Z, Saliganan A, Che M, Bonfil D, et al. In vitro and in vivo molecular evidence for better therapeutic efficacy of ABT-627 and Taxotere combination in prostate cancer. Cancer Res. 2007;67:3818–3826. doi: 10.1158/0008-5472.CAN-06-3879. [DOI] [PubMed] [Google Scholar]
- 29.Vernerova Z, Kramer HJ, Backer A, Cervenka L, Opocensky M, Huskova Z, et al. Late-onset endothelin receptor blockade in hypertensive heterozygous REN-2 transgenic rats. Vascul Pharmacol. 2008;48:165–173. doi: 10.1016/j.vph.2008.01.009. [DOI] [PubMed] [Google Scholar]
- 30.Sachidanandam K, Elgebaly MM, Harris AK, Hutchinson JR, Mezzetti EM, Portik-Dobos V, Ergul A. Effect of chronic and selective endothelin receptor antagonism on microvascular function in type 2 diabetes. Am J Physiol Heart Circ Physiol. 2008;294:2743–2749. doi: 10.1152/ajpheart.91487.2007. [DOI] [PMC free article] [PubMed] [Google Scholar]
- 31.Fryer RM, Rakestraw PA, Banfor PN, Cox BF, Opgenorth TJ, Reinhart GA. Blood pressure regulation by ETA and ETB receptors in conscious, telemetry-instrumented mice and role of ETA in hypertension produced by selective ETB blockade. Am J Physiol Heart Circ Physiol. 2006;290:2554–2559. doi: 10.1152/ajpheart.01221.2005. [DOI] [PubMed] [Google Scholar]
- 32.Evans SM, Judy KD, Dunphy I, Jenkins WT, Hwang WT, Nelson PT, et al. Hypoxia is important in the biology and aggression of human glial brain tumors. Clin Cancer Res. 2004;10:8177–8184. doi: 10.1158/1078-0432.CCR-04-1081. [DOI] [PubMed] [Google Scholar]
- 33.Kaanders JH, Wijffels KI, Marres HA, Ljungkvist AS, Pop LA, van den Hoogen FJ, et al. Pimonidazole binding and tumor vascularity predict for treatment outcome in head and neck cancer. Cancer Res. 2002;62:7066–7074. [PubMed] [Google Scholar]
- 34.Ljungkvist AS, Bussink J, Rijken PF, Raleigh JA, Denekamp J, Van Der Kogel AJ. Changes in tumor hypoxia measured with a double hypoxic marker technique. Int J Radiat Oncol Biol Phys. 2000;48:1529–1538. doi: 10.1016/s0360-3016(00)00787-2. [DOI] [PubMed] [Google Scholar]
- 35.Russell J, Carlin S, Burke SA, Wen B, Yang KM, Ling CC. Immunohistochemical detection of changes in tumor hypoxia. Int J Radiat Oncol Biol Phys. 2009;73:1177–1186. doi: 10.1016/j.ijrobp.2008.12.004. [DOI] [PMC free article] [PubMed] [Google Scholar]
- 36.Opgenorth TJ, Adler AL, Calzadilla SV, Chiou WJ, Dayton BD, Dixon DB, et al. Pharmacological characterization of A-127722: an orally active and highly potent ETA-selective receptor antagonist. J Pharmacol Exp Ther. 1996;276:473–481. [PubMed] [Google Scholar]
- 37.Verhaar MC, Grahn AY, Van Weerdt AW, Honing ML, Morrison PJ, Yang YP, et al. Pharmacokinetics and pharmacodynamic effects of ABT-627, an oral ETA selective endothelin antagonist, in humans. Br J Clin Pharmacol. 2000;49:562–573. doi: 10.1046/j.1365-2125.2000.00171.x. [DOI] [PMC free article] [PubMed] [Google Scholar]
- 38.Guichard M, Dertinger H, Malaise EP. Radiosensitivity of four human tumor xenografts. Influence of hypoxia and cell-cell contact. Radiat Res. 1983;95:602–609. [PubMed] [Google Scholar]
- 39.Hoffmann U, Brix G, Knopp MV, Hess T, Lorenz WJ. Pharmacokinetic mapping of the breast: a new method for dynamic MR mammography. Magn Reson Med. 1995;33:506–514. doi: 10.1002/mrm.1910330408. [DOI] [PubMed] [Google Scholar]


