

Abstract
The strain of West Nile virus (WNV) currently epidemic in North America contains a genetic mutation elevating its virulence in birds, especially species in the family Corvidae. Although dead American Crows (Corvus brachyrhynchos) have been the hallmark of the epidemic, the overall impact of WNV on North America’s avifauna remains poorly understood and has not been addressed thoroughly in California. Here, we evaluate variation by species in the effect of WNV on California birds from 2004 to 2007 by using (1) seroprevalence in free-ranging birds, (2) percentage of carcasses of each species reported by the public that tested positive for WNV, (3) mortality determined from experimental infections, and (4) population declines detected by trend analysis of Breeding Bird Survey (BBS) data. Using Bayesian linear models, we extrapolate trends in BBS data from 1980–2003 (pre-WNV) to 2004–2007 (post-WNV). We attribute significant declines from expected abundance trends in areas supporting epiornitics to WNV transmission. We combine risk assessed from each of the four data sets to generate an overall score describing WNV risk by species. The susceptibility of California avifauna to WNV varies widely, with overall risk scores ranging from low for the refractory Rock Pigeon (Columba livia) through high for the susceptible American Crow. Other species at high risk include, in descending order, the House Finch (Carpodacus mexicanus), Black-crowned Night-Heron (Nycticorax nycticorax), Western Scrub-Jay (Aphelocoma californica), and Yellow-billed Magpie (Pica nuttalli). Our analyses emphasize the importance of multiple data sources in assessing the effect of an invading pathogen.
Keywords: West Nile virus, California, avifauna
INTRODUCTION
The impact of invading or emerging pathogens can markedly affect a local fauna that has had no immunological or evolutionary history of infection. This scenario is further complicated when the pathogen is vector-borne, because transmission is predicated not only on the virulence of the pathogen and the susceptibility and distributions of both vector and vertebrate hosts but also upon the vector’s pattern of host selection. Collectively the effect of these criteria on a local fauna would be expected to vary by species. Although the invasion of North America by West Nile virus (WNV, Flaviviridae, Flavivirus) has had devastating effects on the health of human beings, domestic animals, and wildlife (Kramer et al. 2008), it also provides a unique opportunity to study the impact of an invading virus on the local host fauna.
The spread of WNV has been rapid and extensive, from New York to California and Canada to Argentina within 5 years (Kramer et al. 2008). The invasion was enabled, in part, by the high virulence of the invading WNV strain in birds, especially corvids (Hayes 2001, Brault et al. 2004), which has been linked to a single mutation on the helicase gene (Brault et al. 2007). Elevated viremia in birds seems critical for WNV to efficiently infect the moderately susceptible native Culex mosquitoes (Komar et al. 2003, Reisen et al. 2005a) that serve as the primary vectors in North America (Turell et al. 2005, Hayes et al. 2005), including California (Reisen et al. 2004b). High virulence has enhanced the virus’s fitness at the cost of elevated mortality in the primary avian hosts (Reisen et al. 2005a), which has been associated with significant avian population declines (LaDeau et al. 2007). Dead corvids have been the hallmark of the North American epidemic and have been used to track its progress and distribution (Eidson 2001, Eidson et al. 2001a, Eidson et al. 2001b, Julian et al. 2002, Eidson 2005, Carney et al. 2005). Although the Corvidae have been the most conspicuous taxon affected by WNV, experimental infections have shown that they are not the only highly susceptible species (Komar et al. 2003, Reisen et al. 2005a), and dead-bird-surveillance programs have reported over 300 species infected with WNV (Komar 2003).
As WNV has spread across North America, the invasion has repeated a relatively consistent regional pattern of quiet introduction, followed by epidemic amplification, and then subsidence (Hayes et al. 2005). Persistence and resurgence seem linked to climate variation (Bell et al. 2006) and to shifts in the hosts’ “herd immunity” and declines in their abundance (Reisen and Brault 2007). Relatively little is known, however, about how WNV has affected populations of North American birds (Kilpatrick et al. 2007). A recent analysis of abundance data from the Breeding Bird Survey (BBS) indicates that some species have declined significantly since the arrival of WNV, whereas others have remained unaffected (LaDeau et al. 2007). A view of similar data from California (Koenig et al. 2007) also suggested declines for some species, but these conclusions were based on change over a single year that preceded several years of peak WNV activity in central and northern California and on data aggregated from regions of California with very different levels of WNV activity. Our review of BBS data from California over the past 25 years has shown that numbers of some species fluctuate markedly, some declining prior to the arrival of WNV, complicating the interpretation of trends in avian abundance without additional supporting information.
Our current research tested the hypothesis that the high virulence of the invading NY99 strain and the NA, or WN02, strain that has displaced it (Kramer et al. 2008) has resulted in significant declines in populations of highly susceptible birds. California provided a unique location for our investigation because levels of WNV activity vary among the state’s varied landscapes, the endemic arboviruses (now including WNV) have been well-investigated, and a well-organized surveillance program actively tracks WNV in time and space. To test our hypothesis, we aggregated data from California into four sets: (1) seroprevalence of WNV in free-ranging birds, (2) prevalence of infection in dead birds tested through the California Dead Bird Surveillance program, (3) host-competence studies from our laboratory and the literature, and (4) BBS data analyzed by Bayesian generalized linear mixed models to identify whether each species’ abundance declined significantly following the invasion of WNV. Each data set was analyzed, and species was assigned a WNV-associated risk. Scores from each data set then were combined into an overall assessment of risk by species, demonstrating the impact of WNV on the avifauna of California. Depopulation of key avian host species undoubtedly affects WNV amplification and may, in part, delineate risk of human outbreaks of disease.
METHODS AND MATERIALS
SEROLOGY OF FREE-RANGING BIRDS
We measured the levels of antibodies in free-ranging living birds collected in agricultural, wetland, and urban/suburban landscapes from January 2003 through August 2007 at three locations with repeated WNV activity (Hom et al. 2005, Hom et al. 2006, Feiszli et al. 2007) situated along a south-to-north transect: (1) Coachella Valley near the Salton Sea in Riverside County, (2) San Joaquin Valley near Bakersfield in Kern County, and (3) Sacramento Valley near Davis in Yolo County (Fig. 1). Birds were captured weekly or biweekly in 10–15 mist nets and grain-baited traps, identified to species, aged and sexed when possible, banded with USGS bands, bled by jugular or brachial venipuncture (0.1 mL blood collected by syringe with 28-gauge needles and expressed into 0.9 mL saline), and released at the site of capture. Samples were centrifuged and the diluted sera were sent to the Arbovirus Laboratory at the Center for Vectorborne Diseases (CVEC), where they were screened for antibodies with crude antigen prepared from the Kern217 strain of St. Louis encephalitis virus (SLEV) with an enzyme immunoassay (EIA) (Chiles and Reisen 1998). Our SLEV antigen cross-reacts strongly with WNV antibodies (Fang and Reisen 2006). We retested 1986 sera positive in the EIA by the plaque-reduction neutralization test (PRNT90); 60% of the positive results were attributed to prior WNV infection, 2% to SLEV infection, with titers >4 × that of the competing virus. The remaining 38% of the EIA positives had PRNT90 titers ≤1:20, insufficient for specific virus identification. Overall, 85% of EIA positives were confirmed by PRNT90 with titers ≥1:20. Since the invasion of WNV in 2003, SLEV essentially has been eliminated from California (Reisen et al. 2008a, 2008b), and therefore we attributed the sera unidentified by the EIA but positive against our SLEV antigen to previous infection with WNV. The handling and sampling of wild birds was done under protocols approved by the Institutional Animal Care and Use Committee of the University of California, Davis, and permits from the State of California Department of Fish and Game and the USGS Bird Banding Laboratory.
FIGURE 1.
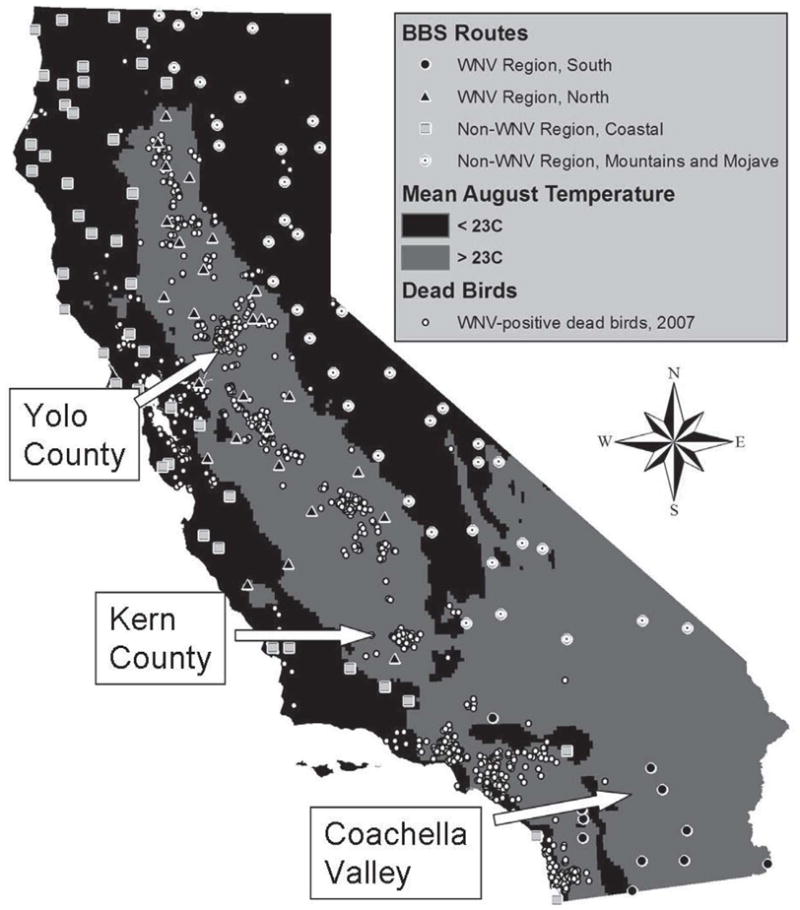
Locations of Breeding Bird Survey routes, coded by region, and West Nile virus-positive dead birds found during 2007. The BBS routes are apportioned among four regions: south WNV region, average August temperatures ≥23°C south of the Tehachapi Mountains; north WNV region, average August temperatures ≥23°C north of the Tehachapi Mountains; low-temperature coastal region, coastal areas with low WNV activity and August temperatures <23°C; mountain and Mojave region, mountains and high-elevation deserts with average August temperatures <23°C or low WNV activity due to few mosquitoes. Arrows show the areas where free-ranging birds were sampled for antibody prevalence: Coachella Valley, Kern County, and Yolo County.
CALIFORNIA DEAD BIRD SURVEILLANCE PROGRAM
To enhance surveillance for WNV, in 2002 the California Department of Public Health established a program for reporting and testing dead birds (McCaughey et al. 2003), although WNV-positive birds were not detected until 2003 (Reisen et al. 2004b). Birds dead for <24 hrs and reported by the public to the Dead Bird Hotline were gathered by local agencies, especially mosquito- and vector-control districts, and shipped to the California Animal Health and Food Safety Laboratory (CAHFS), where they were necropsied. Kidney samples were sent to CVEC, where they were tested for WNV RNA by real-time reverse transcription-polymerase chain reaction (RT-PCR) with previously published primers (Lanciotti et al. 2000). Oral swabs from some American Crows (Corvus brachyrhynchos) tested for WNV antigen by local agencies with RAMP® (Response Biomedical Corporation, Burnaby, BC) or VecTest® (Microgenics Corporation, Fremont, CA) also were included in the data set. Oral swabs tested by RAMP or VecTest from species other than American Crows were less reliable (Padgett et al. 2006) and required confirmation by CVEC for inclusion.
EXPERIMENTAL INFECTIONS
We compiled results of experimental infections from the literature (Komar et al. 2003, 2005, Reisen et al. 2005a, Reisen et al. 2006d) and our unpublished experiments. Birds used in our experimental infections were captured in Kern or Riverside counties and transported to the Arbovirus Field Station in Bakersfield, where they were held in mosquito-proof aviaries for 1–2 weeks to ensure cage adaptation and for observation of general health. Prior to the start of each experiment, birds were sampled for antibodies to WNV, SLEV, and western equine encephalitis virus to ensure that they had no history of infection. Birds then were inoculated subcutaneously with 100 μl of virus diluent containing 100–5000 plaque-forming units (PFU) of WNV (NY99 strain 35211 AAF 9/23/99 isolated from a flamingo that died at the Bronx Zoo), a range within the viral doses expectorated by Culex mosquitoes (Reisen et al. 2005a, Colton and Nasci 2006). A similar strain of WNV was used in related studies (Komar et al. 2003, Komar et al. 2005). Birds were examined daily for mortality and bled by jugular venipuncture for 6 or 7 days to assess viremia. Blood samples consisted of 0.1 mL of blood expressed into 0.4 mL of viral diluent (phosphate-buffered saline, 15% fetal bovine sera, and antibiotics), clarified by centrifugation and frozen at −80°C until tested at CVEC. Viremia titers were determined by standard Vero-cell-plaque assay (Kramer et al. 2002). We calculated a host- or reservoir-competence index (Komar et al. 2003) that combined three parameters: avian susceptibility, mean daily infectiousness to mosquitoes based on daily avian viremia, and the duration of avian infectiousness. Mean daily infectiousness was based on a regression function calculated from the proportion of Culex pipiens becoming infected plotted as a function of the log10 of WNV viremia titers in donor chickens (Turell et al. 2000). Duration of infectiousness was based on the number of days that the mean viremia exceeded 5 log10 PFU mL−1, the approximate minimal threshold for infection. Although in California Culex appears to be more susceptible (Goddard et al. 2002, Reisen et al. 2005a) to WNV infection than eastern C. pipiens on which the linear regression function was based, we retained this function to allow comparison of our values to those in the literature (Komar et al. 2003). Our index also produced a range of values greater than the revision of this index by Kilpatrick et al. (2007). The collection, bleeding, and infection of wild birds with encephalitis viruses was done under protocols approved by the Institutional Animal Care and Use Committee of the University of California, Davis, scientific collection permits from the California Department of Fish and Game, and U.S. Fish and Wildlife Service permits. Use of arboviruses for avian infection was approved under a biological-use-authorization permit by the Environmental Health and Safety Committee of the University of California, Davis, and U.S. Department of Agriculture permits.
TREND ANALYSIS USING BREEDING BIRD SURVEY DATA
Using a Bayesian Poisson regression model (LaDeau et al. 2007) on BBS data from 1980 to 2003, before WNV invaded California, we projected trends in BBS data (Sauer et al. 2004) to predict bird counts in California from 2004 to 2007 if WNV had not arrived. We devised models for 26 species (Table 4) having a broad range of susceptibility to WNV. Counts during midsummer 2003 were made before the detection of WNV in southern California (Reisen et al. 2004b), so we considered 2003 a WNV-negative year. Counts for each route in year t were assumed to be conditionally Poisson with their expected values, λijkt, given by the following function:
where β1 is a linear trend over years centered at mean year t* for all routes in region i, β2 is an adjustment for the December–March multivariate El Niño/Southern Oscillation index (MEI), and Φ and Ω are random effects to account for differences by route, j, and by observer, k, respectively. The MEI is a broad indicator of meteorological conditions in a year, and models were fit separately with and without the MEI for each species; the model with the lowest deviance-information criterion (Spiegelhalter et al. 2002) was retained. All unknown model parameters were given noninformative priors; i.e., random terms were normally distributed with means of zero and had standard deviations with uniform (0.01, 10) hyperprior distributions. Models were fit by means of WinBUGS 1.4.3 (Lunn et al. 2000) and run for 30,000 iterations following a 20,000-iteration “burn-in.” Convergence was confirmed by visual inspection of sampling histories and the Gelman–Rubin statistic (Brooks and Gelman 1998).
TABLE 4.
Bayesian Poisson regression models calculated from Breeding Bird Survey data for four regions of California with varying levels of WNV transmission intensity (see Fig. 1). Inclusion of the term for the multivariate ENSO index [MEI] in the models indicated.
| Species | MEI in model | Region |
Risk Score | |||||||||||||||
|---|---|---|---|---|---|---|---|---|---|---|---|---|---|---|---|---|---|---|
| Southern WNV | Northern WNV | Low-temp Coastal | Mtns. and Mojave | |||||||||||||||
| Year | 04 | 05 | 06 | 07 | 04 | 05 | 06 | 07 | 04 | 05 | 06 | 07 | 04 | 05 | 06 | 07 | ||
| American Crow, Corvus brachyrhynchos | Y | — | 0 | — | — | 0 | 0 | — | — | 0 | 0 | 0 | 0 | — | — | — | — | 4 |
| House Finch, Carpodacus mexicanus | Y | + | 0 | 0 | 0 | — | — | — | — | 0 | 0 | 0 | 0 | — | — | — | 0 | 4 |
| Oak Titmouse, Baeolophus inornatus | N | + | — | 0 | — | 0 | 0 | 0 | 0 | — | 0 | — | 0 | 0 | — | 0 | — | 3 |
| Steller’s Jay, Cyanocitta stelleri | N | 0 | — | — | 0 | + | + | — | — | 0 | 0 | 0 | 0 | 3a | ||||
| Yellow-billed Magpie, Pica nuttalli | Y | 0 | 0 | — | — | + | 0 | 0 | — | 3a | ||||||||
| Brewer’s Blackbird, Euphagus cyanocephalus | Y | 0 | + | 0 | — | 0 | 0 | 0 | 0 | 0 | 0 | 0 | 0 | — | + | — | + | 2 |
| California Towhee, Pipilo crissalis | N | 0 | 0 | 0 | 0 | 0 | 0 | 0 | 0 | — | 0 | — | — | 0 | 0 | 0 | + | 2 |
| House Sparrow, Passer domesticus | Y | 0 | 0 | 0 | 0 | 0 | — | — | + | — | 0 | 0 | 0 | 0 | 0 | 0 | 0 | 2 |
| House Wren, Troglodytes aedon | Y | 0 | + | + | 0 | — | 0 | 0 | 0 | 0 | + | 0 | — | 0 | 0 | 0 | — | 2 |
| Northern Mockingbird, Mimus polyglottos | Y | 0 | 0 | 0 | 0 | + | 0 | 0 | 0 | 0 | 0 | 0 | 0 | — | + | — | — | 2 |
| Song Sparrow, Melospiza melodia | N | — | — | — | — | 0 | 0 | 0 | 0 | 0 | 0 | 0 | 0 | 0 | 0 | + | 0 | 2 |
| Western Scrub-Jay, Aphelocoma californica | Y | 0 | 0 | — | 0 | 0 | — | — | — | 0 | 0 | 0 | 0 | 0 | 0 | 0 | 0 | 2 |
| American Kestrel, Falco sparverius | Y | 0 | 0 | 0 | 0 | 0 | 0 | 0 | 0 | 0 | 0 | 0 | 0 | 0 | 0 | 0 | + | 1 |
| American Robin, Turdus migratorius | Y | 0 | 0 | 0 | + | 0 | 0 | 0 | — | 0 | 0 | 0 | 0 | 1 | ||||
| Black-headed Grosbeak, Pheucticus melanocephalus | N | 0 | 0 | 0 | 0 | 0 | 0 | 0 | 0 | + | 0 | 0 | 0 | 0 | 0 | 0 | 0 | 1 |
| Brown-headed Cowbird, Molothrus ater | N | 0 | 0 | 0 | 0 | 0 | 0 | 0 | 0 | 0 | 0 | 0 | 0 | 0 | — | 0 | + | 1 |
| California Quail, Callipepla californica | Y | 0 | + | + | + | 0 | + | 0 | — | + | + | 0 | — | 0 | + | + | 0 | 1 |
| Common Raven, Corvus corax | N | + | + | + | + | 0 | + | + | 0 | — | 0 | 0 | 0 | 0 | 0 | 0 | 0 | 1 |
| Loggerhead Shrike, Lanius ludovicianus | N | + | + | 0 | 0 | 0 | 0 | 0 | — | 0 | + | 0 | 0 | + | 0 | 0 | 0 | 1 |
| Mourning Dove, Zenaida macroura | Y | + | 0 | 0 | 0 | + | — | 0 | + | 0 | — | 0 | + | 0 | 0 | 0 | + | 1 |
| Orange-crowned Warbler, Vermivora celata | N | 0 | 0 | 0 | 0 | 0 | 0 | — | — | 0 | 0 | 0 | 0 | 1 | ||||
| Red-shouldered Hawk, Buteo lineatus | N | 0 | 0 | 0 | 0 | 0 | 0 | 0 | — | 0 | 0 | 0 | + | 1 | ||||
| Red-tailed Hawk, Buteo jamaicensis | N | 0 | 0 | 0 | 0 | 0 | 0 | 0 | — | 0 | + | + | 0 | 0 | 0 | 0 | 0 | 1 |
| Red-winged Blackbird, Agelaius phoeniceus | Y | 0 | — | + | + | + | — | 0 | + | 0 | 0 | 0 | 0 | 0 | 0 | + | + | 1 |
| Western Bluebird, Sialia mexicana | Y | 0 | + | — | + | 0 | + | 0 | + | + | + | 0 | 0 | — | 0 | 0 | 0 | 1 |
| Western Tanager, Piranga ludoviciana | Y | 0 | 0 | 0 | 0 | 0 | 0 | 0 | 0 | 0 | 0 | 0 | 0 | 0 | 0 | 0 | 0 | 1 |
Weighted for number of regions analyzed.
We used 121 BBS routes throughout California with at least eight observations during the 24 years preceding the advent of WNV (1980–2003, 33% of observation years) and with at least one observation 2004–2007, since the arrival of WNV. We considered the numbers of runs of many routes inadequate, so we did not extrapolate trends from results from those routes. Our criteria for accepting a route were less stringent than those of previous studies (LaDeau et al. 2007) because we were limited by data from fewer routes. We divided California into four regions based on (1) temperature as a proxy measure of WNV-transmission activity by mosquitoes, (2) WNV-related avian mortality from the dead-bird program, and (3) physical geography and distributions of vectors and avian hosts. We used the mean monthly August temperature of ≥23°C to segregate BBS routes into regions of high and low WNV activity, because above this temperature the mean extrinsic incubation period of WNV in Culex tarsalis is <2 weeks (Reisen et al. 2006), increasing the efficiency of WNV transmission. BBS routes with average August temperatures ≥23°C south and north of the Tehachapi Mountains were defined as the southern and northern WNV regions, respectively. Routes located in coastal areas with low WNV activity and August temperatures <23°C constituted the low-temperature coastal region. Routes within mountains and high-elevation deserts with average August temperatures <23°C or low WNV activity due to few mosquitoes and avian hosts were aggregated into the Mountain and Mojave region (Fig. 1).
Using models fitted to BBS data from 1980 to 2003, we projected 95% prediction intervals (PIs) for the expected numbers of birds per route for each region for the years 2004–2007. Observed means per route for the same regions over the next 4 years were compared to the PIs, and two or more consecutive years above or below the PIs were considered to be evidence for a significant departure from the long-term trend. Model results also were compared among species based on their response to experimental infection (see above) and among regions and years with varying levels of WNV activity (Hom et al. 2005, Hom et al. 2006, Feiszli et al. 2007).
SYNTHESIS: RISK ASSESSMENT
Within each of the four data sets we scored species according to perceived risk of WNV and then averaged the scores for an overall risk assessment. For the serology data risk was based on the percentage of birds tested that had flavivirus-positive sera. Because positive individuals had survived WNV infection, we assigned higher risk scores to species with higher seroprevalence and therefore a history of frequent infection. Presumably, birds with low seroprevelance were not bitten frequently by infectious mosquitoes or, in some species, succumbed frequently during acute infection and were not available for collection. Low frequency of vector contact could be related to either the mosquito’s preferences for its blood-meal host or the bird’s unavailability during the transmission season (e.g., migrants, distribution). Species with flavivirus seroprevalence <1% received a risk score of 1, those between 1% and 5% received a 2, those between 5% and 10% received a 3, and those >10% received the highest risk score of 4.
For the California Dead Bird Surveillance program’s data risk was based on the percentage of dead birds that tested WNV-positive. Species with an infection prevalence <10% received a 1, those between 10% and 15% received a 2, those between 15% and 30% received a 3, and those >30% received a 4.
For birds experimentally inoculated with WNV, risk was based on mortality. If all individuals survived, the species received a low risk score of 1, if mortality was >0–25% it received a 2, if mortality was 25–<50% it received a 3, and if mortality was 50–100% it received a 4. These mortality ranges were broad but reflected the range of response by the species tested.
Trends in the BBS data were scored by the number of years within each region in which populations declined below the 95% PI. The risk score was based on the total number of region-years of significant decline, where 0–2 years in decline rated the species a 1, 3–4 years rated a 2, 5–6 years rated a 3, and >6 years rated a 4.
RESULTS
The invasion by WNV has had a variable and often unpredictable impact on the avifauna of California, owing to the variable response of the various species following infection and their relative availability to host-seeking infectious vector mosquitoes. Interpretation was not straightforward and required the integration and synthesis of four data sets.
SEROLOGY OF WILD BIRDS
Serological data determined which species were exposed naturally to WNV, survived, and were captured by our sampling program. Of the 25 116 wild birds of 40 families tested for antibodies, 1986 were Flavivirus-positive by EIA. Of these, 1695 sera had neutralizing antibodies for WNV with PRNT titers ≥1:20. No birds collected after 2003 were SLEV-positive, although titers of several from the Coachella Valley were equivocal and considered to be evidence of dual infections (Reisen et al. 2008b). EIA results were used to establish risk, because PRNTs often fail to confirm new or very old infections (Reisen et al. 2004a) and we wanted to be as comprehensive as possible in evaluating these data. The high percentage of EIAs confirmed by PRNT (85%) validated our use of EIA results as evidence of previous WNV infection. Species testing positive and sampled on ≥25 occasions were ranked by order of seroprevalence (Table 1). Generally, seroprevalence was highest in moderately large-bodied species, such as doves and quail, which survive experimental WNV infection. A notable departure was the Western Scrub-Jay (Aphelocoma californica) in the family Corvidae, which frequently tested positive for WNV in the dead-bird program (Table 2), had an 83% mortality rate following experimental infection (Table 3), and yet had the second-highest overall seroprevalence (Table 1). If the results of experimental infection reflect mortality in the field, these data indicate that most individuals in some Western Scrub-Jay populations were infected with WNV during every transmission season. In Bakersfield in 2006, for example, this species’ seroprevalence was 57% (Carroll et al. 2007). Collectively, these data indicate that infectious mosquitoes frequently select large birds. Although bird size and infection rate were significantly correlated (Fig. 2), only 16% of the variance in flavivirus seroprevalence was explained by mean body weight (R2 = 0.159, df = 1, 34, P = 0.016).
TABLE 1.
Seasonal status, serology, and associated risk of free-ranging birds. Birds were collected in grain-baited traps and mist nets from the Coachella Valley, Kern County, and Yolo County, California, and tested for antibodies by enzyme immunoassay. Table limited to birds tested on >25 occasions and found positive more than once.
| Species | Seasonal status | Total sampled | % Flavivirus positive | Risk score |
|---|---|---|---|---|
| Least Bittern, Ixobrychus exilis | Year-round | 41 | 48.8 | 4 |
| Western Scrub-Jay, Aphelocoma californica | Year-round | 794 | 28.2 | 4 |
| California Quail, Callipepla californica | Year-round | 2156 | 27.6 | 4 |
| Rock Pigeon, Columba livia | Year-round | 446 | 18.2 | 4 |
| Common Ground-Dove, Columbina passerina | Year-round | 275 | 16.7 | 4 |
| House Finch, Carpodacus mexicanus | Year-round | 2255 | 11.8 | 4 |
| Snowy Egret, Egretta thula | Year-round | 79 | 11.4 | 4 |
| Mourning Dove, Zenaida macroura | Year-round | 2987 | 11.2 | 4 |
| Black-crowned Night-Heron, Nycticorax nycticorax | Year-round | 107 | 11.2 | 4 |
| Loggerhead Shrike, Lanius ludovicianus | Year-round | 67 | 10.4 | 4 |
| Gambel’s Quail, Callipepla gambelii | Year-round | 1488 | 9.5 | 3 |
| Ash-throated Flycatcher, Myiarchus cinerascens | Breeding | 39 | 7.7 | 3 |
| Brewer’s Blackbird, Euphagus cyanocephalus | Year-round | 94 | 6.4 | 3 |
| California Thrasher, Toxostoma redivivum | Year-round | 197 | 6.1 | 3 |
| Tricolored Blackbird, Agelaius tricolor | Year-round | 48 | 4.2 | 2 |
| Black-headed Grosbeak, Pheucticus melanocephalus | Breeding | 76 | 3.9 | 2 |
| House Sparrow, Passer domesticus | Year-round | 1634 | 3.9 | 2 |
| Yellow-billed Magpie, Pica nuttalli | Year-round | 57 | 3.5 | 2 |
| Bewick’s Wren, Thryomanes bewickii | Year-round | 122 | 3.3 | 2 |
| American Goldfinch, Carduelis tristis | Year-round | 31 | 3.2 | 2 |
| Northern Mockingbird, Mimus polyglottos | Year-round | 157 | 3.2 | 2 |
| Common Yellowthroat, Geothlypis trichas | Year-round | 324 | 2.2 | 2 |
| Ruby-crowned Kinglet, Regulus calendula | Wintering | 94 | 2.1 | 2 |
| Western Kingbird, Tyrannus verticalis | Breeding | 108 | 1.9 | 2 |
| Bullock’s Oriole, Icterus bullockii | Breeding | 267 | 1.5 | 2 |
| Abert’s Towhee, Pipilo aberti | Year-round | 172 | 1.2 | 2 |
| Song Sparrow, Melospiza melodia | Year-round | 1,046 | 1.1 | 2 |
| Tree Swallow, Tachycineta bicolor | Breeding | 205 | 1.0 | 1 |
| White-crowned Sparrow, Zonotrichia leucophrys | Wintering | 4,225 | 1.0 | 1 |
| Marsh Wren, Cistothorus palustris | Year-round | 336 | 0.9 | 1 |
| MacGillivray’s Warbler, Oporornis tolmiei | Migratory | 114 | 0.9 | 1 |
| Golden-crowned Sparrow, Zonotrichia atricapilla | Wintering | 579 | 0.9 | 1 |
| Red-winged Blackbird, Agelaius phoeniceus | Year-round | 460 | 0.7 | 1 |
| Lincoln’s Sparrow, Melospiza lincolnii | Wintering | 364 | 0.5 | 1 |
| Savannah Sparrow, Passerculus sandwichensis | Wintering | 480 | 0.4 | 1 |
| Yellow Warbler, Dendroica petechia | Migratory | 436 | 0.2 | 1 |
| Wilson’s Warbler, Wilsonia pusilla | Migratory | 845 | 0.1 | 1 |
TABLE 2.
Percentage of dead birds, turned in by the public, testing positive for WNV, and their associated risk. Species included were tested on 25 or more occasions and found WNV positive at least once.
| Species | Number tested | Percent WNV positive | Risk score |
|---|---|---|---|
| Yellow-billed Magpie, Pica nuttalli | 1183 | 74.3 | 4 |
| Western Scrub-Jay, Aphelocoma californica | 3336 | 59.1 | 4 |
| American Crow, Corvus brachyrhynchos | 9040 | 48.8 | 4 |
| Oak Titmouse, Baeolophus inornatus | 28 | 42.9 | 4 |
| American Kestrel, Falco sparverius | 87 | 40.2 | 4 |
| Steller’s Jay, Cyanocitta stelleri | 325 | 34.8 | 4 |
| Western Bluebird, Sialia mexicana | 89 | 31.5 | 4 |
| Red-tailed Hawk, Buteo jamaicensis | 211 | 27.5 | 3 |
| Sharp-shinned Hawk, Accipiter striatus | 153 | 23.5 | 3 |
| Western Screech-Owl, Megascops kennicottii | 52 | 23.1 | 3 |
| Western Tanager, Piranga ludoviciana | 102 | 22.5 | 3 |
| Green Heron, Butorides virescens | 30 | 20.0 | 3 |
| House Finch, Carpodacus mexicanus | 1398 | 19.6 | 3 |
| Lesser Goldfinch, Carduelis psaltria | 243 | 18.1 | 3 |
| Snowy Egret, Egretta thula | 45 | 17.8 | 3 |
| American Robin, Turdus migratorius | 537 | 16.9 | 3 |
| Acorn Woodpecker, Melanerpes formicivorus | 101 | 15.8 | 3 |
| Yellow Warbler, Dendroica petechia | 38 | 15.8 | 3 |
| Black-crowned Night-Heron, Nycticorax nycticorax | 64 | 15.6 | 3 |
| Cooper’s Hawk, Accipiter cooperii | 402 | 15.4 | 3 |
| Fox Sparrow, Passerella iliaca | 98 | 15.3 | 3 |
| Northern Mockingbird, Mimus polyglottos | 412 | 14.3 | 2 |
| Wilson’s Warbler, Wilsonia pusilla | 29 | 13.8 | 2 |
| Barn Owl, Tyto alba | 410 | 13.4 | 2 |
| Red-shouldered Hawk, Buteo lineatus | 209 | 13.4 | 2 |
| Cliff Swallow, Petrochelidon pyrrhonota | 38 | 13.2 | 2 |
| Bullock’s Oriole, Icterus bullockii | 31 | 12.9 | 2 |
| Barn Swallow, Hirundo rustica | 39 | 12.8 | 2 |
| California Towhee, Pipilo crissalis | 206 | 12.6 | 2 |
| Great Horned Owl, Bubo virginianus | 152 | 12.5 | 2 |
| Spotted Towhee, Pipilo maculatus | 72 | 12.5 | 2 |
| Common Raven, Corvus corax | 623 | 12.4 | 2 |
| House Sparrow, Passer domesticus | 1219 | 12.3 | 2 |
| Black-headed Grosbeak, Pheucticus melanocephalus | 151 | 11.3 | 2 |
| Orange-crowned Warbler, Vermivora celata | 36 | 11.1 | 2 |
| Pine Siskin, Carduelis pinus | 118 | 11.0 | 2 |
| Purple Finch, Carpodacus purpureus | 37 | 10.8 | 2 |
| Mallard, Anas platyrhynchos | 105 | 10.5 | 2 |
| Brewer’s Blackbird, Euphagus cyanocephalus | 423 | 9.9 | 1 |
| Black Phoebe, Sayornis nigricans | 89 | 9.0 | 1 |
| Band-tailed Pigeon, Patagioenas fasciata | 57 | 8.8 | 1 |
| European Starling, Sturnus vulgaris | 576 | 8.3 | 1 |
| Anna’s Hummingbird, Calypte anna | 98 | 8.2 | 1 |
| California Quail, Callipepla californica | 243 | 7.8 | 1 |
| Song Sparrow, Melospiza melodia | 77 | 7.8 | 1 |
| Brown-headed Cowbird, Molothrus ater | 40 | 7.5 | 1 |
| Wild Turkey, Meleagris gallopavo | 27 | 7.4 | 1 |
| Swainson’s Thrush, Catharus ustulatus | 125 | 7.2 | 1 |
| Mourning Dove, Zenaida macroura | 732 | 7.0 | 1 |
| Northern Flicker, Colaptes auratus | 134 | 6.7 | 1 |
| Golden-crowned Sparrow, Zonotrichia atricapilla | 275 | 6.5 | 1 |
| American Goldfinch, Carduelis tristis | 123 | 6.5 | 1 |
| Turkey Vulture, Cathartes aura | 32 | 6.3 | 1 |
| Red-winged Blackbird, Agelaius phoeniceus | 81 | 6.2 | 1 |
| Western Kingbird, Tyrannus verticalis | 37 | 5.4 | 1 |
| Rock Pigeon, Columba livia | 323 | 5.0 | 1 |
| Yellow-rumped Warbler, Dendroica coronata | 163 | 4.9 | 1 |
| American Coot, Fulica americana | 94 | 4.3 | 1 |
| Hermit Thrush, Catharus guttatus | 222 | 3.6 | 1 |
| Dark-eyed Junco, Junco hyemalis | 143 | 3.5 | 1 |
| Canada Goose, Branta canadensis | 29 | 3.4 | 1 |
| White-crowned Sparrow, Zonotrichia leucophrys | 239 | 3.3 | 1 |
| Nuttall’s Woodpecker, Picoides nuttallii | 36 | 2.8 | 1 |
| Cedar Waxwing, Bombycilla cedrorum | 266 | 1.5 | 1 |
TABLE 3.
Summary of experimental infection data, relative risk, and host competence estimated by the formula of Komar et al. (2003).
| Species | Family | Number infected | Percent mortality | Peak viremia [log10 PFU mL−1] | Risk score | Host competence |
|---|---|---|---|---|---|---|
| Orange-crowned Warbler, Vermivora celata | Parulidae | 6 | 100 | 8.0 | 4 | 3.6 |
| American Crow, Corvus brachyrhynchos* | Corvidae | 8 | 100 | 10.2 | 4 | 1.6 |
| Western Scrub-Jay, Aphelocoma californica | Corvidae | 12 | 83 | 9.2 | 4 | 3.6 |
| Black-crowned Night-Heron, Nycticorax nycticorax | Ardeidae | 3 | 67 | 6.4 | 4 | 1.1 |
| House Finch, Carpodacus mexicanus | Fringillidae | 36 | 67 | 7.3 | 4 | 1.8 |
| White-crowned Sparrow, Zonotrichia leucophrys | Emberizidae | 7 | 29 | 7.8 | 3 | 1.7 |
| Cattle Egret, Bubulcus ibis | Ardeidae | 4 | 25 | 4.2 | 3 | 0.0 |
| House Sparrow, Passer domesticus | Passeridae | 6 | 17 | 6.0 | 2 | 1.6 |
| Brewer’s Blackbird, Euphagus cyanocephalus | Icteridae | 7 | 13 | 7.4 | 2 | 2.1 |
| Brown-headed Cowbird, Molothrus ater | Icteridae | 9 | 0 | 4.2 | 1 | 0.0 |
| California Quail, Callipepla californica | Odontophoridae | 6 | 0 | 2.2 | 1 | 0.0 |
| Chicken, Gallus gallus | Phasianidae | 5 | 0 | 2.3 | 1 | 0.0 |
| Common Ground-Dove, Columbina passerina | Columbidae | 6 | 0 | 5.3 | 1 | 0.3 |
| Mourning Dove, Zenaida macroura | Columbidae | 20 | 0 | 4.8 | 1 | 0.0 |
| Red-winged Blackbird, Agelaius phoeniceus | Icteridae | 7 | 0 | 6.0 | 1 | 0.9 |
| Song Sparrow, Melospiza melodia | Emberizidae | 8 | 0 | 8.5 | 1 | 1.2 |
| Yellow Warbler, Dendroica petechia | Parulidae | 4 | 0 | 6.6 | 1 | 1.0 |
| Tricolored Blackbird, Agelaius tricolor | Icteridae | 5 | 0 | 7.0 | 1 | 1.2 |
| Northern Mockingbird, Mimus polyglottos** | Mimidae | 4 | 0 | 6.5 | 1 | 0.6 |
| American Robin, Turdus migratorius* | Turdidae | 2 | 0 | 8.9 | 1 | 1.1 |
| American Kestrel, Falco sparverius* | Falconidae | 2 | 0 | 8.4 | 1 | 0.9 |
| Mallard, Anas platyrhynchos* | Anatidae | 2 | 0 | 6.7 | 1 | 0.5 |
| American Coot, Fulica americana* | Podicipedidae | 1 | 0 | 4.6 | 1 | 0.0 |
| Rock Pigeon, Columba livia* | Columbidae | 6 | 0 | 4.3 | 1 | 0.0 |
| Great Horned Owl, Bubo virginianus* | Strigidae | 1 | 0 | 7.6 | 1 | 0.9 |
| Northern Flicker, Colaptes auratus* | Picidae | 1 | 0 | 5.4 | 1 | 0.1 |
| European Starling, Sturnus vulgarius* | Sturnidae | 6 | 0 | 6.1 | 1 | 0.2 |
Data from Komar et al. (2003);
data from Komar et al. (2005); data from species unmarked with an asterisk are birds from California that we infected experimentally.
Peak viremias are expressed as mean maximum viremia.
FIGURE 2.

Seroprevalence by species (percentage testing flavivirus positive by enzyme immunoassay) plotted as a function of mean body weight in grams. Weight data from http://www.birds.cornell.edu/AllAboutBirds/BirdGuide, accessed August 2008.
We considered whether species that consistently tested negative occur in areas with WNV activity during the summer transmission season. Migratory White-crowned Sparrows (Zonotrichia leucophrys) that overwinter throughout the agricultural areas of California, for example, were rarely positive for antibodies against WNV (<1% of 4,225). We attributed this low seroprevalence to limited WNV exposure during winter (November–February) when most Culex mosquitoes remain in diapause (Reisen and Reeves 1990) and cold temperatures preclude virus transmission (Reisen et al. 2006c). During the warm months when WNV was transmitted in these areas, this species migrates north to areas such as the Pacific Northwest, Alaska, and British Columbia (Hardy et al. 1965) where little transmission of WNV has been recorded (http://diseasemaps.usgs.gov/; http://www.hc-sc.gc.ca/dc-ma/wnv-vno/index_e.html). Other species with low WNV seroprevalence were the Yellow (Dendroica petechia; 0.2% of 436 tested) and Orange-crowned (Vermivora celata) Warblers (0 of 220) which occur in California during the WNV transmission season but largely inhabit areas of low virus activity such as the Sierra Nevada and Pacific Northwest (Sogge et al. 1994, Lowther et al. 1999).
High WNV infection rates in corvids, Loggerhead Shrikes (Lanius ludovicianus), and raptors may be attributed not only to mosquito-to-bird transmission but also to oral infection due to predation on nestlings and/or birds incapacitated by acute WNV infection (Komar et al. 2003, Nemeth et al. 2006), as well as possible fecal–oral transmission at communal roosts (Dawson et al. 2007). Although the American Crow was not represented in our sample of trapped birds, we expected a high risk score for it because this species has never survived experimental infection with WNV (Komar et al. 2003, Brault et al. 2004).
Herons, family Ardeidae, constituted three of the nine most frequently infected species; however, our data on these species were spatially limited and extremely variable. Least Bitterns (Ixobrychus exilis) were collected within a dense cattail marsh along the western shore of the Salton Sea from 2003 to 2005, whereas Snowy Egrets (Egretta thula) and Black-crowned Night-Herons (Nycticorax nycticorax) were mostly fledglings that fell from a colony communally nesting in trees at a farmstead near Davis in Yolo County during the outbreak year of 2006 (Reisen et al. 2008c). WNV seroprevalence was much higher in birds at this colony breeding in a Eucalyptus grove than at a colony in snags in a pond at the Finney and Ramer lakes, Imperial Wildlife Area (Reisen et al. 2005b).
Interestingly, the seroprevalence of the Song Sparrow (Melospiza melodia) was relatively low (1.4%) even though this year-round resident has survived WNV infection in several experiments (Reisen and Fang 2007, Reisen et al. 2007a, 2007b) and commonly roosts and nests in wetlands which produce large numbers of Culex tarsalis, the primary WNV vector mosquito in the rural western USA (Turell et al. 2005).
DEAD-BIRD SURVEILLANCE
Between January 2003 and December 2007, 27 194 dead birds representing 228 species were reported by the public and tested for WNV in California. This total excluded captive species and birds not specifically identified by the public or local agencies. Overall, 9040 birds (33.2%) of 130 species (57% of those tested) tested positive for WNV. Because of the program’s inclusive protocol of testing all species submitted, the dead-bird data provided the greatest species diversity of the four data sets considered in our analysis and included species not readily sampled by other methods. Species of which at least 25 individuals were tested and found WNV-positive are summarized in Table 2. This list does not include all Californian bird species that succumb to WNV infection (Table 3) and includes species that may have died from other causes while infected with WNV. For example, all Mourning Doves (Zenaida macroura) experimentally infected with WNV have survived (Table 3), but 7% of those tested in the Dead Bird Program had kidneys positive for WNV RNA at necropsy. It is unknown if these individuals were especially susceptible to WNV (e.g., immunocompromised, old or co-infected), were killed by other means before clearing their acute WNV infection, or had developed chronic infections (Reisen et al. 2006b).
Prevalence of infection among necropsied specimens varied widely. For example, only 4 of 266 (1.5%) Cedar Waxwings (Bombycilla cedrorum) were found to be WNV-positive, indicating that WNV probably is not a common cause of death for this species. In contrast, 74% of 1183 Yellow-billed Magpies (Pica nuttalli) tested positive, indicating that WNV was a frequent cause of death. The species with the highest risk scores were four species in the family Corvidae, the Oak Titmouse (Baeolophus inornatus), American Kestrel (Falco sparverius), and Western Bluebird (Sialia mexicana). The Common Raven (Corvus corax), a corvid, did not have a high WNV positivity rate, perhaps because its range did not often overlap areas with high WNV activity.
EXPERIMENTAL INFECTIONS
Data from experimental infections of 27 species in 18 families and 9 orders are summarized in Table 3. Variation in the response to WNV infection was seen within both species and families. For example, American Crows had a high mean maximum viremia (10.2 log10 PFU mL−1) and 100% mortality, whereas Western Scrub-Jays had a slightly lower mean maximum viremia (9.2 log10 PFU mL−1) and 83% mortality. Frequent survival following natural infection was indicated by almost 30% of the field-collected Western Scrub-Jays being positive for WNV antibodies (Table 1). Two species of warblers in the family Parulidae were even more variable: Orange-crowned Warblers had 100% mortality and a high mean maximum viremia (8.0 log10 PFU mL−1), whereas Yellow Warblers had 100% survival and a lower maximum viremia (6.6 log10 PFU mL−1). Similar contrasting relationships were found within the Icteridae, where Brown-headed Cowbirds (Molothrus ater) were refractory to infection, but Brewer’s Blackbirds (Euphagus cyanocephalus), Tricolored Blackbirds (Agelaius tricolor), and Red-winged Blackbirds (A. phoeniceus) were competent hosts. In addition, when sufficient numbers were tested, considerable intraspecific variation was detected; e.g., among 36 House Finches (Carpodacus mexicanus) infected concurrently with WNV, 24 (67%) succumbed to infection and peak viremias ranged from 4.8 to 8.1 log10 PFU mL−1. Infections seemed to reach a crisis point at about day 5 post infection, after which either the viremia subsided and the bird survived, or high viremia persisted and the bird eventually succumbed. Collectively, these data indicate that extrapolations from one species to a related species may provide misleading results.
We included a host-competence index (Komar et al. 2003) to place experimental results into an epidemiological context (Table 3). This index comprises avian susceptibility, mean daily infectiousness to mosquitoes based on viremia, and the duration of infectiousness. We considered viremias >5 log10 PFU mL−1 to be progressively more infectious to Culex mosquitoes as a linear function of viremia. Because of the inclusion of a term for viremia duration (see Methods), Orange-crowned Warblers had a higher host-competence index than American Crows, because they survived longer before succumbing to infection. Values in Table 3 agree closely with Komar et al. (2003) but are greater than calculated by Kilpatrick et al. (2007) from the same data, although the ranking of species remained similar. Although useful epidemiologically, host competence must be considered in association with prevalence of infection related to the mosquito’s host selection to consider reservoir capacity.
Mortality rates by species ranged from 0 to 100%. Mortality and peak viremia (r = 0.686, P < 0.01, n = 17; Fig. 3A) and mortality and host competence (r = 0.793, P < 0.01, n = 17; Fig. 3B) were correlated significantly; peak viremia and host competence also were correlated significantly (r = 0.715, p < 0.01, n = 17). Host competence depended not only on peak viremia but also on the duration of elevated viremia, and therefore species such as the Western Scrub-Jay had a higher estimated host competence than the American Crow. In species such as the House Finch with intermediate host competence the viremia response frequently varies, with some individuals having elongated and elevated viremias and succumbing, others reaching a crisis point during infection and then recovering rapidly. Other species, such as the Song Sparrow, frequently had elevated viremias but did not succumb to infection. In general, the ability of the invading WNV genotype to invade temperate climates seems to be closely related to its ability to induce the elevated avian viremias required for the effective infection of moderately competent vectors of the genus Culex (Brault et al. 2007).
FIGURE 3.

Percent mortality plotted as a function of (A) peak viremia and (B) host competence, estimated from experimental infection data.
TREND ANALYSIS OF BBS DATA
Within four regions of California, we analyzed trends in the abundance of 26 bird species, of which 6 declined significantly within either the southern or northern WNV region (Table 4). We considered declines significant if the observed mean number of birds per BBS route dropped below the 95% PI for two consecutive years, indicating a significant (<0.25% probability) departure from the trend extrapolated from the 1980–2003 data. Although we retained the MEI within 15 of the 26 species models, there was no discernable relationship between whether the term was retained in the models and whether the bird feeds on seeds (χ2 = 1.17, P = 0.28).
Four of five corvids analyzed declined significantly in at least one region of California (Fig. 4). The Yellow-billed Magpie was especially affected by WNV in the northern region, and in 2006, following intense WNV transmission during 2005 (Hom et al. 2006), reached a 27-year population low that continued through 2007. Around Sacramento, several long-standing communal roosts of the Yellow-billed Magpie became depopulated after the arrival of WNV (Crosbie et al. 2008). In the northern WNV region declines in the American Crow and Western Scrub-Jay also were documented, but these were not as marked as that of the Yellow-billed Magpie. In contrast, the abundance of the Common Raven increased significantly in both the southern and northern WNV regions, perhaps as a result of waning competition from other corvids and its more solitary habits.
FIGURE 4.

Breeding Bird Survey counts of five corvids in California, allocated by region, before (1980–2003) and after (2004–2007) the arrival of West Nile virus. A Poisson regression model based on results before the arrival of WNV was used to develop the 95% prediction intervals (shaded) for abundance expected after the arrival of WNV. AMCR, American Crow; YBMA, Yellow-billed Magpie; WESJ, Western Scrub-Jay; STJA, Steller’s Jay, CORA, Common Raven.
Trends in species with intermediate mortality during experimental infection varied. The House Finch and House Sparrow (Passer domesticus) are key hosts for maintaining and amplifying WNV in California. They were frequently positive in seroprevalence surveys (Wilson et al. 2006) but often succumbed following experimental infections (Table 3). Populations both species declined significantly in the northern but not the southern WNV area (Table 4, Fig. 5). Interestingly, House Sparrow populations rebounded rapidly in the northern WNV area during 2007, perhaps because of continued declines in House Finch populations that compete for the same peridomestic resources (Cooper et al. 2007) and decreases in Western Scrub-Jays that frequently feed on nestlings. In contrast, Mourning Doves and California Quail (Callipepla californica) usually do not succumb from infection (Table 3), and accordingly these species failed to show significant population declines after the arrival of WNV (Table 4, Fig. 5). No trend was discernable for the Red-tailed Hawk (Buteo jamaicensis).
FIGURE 5.

Breeding Bird Survey counts of five species in California, allocated by region, before (1980–2003) and after (2004–2007) the arrival of West Nile virus. A Poisson regression model based on results before the arrival of WNV was used to develop the 95% prediction intervals (shaded) for abundance expected after the arrival of WNV. HOFI, House Finch; HOSP, House Sparrow; MODO, Mourning Dove; CAQU, California Quail; RTHA, Red-tailed Hawk.
Not all significant declines were attributable to WNV. The Song Sparrow, for example, showed a decline every year from 2004 to 2007 in the southern WNV region (Table 4), which was unexpected because 100% of birds survived experimental infection (Table 3). Inspection of individual BBS routes revealed that the southern WNV route with the largest Song Sparrow population recorded a steady decline that began in 1990 and then stabilized at nearly one tenth the peak abundance during 2002, a pattern suggesting habitat change more than WNV activity. In addition, House Finches declined significantly in the Mountains and Mojave region starting in 2002, before the arrival of WNV. Declines here and elsewhere in California may be related, in part, to a concurrent outbreak of avian pox (Poxiviridae: Avipoxvirus). We encountered pox-infected birds frequently during our seroprevalence sampling, and this virus can cause high mortality and be transmitted by both mosquitoes and direct contact (Tripathy and Reed 1997). The Canary (Serinus canaria), like the House Finch a member of the family Fringillidae, is extremely susceptible to the more severe diphtheric form of avian pox and can suffer mortality rates as high as 80–100% (Tripathy and Reed 1997).
DISCUSSION
DATA INTERPRETATION
We used four measures to assess the effect of WNV on California’s avifauna, because no single method successfully captured sufficient interpretive information. Serology of live birds provided information on the frequency of infection in species that survived WNV infection and responded immunologically. Our sampling focused on species thought to be important in maintaining and amplifying WNV and therefore included only a subset of all California species. Some target species such as the American Crow were very difficult to collect, despite considerable effort, and were not well represented in our data. Some experimentally competent species rarely were found naturally infected, even though they frequently were collected and tested. The Northern Mockingbird (Mimus polyglottos), for example, rarely was found to be WNV-antibody-positive, even though it usually survived experimental infection and frequently is infected elsewhere (Komar et al. 2005). Our results questioned whether in California this species was exposed to WNV less frequently than other urban species or succumbed to infection more frequently than the experimental data indicated (Table 2). In contrast, the Common Ground-Dove (Columbina passerina) and California Quail often were serologically positive, indicating frequent previous infection, and survived experimental infection (Reisen et al. 2005a, 2006d); however, these species most likely have little importance in WNV amplification because of low host competence. Their high seroprevalence supported the notion that in rural and urban habitats species of low host competence are fed upon frequently by infectious mosquitoes and may dampen virus amplification by diverting infectious mosquitoes from competent hosts.
The California Dead Bird Surveillance Program provided important data on species and geographical areas not well represented in our serological surveys but was biased toward large birds living in cities and suburbs (e.g., American Crows) where they could be seen dead and be reported by the public (Reisen et al. 2006a). The necropsies in which tissues were sampled for WNV testing did not ascertain pathologically whether or not the bird actually died from WNV infection and indicated only that the WNV RNA was detected by RT-PCR by testing of kidney samples (or oral swabs in the case of some American Crows).
Data on seroprevalence and dead birds provided field evidence of infection frequency but required results of experimental infection for interpretation. Our experiments were limited to species that could be captured and maintained in captivity, and often sample sizes were too low for mortality or intraspecific variation to be estimated accurately, especially for laboratory-reared nestlings such as the Black-crowned Night-Herons that have to be fed several times each day (Reisen et al. 2005b) and insectivores such as warblers that require live food. In addition, stress due to captivity and repeated handling may have contributed to mortality. Conversely, birds that were ill and relatively immobile during acute viremia but later recovered in captivity probably would have succumbed to starvation or predation in the wild.
Although field infection data from serology and the dead bird program coupled with experimental infection data were useful in anticipating the impact of WNV on bird populations, they did not always predict trends in abundance. We used Bayesian regression trend analyses to predict abundance over the 4 years after the invasion of California by WNV. We used summer BBS data rather than winter Christmas Bird Counts (CBC, http://www.mbr-pwrc.usgs.gov/bbs/cbc.html) to measure the impact of WNV because BBS data tracks bird abundance and distribution during late spring, the beginning of the WNV transmission season. Distributions of most species change during winter, so CBCs may not measure abundance at sites where birds are available for infection during the WNV transmission season (Kilpatrick et al. 2007). To assess the effect of WNV on population trends, we visually compared trends for BBS routes within and outside of areas with high WNV activity as delimited by August temperature, counts of dead birds, and other surveillance measures. This comparison more accurately evaluated the effect of WNV on avian populations but reduced the numbers of routes within each of the Bayesian models, increasing the variance and width of the 95% PI. To account for chance departures from the calculated trend, we required two consecutive years significantly below the calculated 95% PI before considering a decline significant. The chance of this happening randomly was 1 in 400 or 0.25%. The addition of more consistently covered BBS routes within the WNV-affected areas would allow a more accurate measure of population trends within the Central Valley.
Trend analyses of the BBS data using Bayesian Poisson regression models showed that some species significantly declined in abundance. Avian populations fluctuate markedly from year to year as a result of many causes, including disease, climate variation, and changes in food availability related to ecosystem dynamics, so that WNV infection may not be the only explanation for declines. We attempted to account for climate-driven fluctuations in population size by using the MEI (LaDeau et al. 2007), a multivariate measure of the El Niño/Southern Oscillation and meteorological conditions (Wolter and Timlin 1993). Including the MEI significantly improved the model’s fit for 15 of the 26 modeled species. Even after this adjustment to account for ecosystem dynamics, however, six species still showed significant post-WNV declines.
ASSESSING THE IMPACT OF WEST NILE VIRUS
We combined risk assessed from the four data sets into an overall risk score to determine the variation by species in the effect of WNV on California birds for which sufficient data were available (Table 5). We debated whether to delineate risk from serology, dead birds, and experimental infections and then used results from our trend analysis as an outcome statistic for validation. This approach produced good agreement for highly susceptible species such as the American Crows and highly refractory species such as the Brown-headed Cowbird and California Quail, but for other species it produced variable results that were difficult to interpret (Table 5). The Western Scrub-Jay, for example, had high risk scores from serology (4), the Dead Bird Surveillance Program (4), and experimental infection (4), but a moderate score from the Bayesian Poisson regression model of BBS data (2) because it showed limited population declines in regions more affected by WNV. When risk scores from all sources were aggregated, this species had the fourth highest overall score (3.5). Therefore, we decided to include results from the trend analysis within the overall risk to account for species-specific responses at the population level.
TABLE 5.
Overall risk summarized from Tables 1–4 as the mean of available risk scores from each data set, for species represented in at least three data sets. N/A, not available.
| Species | Serology | Dead bird | Experimental infection | Population decline (BBS) | Overall score |
|---|---|---|---|---|---|
| American Crow | N/A | 4 | 4 | 4 | 4.0 |
| House Finch | 4 | 3 | 4 | 4 | 3.8 |
| Black-crowned Night-Heron | 4 | 3 | 4 | N/A | 3.7 |
| Western Scrub-Jay | 4 | 4 | 4 | 2 | 3.5 |
| Yellow-billed Magpie | 2 | 4 | N/A | 3 | 3.0 |
| Orange-crowned Warbler | 1 | 2 | 4 | 1 | 2.0 |
| House Sparrow | 2 | 2 | 2 | 2 | 2.0 |
| Brewer’s Blackbird | 3 | 1 | 2 | 2 | 2.0 |
| American Kestrel | N/A | 4 | 1 | 1 | 2.0 |
| Rock Pigeon | 4 | 1 | 1 | N/A | 2.0 |
| Northern Mockingbird | 2 | 2 | 1 | 2 | 1.8 |
| Mourning Dove | 4 | 1 | 1 | 1 | 1.8 |
| White-crowned Sparrow | 1 | 1 | 3 | N/A | 1.7 |
| Black-headed Grosbeak | 2 | 2 | N/A | 1 | 1.7 |
| Yellow Warbler | 1 | 3 | 1 | N/A | 1.7 |
| American Robin | N/A | 3 | 1 | 1 | 1.7 |
| Western Tanager | 1 | 3 | N/A | 1 | 1.7 |
| California Quail | 3 | 1 | 1 | 1 | 1.5 |
| Song Sparrow | 2 | 1 | 1 | 2 | 1.5 |
| European Starling | 1 | 1 | 1 | N/A | 1.0 |
| Brown-headed Cowbird | 1 | 1 | 1 | 1 | 1.0 |
| Red-winged Blackbird | 1 | 1 | 1 | 1 | 1.0 |
After we combined results from the four sources, it became evident that data for many species were incomplete, so we focused on 22 species for which we had sufficient data from at least three of four sources (Table 5). One species which should not be overlooked because of a lack of data, however, is the Oak Titmouse. Although experimental infections of this species have not been done and we have little serological data, this species earned a risk score of 4 from the dead-bird program and showed significant population declines in three of the four regions analyzed (Table 4). This species deserves additional study because much of its range overlaps areas of WNV transmission. A related species of the eastern USA, the Tufted Titmouse (Baeolophus bicolor), also declined after the introduction of WNV (LaDeau et al. 2007).
Several raptor species (order Falconiformes) had high WNV risk scores based on dead-bird surveillance, which may be partially explained by their large body size making them more visible and subject to public reporting. Few raptors were included in the serological data set because we captured birds in light-weight mist nets and grain-baited traps, ineffective for raptors. Experimental WNV infections in raptors (Nemeth 2006) revealed that at least some species develop high viremias but none of those exhibited clinical symptoms or died. In contrast, natural infections have shown that some hawks, as well as owls (Wunschmann et al. 2004), succumb to WNV infection. Our analysis of BBS data found little if any population-level effect of WNV on representative raptors, i.e., the American Kestrel, the Red-shouldered Hawk (Buteo lineatus), and Red-tailed Hawk (Table 4, Fig. 5). This result is consistent with the relatively high seroprevalence reported previously that indicated many overwintering raptors survived infection (Stout et al. 2005, Hull et al. 2006, Medica et al. 2007). It is possible that many of the WNV-positive raptors reported by the dead-bird surveillance program had been weakened by WNV infection, impeding their hunting ability and making them more susceptible to the effects of the virus.
In agreement with previous studies in California (Koenig et al. 2007) and throughout the United States (LaDeau et al. 2007), three of the five species with the highest risk from WNV are in the family Corvidae (Table 5), as anticipated because of the family’s high susceptibility to WNV infection (Komar et al. 2003, Reisen et al. 2005a). Analysis of trends in the BBS indicated that the Yellow-billed Magpie is the most affected of those three corvids (Fig. 4). Its distribution is limited to the northern area of high WNV risk, and its communal roosting facilitates both mosquito-borne and direct bird-to-bird transmission of WNV. Two other species with high overall risk scores were the House Finch and Orange-crowned Warbler. The House Finch’s risk scores were elevated in three of four datasets. This urban species may not only be at risk but also plays an important role in the maintenance and amplification of WNV in California (Wilson et al. 2006, Carroll et al. 2007). In addition, it is fed upon frequently by Culex tarsalis (Tempelis et al. 1976), and it is the primary host for a variety of other pathogens, including western equine and St. Louis encephalitis viruses (Reisen et al. 2000, Reisen et al. 2003), other arboviruses (Reeves et al. 1990), and several species of Plasmodium (Rosen and Reeves 1954, Herman et al. 1954). The House Finch’s host competence is relatively high, and, judging from both serologic and dead-bird datasets, House Finches are frequently infected naturally with WNV. In contrast, Orange-crowned Warblers have a low overall risk score based on low seroprevalence, 100% mortality in experimental infections, and a moderate score from the dead-bird data. We attribute the low seroprevalence (n = 220) to the species’ high susceptibility to WNV infection and a summer distribution concentrated away from regions where WNV is prevalent. Therefore, this species was at risk for infection largely during migration and, to a lesser degree, winter. In addition, we have found little evidence of natural infection among other small-bodied birds (e.g., warblers and wrens), and it may be that they are below the size range attractive to most Culex mosquitoes.
The actual risk from WNV to populations of wild birds appears to vary with the local intensity of WNV transmission, the biting rate by infectious mosquitoes, and the species’ response to infection. Since the initial invasion into California in 2003, WNV has demonstrated a fairly consistent pattern of quiet introduction, epidemic amplification the following year, and then subsidence, as described elsewhere (Hayes et al. 2005). In some areas such as Kern County (Carroll et al. 2007), however, WNV activity has not subsided and pressure on susceptible avian populations has been sustained. In contrast, in other areas such as Los Angeles and Coachella Valley, the virus has subsided somewhat (O’Connor et al. 2007, Reisen et al. 2008b), allowing avian populations to recover numerically and lose herd immunity. This regional variation in population pressure from WNV may indicate that species with limited ranges and under heavy WNV infection pressure are at greater risk than species with larger ranges that are only partially or intermittently under pressure. An example is the difference between the Yellow-billed Magpie and American Crow in our analysis of abundance trends in BBS data. The American Crow’s distribution is extensive, covering most of California except the southeastern deserts (Verbeek and Caffrey 2002), whereas the Yellow-billed Magpie has a range restricted primarily to the Central Valley north of Fresno and portions of the central Coast Ranges (Reynolds 1995). The American Crow, while showing limited declines in both the southern and northern WNV regions, maintained relatively constant abundance in the low-temperature coastal region. Conversely, the Yellow-billed Magpie declined across its range, including both the northern WNV and low-temperature coastal regions. These trends of decline within the BBS data have been corroborated by counts at roosts in Sacramento and Yolo counties (Crosbie et al. 2008).
Avian risk may be closely linked to Culex mosquitoes’ temporal and spatial distributions and host selection, as well as temperature constraints on virus replication within the mosquito. Mosquito blood-meal acquisition is the culmination of intrinsic genetic factors that regulate host choice and extrinsic ecological factors related to host availability when mosquitoes are foraging. Questing mosquitoes detect their hosts by means of a variety of long- and short-range chemical cues, including semiochemicals such as carbon dioxide (Reeves 1953), skin emanations (Dekker et al. 2005), and in the case of birds, odors from the uropygial gland (Allan et al. 2006). Although these intrinsic factors strongly influence host preference, the patterns of host selection that emerge in nature are strongly influenced by hosts’ availability due to landscape or ecological factors (Lothrop and Reisen 2001) and by hosts’ avoidance behavior (Edman et al. 1972, Edman and Spielman 1988). Questing female Culex mosquitoes appear to hunt at night at specific landscape features, and birds roosting or nesting at these sites are infected at significantly higher rates than those roosting or nesting elsewhere (Reisen et al. 1997, Lothrop and Reisen 2001). Therefore, the choice of evening roosting or nesting sites can affect arboviral infection rates, presumably by determining the frequency of vector–host contact (Reisen et al. 2005b, Ward et al. 2006, Armijos et al. 2007). Once a vector locates a host, the host’s defensive behaviors can alter the outcome of the encounter. Avian species vary markedly in their response to mosquito biting pressure, and this behavior can affect the mosquito’s feeding success (Edman and Kale 1971, Edman et al. 1972, 1974, Edman and Spielman 1988). Disease, such as occurs during acute WNV infection in corvids and some raptors, may limit these defensive behaviors, alter roost-site selection, and facilitate mosquitoes’ blood-feeding success (Scott et al. 1988). Host-selection patterns also change temporally (Tempelis et al. 1965, Edman and Taylor 1968) as a result of increases in mosquito biting pressure (Edman et al. 1972, Nelson et al. 1976) and host availability (Reisen and Reeves 1990, Kilpatrick et al. 2006). In California, these shifts allow Culex mosquitoes to function as maintenance and amplifying vectors during the spring and early summer when they feed almost entirely on birds and as bridge vectors in summer and fall when they feed more frequently on mammals. Host selection also relates to the rate of production of semiochemicals such as carbon dioxide as well as the juxtaposition of roosting and nesting sites with the flight and hunting paths taken by mosquitoes during their appetitive flights. A communal roost produces more carbon dioxide and thus may be more attractive to ornithophilic mosquitoes than a birds roosting in solitude; similarly, a large bird roosting in solitude produces more semiochemicals than a small bird. The House Finch, often positive for WNV antibodies, roosts and nests in loose aggregations within dense vegetation or under eaves of houses (Bergtold 1913, Hill 1993). In contrast, the Northern Mockingbird, which we found to have a seroprevalence lower than in the House Finch, aggressively defends its territory and therefore has a more uniform and sparse distribution (Michener and Michener 1935, Derrickson and Breitwisc 1992). This behavior does not protect mockingbirds from mosquito biting, but rather their evenly spaced distribution may make them more difficult for a mosquito to locate than a group of House Finches. Differences in size also may be important, because the Western Scrub-Jay, like the Northern Mockingbird, is also aggressively territorial during the breeding season (Curry et al. 2002) and therefore also has an evenly spaced distribution (Reisen et al. 2006a), but Western Scrub-Jays are often found either dead or with antibodies against WNV. This difference may be attributed to the Western Scrub-Jay’s greater body mass, 78–101 g, (Curry et al. 2002), nearly double that of the Northern Mockingbird, 46–52 g (Derrickson and Breitwisch 1992). Although a bird’s roosting behavior and body mass should be considered in studies of mosquitoes’ host selection (Kay et al. 1985), it should be done in the context of the avian community in which that bird lives. Although our study found a significant relationship between seroprevalence and body weight, only 15% of the variation was explained by this association.
In conclusion, WNV is now endemic throughout the New World and is likely to affect bird populations for years to come. Its impact will vary over time and space, with some focally distributed species, such as the Yellow-billed Magpie and perhaps the Oak Titmouse, experiencing strong population declines, whereas broadly distributed or refractory species may persist with minimal reduction or even increase. Broadly distributed susceptible species may be able to recover from WNV-induced declines during seasons with little or no transmission of the virus. We could not include all age classes in experimental-infection studies and therefore did not test whether susceptibility varies with age. If nestlings frequently succumb, then even species that appear to be unaffected by WNV as adults may undergo considerable changes in age structure and decrease in abundance following regional epizootics that sweep through susceptible populations with low or no herd immunity (Wright et al. 2007). Although various methods for tracking avian WNV infection and impact have been used, these are generally crude and difficult to relate to the complexity and dynamics of WNV transmission, making it imperative to use more than one tool to interpret the impact of WNV on avian populations.
Acknowledgments
We especially thank H. D. Lothrop (CVEC, Coachella Valley), V. M. Martinez, S. Hallam (CVEC, Kern County), and C. Nielsen (CVEC, Yolo County) for assistance in the field, collecting live and retrieving dead birds; S. Garcia, M. Dannen, K. Simmons, and the CVEC Arbovirus Laboratory staff for testing live-bird sera, dead-bird tissues, and blood samples from experimental infections; and K. McCaughey, R. Carney and Dead Bird Hotline staff (California Department of Public Health, Vectorborne Disease section, V. L. Kramer, chief); and L. Woods and staff of the California Animal Health and Food Service program for necropsies.
This research was funded, in part, by Epidemiology and Laboratory Capacity funding from the Centers for Disease Control and Protection, research grant AI55607 from the National Institute of Allergy and Infectious Diseases, National Institutes of Health, the Climate Variability and Human Health Program, Office of Global Programs, National Oceanic and Atmospheric Administration, the Coachella Valley, Kern, and Sacramento–Yolo Mosquito and Vector Control Districts, and special funds from the Mosquito Research Program allocated annually through the Division of Agriculture and Natural Resources, University of California.
Footnotes
Please direct all requests for permission to photocopy or reproduce article content through the University of California Press’s Rights and Permissions website, http://www.ucpressjournals.com/reprintInfo.asp.
LITERATURE CITED
- Allan SA, Bernier UR, Kline DL. Laboratory evaluation of avian odors for mosquito (Diptera: Culicidae) attraction. Journal of Medical Entomology. 2006;43:225–231. doi: 10.1603/0022-2585(2006)043[0225:leoaof]2.0.co;2. [DOI] [PubMed] [Google Scholar]
- Armijos V, Wheeler SS, Fang Y, Garcia S, Wright SA, Kelley K, Reisen WK. Are ardeid colonies nesting over dry land a source of West Nile virus amplification?. Proceedings of the Mosquito and Vector Control Association of California; 2007. pp. 7–8. [Google Scholar]
- Bell JA, Brewer CM, Mickelson NJ, Garman GW, Vaughan JA. West Nile Virus Epizootiology, Central Red River Valley, North Dakota and Minnesota, 2002–2005. Emerging Infectious Diseases. 2006;12:1245–1247. doi: 10.3201/eid1208.060129. [DOI] [PMC free article] [PubMed] [Google Scholar]
- Bergtold WH. A study of the House Finch (Carpodacus mexicanus frontalis) Auk. 1913;30:40–73. [Google Scholar]
- Brault AC, Huang CY, Langevin SA, Kinney RM, Bowen RA, Ramey WN, Panella NA, Holmes EC, Powers AM, Miller BR. A single positively selected West Nile viral mutation confers increased virogenesis in American Crows. Nature Genetics. 2007;39:1162–1166. doi: 10.1038/ng2097. [DOI] [PMC free article] [PubMed] [Google Scholar]
- Brault AC, Langevin SA, Bowen R, Panella NA, Biggerstaff BJ, Miller BR, Komar N. Differential virulence of West Nile strains for American Crows. Emerging Infectious Diseases. 2004;10:2161–2168. doi: 10.3201/eid1012.040486. [DOI] [PMC free article] [PubMed] [Google Scholar]
- Brooks SP, Gelman A. Alternative methods for monitoring convergence of iterative simulations. Journal of Computational and Graphical Statistics. 1998;7:434–455. [Google Scholar]
- Carney R, Padgett K, Cahoon-Young B, Woods L, Read D, Reisen WK, Kramer VL, Husted S. The California West Nile virus dead bird surveillance program—Challenges and solutions during 2004. Proceedings of the California Mosquito and Vector Control Association. 2005;73:105–106. [Google Scholar]
- Carroll BD, Takahashi RM, Reisen WK. West Nile virus activity in Kern County during 2006. Proceedings of the Mosquito and Vector Control Association of California. 2007;75:17–22. [PMC free article] [PubMed] [Google Scholar]
- Chiles RE, Reisen WK. A new enzyme immunoassay to detect antibodies to arboviruses in the blood of wild birds. Journal of Vector Ecology. 1998;23:123–135. [PubMed] [Google Scholar]
- Colton L, Nasci RS. Quantification of West Nile virus in the saliva of Culex species collected from the southern United States. Journal of the American Mosquito Control Association. 2006;22:57–63. doi: 10.2987/8756-971X(2006)22[57:QOWNVI]2.0.CO;2. [DOI] [PubMed] [Google Scholar]
- Cooper CB, Hochachka WM, Dhondt AA. Contrasting natural experiments confirm competition between House Finches and House Sparrows. Ecology. 2007;88:864–870. doi: 10.1890/06-0855. [DOI] [PubMed] [Google Scholar]
- Crosbie SP, Koenig WD, Reisen WK, Kramer VL, Marcus L, Carney R, Pandolfino E, Crosbie LR, Ernest HB. Early impact of West Nile virus on the Yellow-billed Magpie (Pica nuttalli) Auk. 2008;125:542–550. [Google Scholar]
- Curry RL, Peterson AT, ALangen T. Western Scrub-Jay (Aphelocoma californica) In: Poole A, Gill F, editors. The birds of North America, No. 712. The Birds of North America, Inc; Philadelphia, PA: 2002. [Google Scholar]
- Dawson JR, Stone WB, Ebel GD, Young DS, Galinski DS, Pensabene JP, Franke MA, Eidson M, Kramer LD. Crow deaths caused by West Nile virus during winter. Emerging Infectious Diseases. 2007;13:1912–1914. doi: 10.3201/eid1312.070413. [DOI] [PMC free article] [PubMed] [Google Scholar]
- Dekker T, Geier M, Carde RT. Carbon dioxide instantly sensitizes female yellow fever mosquitoes to human skin odours. Journal of Experimental Biology. 2005;208:2963–2972. doi: 10.1242/jeb.01736. [DOI] [PubMed] [Google Scholar]
- Derrickson KC, Breitwisch R. Northern Mockingbird (Mimus polyglottos) In: Poole A, Stettenheim P, Gill F, editors. The birds of North America. Academy of Natural Sciences; Philadelphia, PA: 1992. [Google Scholar]
- Edman JD, Kale HW., II Host behavior: Its influence on the feeding success of mosquitoes. Annals of the Entomological Society of America. 1971;64:513–516. [Google Scholar]
- Edman JD, Spielman A. Blood-feeding by vectors: Physiology, ecology, behavior and vertebrate defense. In: Monath TP, editor. The arboviruses: Epidemiology and ecology. CRC Press; Boca Raton, FL: 1988. pp. 153–190. [Google Scholar]
- Edman JD, Taylor DJ. Culex nigripalpus: Seasonal shift in the bird: mammal feeding rates in a mosquito vector of human encephalitis. Science. 1968;161:67–68. doi: 10.1126/science.161.3836.67. [DOI] [PubMed] [Google Scholar]
- Edman JD, Webber LA, Kale HW., II Effect of mosquito density on the interrelationship of host behavior and mosquito feeding success. American Journal of Tropical Medicine and Hygiene. 1972;21:487–491. doi: 10.4269/ajtmh.1972.21.487. [DOI] [PubMed] [Google Scholar]
- Edman JD, Webber LA, Schmid AA. Effect of host defenses on the feeding pattern of Culex nigrpalpus when offered a choice of blood sources. Journal of Parasitology. 1974;60:874–883. [PubMed] [Google Scholar]
- Eidson M. “Neon needles” in a haystack: The advantages of passive surveillance for West Nile virus. Annals of the New York Academy of Sciences. 2001;951:38–53. [PubMed] [Google Scholar]
- Eidson M. Dead crow density and West Nile virus monitoring, New York. Emerging Infectious Diseases. 2005;11:1370–1375. doi: 10.3201/eid1109.040712. [DOI] [PMC free article] [PubMed] [Google Scholar]
- Eidson M, Komar N, Sorhage F, Nelson R, Talbot T, Mostashari F, Mclean R. Crow deaths as a sentinel surveillance system for West Nile virus in the northeastern United States, 1999. Emerging Infectious Diseases. 2001a;7:615–620. doi: 10.3201/eid0704.010402. [DOI] [PMC free article] [PubMed] [Google Scholar]
- Eidson M, Kramer L, Stone W, Hagiwara Y, Schmit K. Dead bird surveillance as an early warning system for West Nile virus. Emerging Infectious Diseases. 2001b;7:631–635. doi: 10.3201/eid0704.010405. [DOI] [PMC free article] [PubMed] [Google Scholar]
- Fang Y, Reisen WK. Previous infection with West Nile or St. Louis encephalitis viruses provides cross protection during reinfection in House Finches. American Journal of Tropical Medicine and Hygiene. 2006;75:480–485. [PubMed] [Google Scholar]
- Feiszli T, Park B, Kramer VL, Kjemtrup A, Eldridge BF, Fang Y, Reisen WK, Baylis E, Jean C, Glover J, Carney R, Padgett K, Erickson C, Husted S. Surveillance for mosquito-borne encephalitis virus activity in California, 2006. Proceedings of the Mosquito and Vector Control Association of California. 2007;75:48–59. [Google Scholar]
- Goddard LB, Roth AE, Reisen WK, Scott TW. Vector competence of California mosquitoes for West Nile virus. Emerging Infectious Diseases. 2002;8:1385–1391. doi: 10.3201/eid0812.020536. [DOI] [PMC free article] [PubMed] [Google Scholar]
- Hardy JL, Roberts DR, Banks RC. The composition of a wintering population of White-crowned Sparrows in Kern County, California. Condor. 1965;67:90–91. [Google Scholar]
- Hayes CG. West Nile virus: Uganda, 1937, to New York City, 1999. Annals of the New York Academy of Sciences. 2001;951:25–37. doi: 10.1111/j.1749-6632.2001.tb02682.x. [DOI] [PubMed] [Google Scholar]
- Hayes EB, Komar N, Nasci RS, Montgomery SP, O’Leary DR, Campbell GL. Epidemiology and transmission dynamics of West Nile virus disease. Emerging Infectious Diseases. 2005;11:1167–1173. doi: 10.3201/eid1108.050289a. [DOI] [PMC free article] [PubMed] [Google Scholar]
- Herman CM, Reeves WC, Mcclure HE, French EM, Hammon WM. Studies on avian malaria in vectors and hosts of encephalitis in Kern County, California. I. Infections in avian hosts. American Journal of Tropical Medicine and Hygiene. 1954;3:676–695. doi: 10.4269/ajtmh.1954.3.676. [DOI] [PubMed] [Google Scholar]
- Hill GE. House Finch (Carpodacus mexicanus) In: Poole A, Gill F, editors. The Birds of North America, No. 46. Academy of Natural Sciences; Philadelphia: 1993. [Google Scholar]
- Hom A, Bonilla D, Kjemtrup A, Kramer VL, Cahoon-Young B, Barker CM, Marcus L, Glaser C, Cossen C, Baylis E, Jean C, Eldridge BF, Carney R, Padgett K, Sun B, Reisen WK, Woods L, Glover J, Erickson C, Barclay C, Husted S. Surveillance for mosquito-borne encephalitis virus activity and human disease, including West Nile virus, in California, 2005. Proceedings of the Mosquito and Vector Control Association of California. 2006;74:43–55. [Google Scholar]
- Hom A, Marcus L, Kramer VL, Cahoon B, Glaser C, Cossen C, Baylis E, Jean C, Tu E, Eldridge BF, Carney R, Padgett K, Sun B, Reisen WK, Woods L, Husted S. Surveillance for mosquito-borne encephalitis virus activity and human disease, including West Nile virus, in California, 2004. Proceedings of the Mosquito and Vector Control Association of California. 2005;73:66–77. [Google Scholar]
- Hull J, Hull A, Reisen WK, Fang Y, Ernst H. Variation in West Nile virus antibody prevalence in free-ranging California raptors. Condor. 2006;108:435–439. [Google Scholar]
- Julian KG, Eidson M, Kipp AM, Weiss E, Petersen LR, Miller JR, Hinten SR, Marfin AA. Early season crow mortality as a sentinel for West Nile virus disease in humans, northeastern United States. Vector-Borne and Zoonotic Diseases. 2002;2:145–155. doi: 10.1089/15303660260613710. [DOI] [PubMed] [Google Scholar]
- Kay BH, Boreham PF, Fanning ID. Host-feeding patterns of Culex annulirostris and other mosquitoes (Diptera: Culicidae) at Charleville, southwestern Queensland, Australia. Journal of Medical Entomology. 1985;22:529–535. doi: 10.1093/jmedent/22.5.529. [DOI] [PubMed] [Google Scholar]
- Kilpatrick AM, Kramer LD, Jones MJ, Marra PP, Daszak P. West Nile virus epidemics in North America are driven by shifts in mosquito feeding behavior. PLoS Biology. 2006;4:606–610. doi: 10.1371/journal.pbio.0040082. [DOI] [PMC free article] [PubMed] [Google Scholar]
- Kilpatrick AM, Ladeau SL, Marra PP. Ecology of West Nile virus transmission and its impact on birds in the western hemisphere. Auk. 2007;124:1121–1136. [Google Scholar]
- Koenig WD, Marcus L, Scott TW, Dickinson JL. West Nile virus and California breeding bird declines. Ecohealth. 2007;4:18–24. [Google Scholar]
- Komar N. West Nile virus: Epidemiology and ecology in North America. Advnces in Virus Research. 2003;61:185–234. doi: 10.1016/s0065-3527(03)61005-5. [DOI] [PubMed] [Google Scholar]
- Komar N, Langevin S, Hinten S, Nemeth N, Edwards E, Hettler D, Davis B, Bowen R, Bunning M. Experimental infection of North American birds with the New York 1999 strain of West Nile virus. Emerging Infectious Diseases. 2003;9:311–322. doi: 10.3201/eid0903.020628. [DOI] [PMC free article] [PubMed] [Google Scholar]
- Komar N, Panella NA, Langevin SA, Brault AC, Amador M, Edwards E, Owen JC. Avian hosts for West Nile virus in St. Tammany Parish, Louisiana, 2002. American Journal of Tropical Medicine and Hygiene. 2005a;73:1031–1037. [PubMed] [Google Scholar]
- Kramer LD, Styer LM, Ebel GD. A global perspective on the epidemiology of West Nile virus. Annual Review of Entomology. 2008;53:61–81. doi: 10.1146/annurev.ento.53.103106.093258. [DOI] [PubMed] [Google Scholar]
- Kramer LD, Wolfe TM, Green EN, Chiles RE, Fallah H, Fang Y, Reisen WK. Detection of encephalitis viruses in mosquitoes (Diptera: Culicidae) and avian tissues. Journal of Medical Entomology. 2002;39:312–323. doi: 10.1603/0022-2585-39.2.312. [DOI] [PubMed] [Google Scholar]
- LaDeau SL, Kilpatrick AM, Marra PP. West Nile virus emergence and large-scale declines of North American bird populations. Nature. 2007;447:710–713. doi: 10.1038/nature05829. [DOI] [PubMed] [Google Scholar]
- Lanciotti RS, Kerst AJ, Nasci RS, Godsey MS, Mitchell CJ, Savage HM, Komar N, Panella NA, Allen BC, Volpe KE, Davis BS, Roehrig JT. Rapid detection of West Nile virus from human clinical specimens, field-collected mosquitoes, and avian samples by a TaqMan reverse transcriptase-PCR assay. Journal of Clinical Microbiology. 2000;38:4066–4071. doi: 10.1128/jcm.38.11.4066-4071.2000. [DOI] [PMC free article] [PubMed] [Google Scholar]
- Lothrop HD, Reisen WK. Landscape affects the host-seeking patterns of Culex tarsalis (Diptera: Culicidae) in the Coachella Valley of California. Journal of Medical Entomology. 2001;38:325–332. doi: 10.1603/0022-2585-38.2.325. [DOI] [PubMed] [Google Scholar]
- Lowther PE, Celada C, Klein NK. Yellow Warbler (Dendroica petechia) In: Poole A, Gill F, editors. The birds of North America, No. 454. The Birds of North America, Inc; Philadelphia, PA: 1999. [Google Scholar]
- Lunn DJ, Thomas A, Best N, Spiegelhalter D. Win-BUGS—a Bayesian modelling framework: Concepts, structure, and extensibility. Statistics and Computing. 2000;10:325–337. [Google Scholar]
- McCaughey K, Miles SQ, Woods L, Chiles RE, Hom A, Kramer VL, Jay-Russel M, Sun B, Reisen WK, Scott TW, Hui LT, Steinlein DB, Castro M, Houchin A, Husted S. The California West Nile virus dead bird surveillance program. Proceedings of the Mosquito and Vector Control Association of California. 2003;71:38–43. [Google Scholar]
- Medica DL, Clauser R, Bildstein K. Prevalence of West Nile virus antibodies in a breeding population of American Kestrels (Falco sparverius) in Pennsylvania. Journal of Wildlife Diseases. 2007;43:538–541. doi: 10.7589/0090-3558-43.3.538. [DOI] [PubMed] [Google Scholar]
- Michener H, Michener JR. Mockingbirds, their territories and individualities. Condor. 1935;37:97–140. [Google Scholar]
- Nelson RL, Tempelis CH, Reeves WC, Milby MM. Relation of mosquito density to bird:mammal feeding ratios of Culex tarsalis in stable traps. American Journal of Tropical Medicine and Hygiene. 1976;25:644–654. doi: 10.4269/ajtmh.1976.25.644. [DOI] [PubMed] [Google Scholar]
- Nemeth N, Gould D, Bowen R, Komar N. Natural and experimental West Nile virus infection in five raptor species. Journal of Wildlife Diseases. 2006;42:1–13. doi: 10.7589/0090-3558-42.1.1. [DOI] [PubMed] [Google Scholar]
- O’Connor P, Wilson JL, Spoehel J, Kluh S, Morales H, Madon MB. West Nile virus foci in Greater Los Angeles County Vector Control District, 2003–2006. Proceedings of the Mosquito and Vector Control Association of California. 2007;75:14–16. [Google Scholar]
- Padgett KA, Cahoon-Young B, Carney R, Woods L, Read D, Husted S, Kramer V. Field and laboratory evaluation of diagnostic assays for detecting West Nile virus in oropharyngeal swabs from California wild birds. Vector-Borne and Zoonotic Diseases. 2006;6:183–191. doi: 10.1089/vbz.2006.6.183. [DOI] [PubMed] [Google Scholar]
- Reeves WC. Quantitative field studies on the carbon dioxide chemotropism of mosquitoes. American Journal of Tropical Medicine and Hygiene. 1953;2:325–331. doi: 10.4269/ajtmh.1953.2.325. [DOI] [PubMed] [Google Scholar]
- Reeves WC, Asman SM, Hardy JL, Milby MM, Reisen WK. Epidemiology and control of mosquito-borne arboviruses in California, 1943–1987. California Mosquito and Vector Control Association; Sacramento, CA: 1990. [Google Scholar]
- Reisen WK, Barker CM, Carney R, Lothrop HD, Wheeler SS, Wilson JL, Madon MB, Takahashi R, Carroll B, Garcia S, Fang Y, Shafii M, Kahl N, Ashtari S, Kramer V, Glaser C, Jean C. Role of corvids in epidemiology of West Nile virus in southern California. Journal of Medical Entomology. 2006a;43:356–367. doi: 10.1603/0022-2585(2006)043[0356:rocieo]2.0.co;2. [DOI] [PubMed] [Google Scholar]
- Reisen WK, Brault AC. West Nile virus in North America: Perspectives on epidemiology and intervention. Pest Management Science. 2007;63:641–646. doi: 10.1002/ps.1325. [DOI] [PubMed] [Google Scholar]
- Reisen WK, Brault AC, Martinez VM, Fang Y, Simmons K, Garcia S, Omi-Olsen E, Lane RS. Ability of transstadially infected Ixodes pacificus (Acari: Ixodidae) to transmit West Nile virus to Song Sparrows or Western Fence Lizards. Journal of Medical Entomology. 2007a;44:320–327. doi: 10.1603/0022-2585(2007)44[320:aotiip]2.0.co;2. [DOI] [PubMed] [Google Scholar]
- Reisen WK, Carroll BD, Takahashi M, Fang Y, Garcia S, Martinez VM, Quiring R. Repeated West Nile virus epidemic transmission in Kern County, California, 2004–2007. Journal of Medical Entomology. 2008a doi: 10.1603/033.046.0118. in press. [DOI] [PMC free article] [PubMed] [Google Scholar]
- Reisen WK, Chiles RE, Martinez VM, Fang Y, Green EN. Experimental infection of California birds with western equine encephalomyelitis and St. Louis encephalitis viruses. Journal of Medical Entomology. 2003;40:968–982. doi: 10.1603/0022-2585-40.6.968. [DOI] [PubMed] [Google Scholar]
- Reisen WK, Chiles RE, Martinez VM, Fang Y, Green EN. Encephalitis virus persistence in California birds: Experimental infections in Mourning Doves (Zenaidura macroura ) Journal of Medical Entomology. 2004a;3:462–466. doi: 10.1603/0022-2585-41.3.462. [DOI] [PubMed] [Google Scholar]
- Reisen WK, Fang Y. Does feeding on infected mosquitoes (Diptera: Culicidae) enhance the role of song sparrows in the transmission of arboviruses in California? Journal of Medical Entomology. 2007;44:316–319. doi: 10.1603/0022-2585(2007)44[316:dfoimd]2.0.co;2. [DOI] [PubMed] [Google Scholar]
- Reisen WK, Fang Y, Lothrop HD, Martinez VM, Wilson J, O’Connor P, Carney R, Cahoon-Young B, Shafii M, Brault AC. Overwintering of West Nile virus in southern California. Journal of Medical Entomology. 2006b;43:344–355. doi: 10.1603/0022-2585(2006)043[0344:oownvi]2.0.co;2. [DOI] [PubMed] [Google Scholar]
- Reisen WK, Fang Y, Martinez V. Is nonviremic transmission of West Nile virus by Culex mosquitoes (Diptera: Culicidae) nonviremic? Journal of Medical Entomology. 2007b;44:299–302. doi: 10.1603/0022-2585(2007)44[299:intown]2.0.co;2. [DOI] [PubMed] [Google Scholar]
- Reisen WK, Fang Y, Martinez VM. Avian host and mosquito (Diptera: Culicidae) vector competence determine the efficiency of West Nile and St. Louis encephalitis virus transmission. Journal of Medical Entomology. 2005a;42:367–375. doi: 10.1093/jmedent/42.3.367. [DOI] [PubMed] [Google Scholar]
- Reisen WK, Fang Y, Martinez VM. Effects of temperature on the transmission of West Nile virus by Culex tarsalis (Diptera: Culicidae) Journal of Medical Entomology. 2006c;43:309–317. doi: 10.1603/0022-2585(2006)043[0309:EOTOTT]2.0.CO;2. [DOI] [PubMed] [Google Scholar]
- Reisen WK, Lothrop HD, Chiles RE, Madon MB, Cossen C, Woods L, Husted S, Kramer VL, Edman JD. West Nile virus in California. Emerging Infectious Diseases. 2004b;10:1369–1378. doi: 10.3201/eid1008.040077. [DOI] [PMC free article] [PubMed] [Google Scholar]
- Reisen WK, Lothrop HD, Meyer RP. Time of host-seeking by Culex tarsalis (Diptera: Culicidae) in California. Journal of Medical Entomology. 1997;34:430–437. doi: 10.1093/jmedent/34.4.430. [DOI] [PubMed] [Google Scholar]
- Reisen WK, Lothrop HD, Wheeler SS, Kensington M, Gutierrez A, Fang Y, Garcia S, Lothrop B. Persistent West Nile virus transmission and the displacement St. Louis encephalitis virus in southeastern California, 2003–2006. Journal of Medical Entomology. 2008b;45:494–508. doi: 10.1603/0022-2585(2008)45[494:pwnvta]2.0.co;2. [DOI] [PMC free article] [PubMed] [Google Scholar]
- Reisen WK, Lundstrom JO, Scott TW, Eldridge BF, Chiles RE, Cusack R, Martinez VM, Lothrop HD, Gutierrez D, Wright S, Boyce K, Hill BR. Patterns of avian seroprevalence to western equine encephalomyelitis and St. Louis encephalitis viruses in California, USA. Journal of Medical Entomology. 2000;37:507–527. doi: 10.1603/0022-2585-37.4.507. [DOI] [PubMed] [Google Scholar]
- Reisen WK, V, Martinez M, Fang Y, Garcia S, Ashtari S, Wheeler SS, Carroll BD. Role of California (Callipepla californica) and Gambel’s (Callipepla gambelii) quail in the ecology of mosquito-borne encephalitis viruses in California, USA. Vector-Borne and Zoonotic Diseases. 2006d;6:248–260. doi: 10.1089/vbz.2006.6.248. [DOI] [PubMed] [Google Scholar]
- Reisen WK, Reeves WC. Bionomics and ecology of Culex tarsalis and other potential mosquito vector species. In: Reeves WC, editor. Epidemiology and control of mosquito-borne arboviruses in California, 1943–1987. California Mosquito and Vector Control Association; Sacramento, CA: 1990. pp. 254–329 . [Google Scholar]
- Reisen WK, Wheeler SS, Armijos MV, Fang Y, Garcia S, Kelley K, Wright SA. Role of communally nesting ardeid birds in the epidemiology of West Nile virus revisited. Vector-Borne and Zoonotic Diseases. 2008c doi: 10.1089/vbz.2008.0104. in press. [DOI] [PMC free article] [PubMed] [Google Scholar]
- Reisen WK, Wheeler SS, Yamamoto S, Fang Y, Garcia S. Nesting ardeid colonies are not a focus of elevated West Nile virus activity in southern California. Vector-Borne and Zoonotic Diseases. 2005b;5:258–266. doi: 10.1089/vbz.2005.5.258. [DOI] [PubMed] [Google Scholar]
- Reynolds MD. Yellow-billed Magpie (Pica nuttalli) In: Poole A, editor. The birds of North America, No. 180. Academy of Natural Sciences; Philadelphia, PA: 1995. [Google Scholar]
- Rosen L, Reeves WC. Studies of avian malaria in vectors and hosts of encephalitis in Kern County, California. American Journal of Tropical Medicine and Hygiene. 1954;3:704–708. doi: 10.4269/ajtmh.1954.3.704. [DOI] [PubMed] [Google Scholar]
- Sauer JR, Hines JE, Fallon J. Version 2004.1. USGS Patuxent Wildlife Research Center; Laurel, MD: 2004. The North American Breeding Bird Survey, results and analysis 1966–2003. http://www.mbr-pwrc.usgs.gov/bbs. [Google Scholar]
- Scott TW, Edman JD, Lorenz LH, Hubbard JL. Effects of disease on vertebrates’ ability behaviorally to repel host-seeking mosquitoes. Miscellaneous Publications of the Entomological Society of America. 1988;68:9–17. [Google Scholar]
- Sogge MK, Gilbert WM, Van Riper C., III . Orange-crowned Warbler (Vermivora celata) In: Poole A, editor. The birds of North America, No. 101. Academy of Natural Sciences; Philadephia, PA: 1994. [Google Scholar]
- Spiegelhalter DJ, Best NG, Carlin BP, van der Linde A. Bayesian measures of model complexity and fit (with discussion) Journal of the Royal Statistical Society B. 2002;64:583–640. [Google Scholar]
- Stout WE, Cassini AG, Meece JK, Papp JM, Rosenfield RN, Reed KD. Serologic evidence of West Nile virus infection in three wild raptor populations. Avian Diseases. 2005;49:371–375. doi: 10.1637/7335-012805R1.1. [DOI] [PubMed] [Google Scholar]
- Tempelis CH, Reeves WC, Bellamy RE, Lofy MF. A three-year study of the feeding habits of Culex tarsalis in Kern County, California. American Journal of Tropical Medicine and Hygiene. 1965;14:170–177. doi: 10.4269/ajtmh.1965.14.170. [DOI] [PubMed] [Google Scholar]
- Tempelis CH, Reeves WC, Nelson RL. Species identification of blood meals from Culex tarsalis that had fed on passeriform birds. American Journal of Tropical Medicine and Hygiene. 1976;25:744–746. doi: 10.4269/ajtmh.1976.25.744. [DOI] [PubMed] [Google Scholar]
- Tripathy DN, Reed WM. Pox. In: Saif YM, Barnes HJ, Gilsson JR, Fadly AM, McDougald LR, Swayne DE, editors. Diseases of Poultry. Iowa State University Press; Ames, IA: 1997. pp. 643–659. [Google Scholar]
- Turell MJ, Dohm DJ, Sardelis MR, Oguinn ML, Andreadis TG, Blow JA. An update on the potential of North American mosquitoes (Diptera: Culicidae) to transmit West Nile virus. Journal of Medical Entomology. 2005;42:57–62. doi: 10.1093/jmedent/42.1.57. [DOI] [PubMed] [Google Scholar]
- Turell MJ, O’Guinn M, Oliver J. Potential for New York mosquitoes to transmit West Nile virus. American Journal of Tropical Medicine and Hygiene. 2000;62:413–414. doi: 10.4269/ajtmh.2000.62.413. [DOI] [PubMed] [Google Scholar]
- Verbeek NAM, Caffrey CL. American Crow (Corvus brachyrhynchos) In: Poole A, Gill F, editors. The birds of North America, No. 647. The Birds of North America, Inc; Philadelphia, PA: 2002. [Google Scholar]
- Ward MP, Raim A, Yaremych-Hamer S, Lampman R, Novak RJ. Does the roosting behavior of birds affect transmission dynamics of West Nile virus? American Journal of Tropical Medicine and Hygiene. 2006;75:350–355. [PubMed] [Google Scholar]
- Wilson JL, Reisen WK, Madon MB. Three years of West Nile virus in greater Los Angeles County. Proceedings of the Mosquito and Vector Control Association of California. 2006;74:9–11. [Google Scholar]
- Wolter K, Timlin MS. Monitoring ENSO in COADS with a seasonally adjusted principal component index. Proceedings of the Climate Diagnostic Workshop. 1993;17:52–57. [Google Scholar]
- Wright S, Wheeler SS, Perez B, Armijos V, Kelley K, Reisen W, Macedo PA. Avian herd immunity and WNV in Sacramento County. Proceedings of the Mosquito and Vector Control Association of Calif. 2007;75:23–24. [Google Scholar]
- Wunschmann A, Shivers J, Bender J, Carroll L, Fuller S, Saggese M, van Wettere A, Redig P. Pathologic findings in Red-tailed Hawks (Buteo jamaicensis) and Cooper’s Hawks (Accipiter cooperii) naturally infected with West Nile virus. Avian Diseases. 2004;48:570–580. doi: 10.1637/7170-022004R. [DOI] [PubMed] [Google Scholar]