

Abstract
This study adds to a growing literature showing that definitions for “standard drinks” are often difficult to conceptualize and that people often underestimate their actual drink sizes. As part of an intervention aimed at reducing negative neonatal and maternal outcomes, insured at-risk women were asked to identify the vessels from which they drank each of 6 beverages (n=266). We calculated differences between their actual and standard drink sizes. Additionally, differences were compared to those reported in an earlier study of uninsured inner city minority women that used identical vessels methodology. Over half of the spirits, fortified wine and malt liquor drinkers underestimated the actual number of ounces their drinks contained. Most spirits drinkers (90%) and approximately three-quarters of the wine and malt liquor drinkers drank larger-than-standard drink sizes, with the median drink size 1.5 to 2.0 times larger than the standard size for those beverages. Heavier drinkers (≥3 drinks per sitting) were more likely than lighter drinkers to underestimate their drink sizes. Findings were similar to those in the previous study using identical drink size measurements. Accurately assessing true drink sizes is underscored when the social, health and epidemiologic consequences associated with miscalculation are considered.
Keywords: drink size, drink volume
Introduction
Over recent years, researchers have heeded the call for improved measures of alcohol consumption and have begun to develop more sophisticated methodologies to assess actual use for both general populations (Dawson, 2003; Kerr, Greenfield, Tujague, & Brown, 2005; Martin & Nirenberg, 1991; Midanik, 1982; Miller, Heather, & Hall, 1991; Williams, Proudfit, Quinn, & Campbell, 1994; Wilson, 1981) and specialized populations, such as pregnant and parenting women (Ernhart, Morrow-Tlucak, Sokol, & Martier, 1988; Russell, Chan, & Mudar, 1997). For example, an earlier study with uninsured pregnant urban women found that when drink size was considered, average daily volume during pregnancy increased to the risk level for fetal alcohol syndrome (Kaskutas, 2000). This paper offers further evidence that drink size should be an important element in assessing potential risk. We focus specifically on an insured population of childbearing-aged females identified as at-risk for drinking during pregnancy by their prenatal care provider.
Historically, a common practice in national survey research (and a practice often used in smaller clinical studies) has been to instruct respondents to report the quantity and frequency of their alcohol intake over some reference period (Greenfield, 2000; Room, 1990). Alcohol use questions are usually prefaced with a definition of a “standard drink;” for example, “a 12-ounce can of beer, a 4-ounce glass of wine or a 1-ounce shot of liquor” (Alcohol Research Group, 1964–2005; Greenfield, Midanik, & Rogers, 2000; Stockwell et al., 2004), or “a can or bottle of beer, a glass of wine or a wine cooler, a shot of liquor, or a mixed drink with liquor in it (Office of Applied Studies, 2005). In this case, respondents are required to make quick mental translations to estimate the actual number of “standard drinks” they drink based on the size and alcohol-concentration across all beverages consumed. Other surveys ask respondents to report the number of ounces in their typical drinks for specific beverages (National Institute on Alcohol Abuse and Alcoholism, 2004). Both methods assume that respondents can conceptualize how much a fluid ounce is, an assumption challenged by a growing number of studies showing otherwise (Graves, Kaskutas, & Korcha, 1999; Stockwell et al., 2004; Wansink & van Ittersum, 2005; White et al., 2005).
To achieve more accurate consumption estimates, researchers have responded in innovative ways, for example, by asking respondents to designate their usual pour level for drinking vessels depicted in life-size photographs (National Institute on Alcohol Abuse and Alcoholism, 2004); or from a selection of actual glasses, bottles, and cans augmented by an array of vessel photographs (Kaskutas & Graves, 2000; M. Russell et al., 1997); or by asking respondents to first pour liquid into the glass they usually use for a particular beverage and then having them pour the liquid into a measuring beaker (Banwell, 1999; Carruthers & Binns, 1992; Kerr et al., 2005; Lemmens, 1994). These methods consistently reveal that actual alcohol consumption is underestimated (especially for higher ethanol content beverages and drinks that are poured from larger containers) such that standard drinks should be recalculated using mark-ups that reflect this under-reporting.
Table I displays recommended mark-ups for published studies that have looked specifically at drink size. These mark-ups appear to be culturally and demographically influenced. Reviewing across these studies, we found suggested mark-ups ranging from 1.25 for beer, 1.95 for wine, and 2.0 for spirits among drinkers ages 12 and older in New Zealand (Fryer, Kalafatelis, McMillen, & Palmer, 2004); around 1.04% for wine, 1.14 for fortified wine, and 1.26 for spirits among at-home Dutch drinkers (Lemmens, 1994); 1.92 for wine and 2.30 for spirits drinkers among employed Scottish drinkers (Gill & Donaghy, 2004); 1.3 for wine, 2.0 for spirits, 2.8 for malt liquor, and 2.7 for fortified wine among U.S. poor minority inner-city females (Kaskutas & Graves, 2000); 1.25 for beer, 1.50 for wine and 1.26 for spirits among college students in the U.S. (White, Kraus, McCracken, & Swartzwelder, 2003); and 1.24 for any drinks consumed from barware glasses (Wansink & van Ittersum, 2005).
Table 1.
Conversions suggested by studies using vessels to compare standard to actual drink size.
| Beverage | Perth mall sample |
Australian in-home drinkers |
Dutch in-home drinkers |
Australian in-home females |
U.S. urban minority women |
U.S. college students |
Scottish employed drinkers |
New Zealand drinkers ages 12+ |
US bartenders college students |
U.S. national sample |
|---|---|---|---|---|---|---|---|---|---|---|
| Stockwell 1991 |
Carruthers 1992 | Lemmen 1994 | Banwell 1999 | Kaskutas 2000 | White 2003 | Gill 2004 | Fryer 2004 | Wansink 2005 | Kerr 2005 | |
| Beer | 1.16 | 1.1–1.3 | -- | <1.0 | 1.0 | 1.25 | -- | 1.25 | -- | 0.93 |
| Wine | 1.25 | 1.1–1.4 | 1.04 | >1.0 | 1.3 | 1.50 | 1.92 | 1.95 | -- | 1.1 |
| Spirits | -- | 1.1–1.8 | 1.26 | >1.0 | 2.0 | 1.26 | 2.30 | 2.00 | -- | 1.48 |
| Malt liquor | -- | -- | -- | -- | 2.8 | -- | -- | -- | -- | -- |
| Fort wine | -- | 1.0–1.2 | 1.14 | <1.0 | 2.7 | -- | -- | -- | -- | -- |
| Wine cooler | -- | -- | -- | -- | 1.0 | -- | -- | -- | -- | -- |
| Champagne | -- | 1.1–1.4 | -- | >1.0 | -- | -- | -- | 1.60 | -- | -- |
| Liqueurs | -- | 0.7–1.0 | -- | >1.0 | -- | -- | -- | -- | -- | -- |
| Mix drinks | -- | -- | -- | -- | -- | 1.80 | -- | -- | -- | -- |
| Combined | -- | -- | -- | -- | -- | -- | 1.63 | 1.24 | -- |
Stockwell T (1991). Adult drinkers (ages 18+) were recruited outside a Perth, Australia shopping mall (n=74) and asked to pour a single drink of beer and wine from a 750 ml bottle into various glass sizes (contents measured in milliliters). Standard drink equivalences were 10 g ethyl alcohol per drink.
Carruthers, J (1992). Australian (Perth metropolitan area) subjects (n=1590) ages 18–45 were randomly selected using a cluster sampling technique. Subjects (in-home interviews) were asked to fill glasses they use at home with water (contents measured in milliliters to their usual pour level for each of seven beverages they drink (red wine, white wine, champagne, fortified wine, beer, spirits and liqueurs). Data are reported as confidence intervals for age groups 18–24, 25–34, 35–44 by gender. We report the confidence intervals for males ages 18–24 here because they reported the greatest overall variance. Standard drink equivalences were 10 g ethyl alcohol per drink. Intervals reported by researchers.[Carruthers, 1992 #10231]
Lemmens, PH (1994). Dutch subjects (n= 1236 men and women) were randomly drawn from a stratified sample of municipalities (two stage sampling) and asked about drinking on each of the previous 7 days and asked to pour water into their typical glass used at home (contents measured in milliliters) for beer, wine, fortified wine and spirits. Standard drink equivalences were 10 g ethyl alcohol per drink.[Lemmens, 1994 #10247]
Banwell C (1999). A purposeful sample of inner area Melbourne Australian woman (n=86) kept 2-week prospective diaries of their in-home drinking and drink measurements (measured in milliliters). Author does not report exact over or underestimates of drink sizes. Standard drink equivalences were not reported.[Banwell, 1999 females]
Kaskutas LA (2000). A convenience sample of pregnant urban minority women (n=185) were recruited from clinics, snowball referrals and community outreach and asked to identify their usual beverage container and their usual pour or fill level for six beverages (measured in fluid ounces). Standard drink equivalences were 12 oz of beer, 8 oz of malt liquor, 4 oz of wine, 12 oz of wine coolers, 3 oz of fortified wine, and 1 oz of spirits.[Kaskutas, 2000 # 11197]
White, AM (2003). Undergraduate students from a private university in southern U.S. (n=133) were recruited from fliers. Subjects were asked to free-pour a single beer, glass of wine, shot of liquor or the amount of liquor in a mixed drink into containers of different sizes. Conversions above represent the average volume (measured in fluid ounces) poured into test cups in each task; above estimates taken from a figure in which standard drink equivalences were 12 oz of beer, 4 oz of wine, 1.25 oz of liquor.[White, 2003 #14996]
Gill JS (2004). Scottish (Edinburgh) subjects from were recruited from staff facilities at a manufacturing plant, academic institution and financial institution (n=264). Subjects were asked to pour their usual drink of wine and spirits into a glass (contents measured in U.K. units) provided by the researcher. Standard drink equivalences were 8 g or 8 ml of absolute alcohol [Gill, 2004 #15945]
Fryer M (2004). A nationally representative sample of young people and adults (n=121) were asked to define their drink sizes in a qualitative interview (methodology not reported). Standard drink equivalences were 330 ml for normal strength beer, 100 ml for wine, 30 ml for spirits (or the equivalence of 10 g ethyl alcohol per drink) [Fryer, 2004 #13899.
Wansink B (2005). College students (n=198 from a U.S. university and bartenders (n=86) from the same area were recruited and asked to pour liquid from 1500 ml spirits bottles into glasses of varying shapes (contents measured in fluid ounces). Standard drink equivalence was 1.5 oz for spirits.[Wansink, 2005 #15224]
Kerr W (2005). Drinkers (n=310) drawn from a U.S. national survey were instructed to pour and then measure their usual at-home beverages (measured in fluid ounces). Overall findings reported, however, wide variation was found by age and gender. Alcohol content was determined by specific brand and type of beverage. Standard drink equivalences were 14 g of absolute alcohol.[Kerr, 2005 #14950] Sample of photographed vessels.
One problem with comparing drink size estimates across these studies is that there are no consistent definitions for standard drink sizes. For example, in the ten studies reviewed (see Table 1 notes) we found that standard drink sizes were described as grams of ethyl alcohol ranging from 8 to 14 grams, or as ounces of absolute alcohol with standard spirit drink size portions ranging from 1 to 1.5 ounces. Only one study adjusted for the differences in the alcohol concentration for specific beverage types (Kerr et al., 2005). In the U.S., the percentage of alcohol by volume (% ABV) for beer typically ranges from 4.3 or less (including light beers) to 5.0 or higher for the popular Budweiser brand and microbeers (Kerr et al., 2005). Further, white table wines have a lower % ABV on average than red wines and moreover, the US government labeling regulations allow the reported % ABV to vary by 1.5 percentage points in either direction (Kerr, Greenfield, Tujague, & Brown, 2006). However, putting measurement issues aside, the findings show a consistent trend across studies -- actual drink size portions tend to be larger than actual standard drink size portions.
While the magnitude of the difference between actual and standard drinks sizes may initially appear inconsequential, these differences can take on significance under specific circumstances, such as when making recommendations about general health practices and consumption (U.S. Department of Agriculture, 2000), accurately reporting epidemiologic consumption patterns over time (Kerr et al., 2006), and determining safe drinking as related to social consequences like driving under the influence (Dawson, 2003; World Health Organization, 2000). Further, precise measurement of alcohol intake can be especially important for assessing potentially high-risk situations where the likelihood for harm may be high and the possible effects of an intervention particularly beneficial. This paper uses data from one such intervention (called Early Start Plus) to examine the differences between actual and standard size portions reported by childbearing-aged women identified as at-risk for drinking during pregnancy.
The Early Start Plus intervention, which was implemented in 7 of 15 specialized Early Start prenatal care clinics (Armstrong et al., 2001) belonging to a large private nonprofit managed care health organization, sought to reduce negative neonatal and maternal outcomes by using drink size as a way of creating dialogue about pregnancy drinking. The intervention helped pregnant women recognize how much they actually drank, using calibrated glassware and other beverage containers along with computer graphics designed to define true volume for specific alcoholic beverage types (Witbrodt, Kaskutas, Korcha, & Armstrong, 2007). The intervention promoted abstinence, however, if that was not an obtainable goal, women were taught ways to cut down as much as possible during the remainder of their pregnancy.
The vessels (that is, glasses, cans and bottles) drink size assessment methods employed in the Early Start Plus intervention were identical to those used in a previous study (called DEER) that recruited pregnant uninsured urban minority women (n=185) primarily from clinics known to serve at-risk women, augmented by snowball referrals and community outreach to include hidden populations not necessarily receiving prenatal care (Kaskutas, 2000). The DEER study reported that daily drinkers had the highest levels of underestimation for their intake of alcoholic beverages and that the majority of women who drank malt liquor, fortified wine, and spirits reported drinking larger-than-standard drink sizes by a factor of 3 to 6 times the standard drink size portion. In addition, over 40 % of the women underestimated the actual number of fluid ounces in their drinks by about 30% (Kaskutas & Graves, 2000). Because both the DEER and Early Start Plus studies(Armstrong et al., 2008; Kaskutas, 2000) were part of clinics that sought to reduce neonatal risk by reducing pregnancy drinking among identified at-risk women, we chose more conservative estimates (relative to other national and international survey definitions) to define a standard drink size portion. Further, it was not feasible to adjust for any variation in the alcohol concentration of specific beverage types when we defined standard drink size portions for each beverage type. We defined standard drink sizes as 12 ounces for beer, 4 ounces for wine, 1 ounce for spirits, 8 ounces for malt liquor, 3 ounces for fortified wine, and 12 ounces for wine coolers (ethanol content is approximately 12 grams across all of these standard drink sizes).
The goals of this paper are to examine whether study women defined as at-risk for pregnancy drinking know how many ounces their usual drinks contain, and to calculate the magnitude of the difference between their self-selected drink size portions and assigned standard drink size portions for each of six beverage types consumed in the 12 months before becoming pregnant. We also examine these measures by drinking status, that is, by frequency of drinking (daily, weekly and less than weekly) and by high volume drinking (defined for this study population as consuming 3 or more standard drinks per day). Also, because identical vessels methods were used, we discuss how women in the Early Start Plus sample compare to those in the DEER sample on their drink size estimations. This is the first published paper we aware of that looks at studies using identical vessel’s methodologies to compare standard drink size portions to actual drink size portions for several beverage types.
Method
Sample and data collection
We report here on data collected from the seven prenatal care clinics that implemented the Early Start Plus intervention with at-risk women as part of their prenatal care. Women were initially identified as at-risk for substance use during pregnancy based on their responses to a universal screening questionnaire administered at their first prenatal care visit. These questionnaires were reviewed by obstetric providers. The screening questionnaire asked about a woman’s history of alcohol and drug use, the number of drinks it took “to feel high”, her partner’s use, and familial alcohol abuse. CAGE and TWEAK questions were part of the assessment (see Armstrong et al, 2001 for exact criteria). Women screened positive if they drank or used marijuana weekly or daily or ever used cocaine, methamphetamine or heroin in the 12 months before pregnancy; if they ever drank alcohol or used drugs since becoming pregnant; if they listed themselves under family history of alcohol or drug problems; if they indicated they had occasionally drank or used drugs more than they planned and/or spent more money on substances than they planned and if they ever felt they ought to cut down on their drinking or drug use; if they had been annoyed by peoples’ criticism of their drinking or drug use; if they felt they might have trouble staying off cigarettes, alcohol or drugs during pregnancy; or if they reported that it took 4 or more drinks to feel high. Of the 584 women who were eligible for the Early Start Plus intervention and were assessed in an in-depth interview with an Early Start Specialist, 266 were assessed as positive for risk of alcohol use during pregnancy and completed the Early Start Plus intervention. A few women who had been in treatment for a substance use disorder in prior months received the Early Start Plus intervention even though they were abstaining. Women diagnosed with a current substance use disorder were also referred to the chemical dependency recovery program within the health care organization for more intensive substance use treatment.
Measures
A number of measures were collected as part of this clinical trial. We report here only on those that address the goals of this paper These relate primarily to how women defined their usual drink size portions for beer, wine, fortified wine, malt liquor, wine coolers and spirits, and to our derivation and definition of heavy drinking.
Comparing actual to standard drink portions
Drink size was assessed using a self-defined drink size methodology fashioned after seminal work by Russell (1997) and later used by Kaskutas (2000) in the DEER study. Women were asked to select their usual drinking vessels (glasses, bottles and cans) and to indicate their usual pour or fill level for each alcoholic beverage they reported drinking in the previous 12 months. A set of nine actual glasses was available for the woman to choose from, augmented by colored photographs of other vessels (glasses, bottles and cans) for use when none of the actual glasses matched a woman’s usual beverage container (see Figure 1). Each photograph included one of the original nine glasses so the woman could visualize the scale of the other pictured vessels. Each vessel that was not a bottle or can was marked with a set of letters marking various heights to which the vessel might be filled. If the woman chose a glass as her usual vessel, she was asked how high she would usually fill it with the beverage — not including ice, water or other mixers. She responded by giving the letter that most accurately designated her pour level (calibrated to indicate fluid ounces). If she instead chose a bottle or can, she was asked how many drinks she considered that to be. Thus, if she indicated that a 40-ounce bottle malt liquor was 2 drinks, we calculated her usual drink of malt liquor as 20 ounces.
Fig. 1.
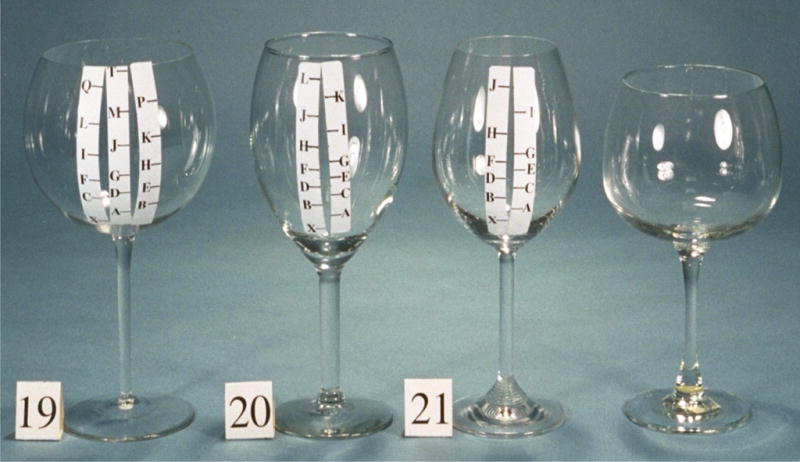
Sample of photographed vessels.
How many ounces
To learn if women knew the true volume of their self-selected drinks, the clinician pointed to the pour level on a woman’s self-selected vessel and asked, “About how many ounces do you think this is?” This question was asked for each beverage she drank. We report the percent of women who said their self-selected drink size contained fewer ounces than it really did.
Conversion ratios
We calculated a beverage-specific conversion ratio for each beverage the woman reported drinking. This was derived by dividing the number of ounces in a woman’s self-selected drink size portion by the number of ounces in the assigned standard drink size portion. Thus, if a woman reported her usual wine portion was 6 ounces, we divided 6 ounces by 4 ounces to get a conversion factor of 1.5 (indicating her self-selected portion was 50% larger than a standard wine portion). For each of the six alcoholic beverages, we report the median conversion ratio. As in the DEER study, we used the median conversion rather than the mean conversion ratio to adjust for outliers (that is, a few women who reported excessive drink sizes).
Heavier drinkers
Drinking information was captured from questions in the graduated frequency series (Clark & Hilton, 1991) that ask about how often (frequency) the woman drank a specific number (quantity) of drinks in the past 12 months. We regrouped the frequency data into three categories, that is, drank daily, weekly, or less-than-weekly (but at least once in the past 12 months). We used the quantity (number of drinks) data to code high volume drinking. High volume drinking was set at consuming three or more standard drinks per day (the frequency of drinking was not considered in the definition). We purposely chose this definition so that we would be consistent with how the DEER study reported high volume drinking. High volume drinking was defined in this manner because the sample consisted of women at-risk for drinking during pregnancy. We used these drinking measures to explore whether daily drinkers and high volume drinkers were more likely to underestimate (or over estimate) their drink size portions than less frequent and lighter drinkers.
Data Analysis
Descriptive data are provided in Tables 1 through 3, thus only percentages are reported. Nonparametric Kruskal-Wallis tests were used to compare the median conversion ratios for daily drinkers versus weekly and less-than-weekly drinkers, and MANN-Whitney U tests were used to compare the median conversion ratios for high volume drinkers (≥3 drinks per sitting) versus lower volume drinkers (1–2 drinks per sitting). Like the DEER study analyses, we chose non-parametric procedures because they do not make assumptions about the underlying distribution of the data. SPSS version 12 was used to run these tests (SPSS Inc., 2003).
Table 3.
How do actual self-selected drink size portions compare to standard drink size proportions?
| Beverage | a Standard size portion | b Median self-selected size portion | c Median conversion ratio |
|---|---|---|---|
| Beer (n=197)d | 12 oz | 12 oz | 1.00 |
| Wine (n=134 d | 4 oz | 6 oz | 1.50 |
| Spirits (n=225)d | 1 oz | 2 oz | 2.00 |
| Malt liquor (n=114)d | 8 oz | 12 oz | 1.50 |
| Fortified wine (n=70)d | 3 oz | 3 oz | 0.92 |
| Wine cooler (n=95)d | 12 oz | 12 oz | 1.00 |
Median conversion ratio =
median self-select drink size portion ÷
standard drink size portion.
Number of women who reported drinking the beverage.
Results
Sample
Study participants (n=266) were mostly white (29%) and Hispanic (31%), followed by smaller groups of women who were either African American (16%) or various other ethnicities (24%). Women were 26 years old on average; 60% had household incomes greater than $25,000 (22% above $60,000); and 81% had attained at least a high school diploma (just over half had attended college). More than half the women were married or in a marriage-like relationship (58%) and about two-thirds had previously given birth (68%). A majority reported drinking at least weekly in the past 12 months (66%), and over half (64%) of these women reported drinking 3 or more drinks on those drinking days. A small group (12%) reported drinking 5 or more drinks daily. Nearly half (48%) reported that someone in their family had an alcohol or drug problem; about a third answered “yes” to the two CAGE questions about feeling they should cut down or quit, or that they had been annoyed by criticism of their drinking or drug use; over half (58%) smoked in the 12 months before becoming pregnant, and 30% continued to smoke after becoming pregnant; almost two-thirds used drugs (includes illicit drugs and prescription pain, anxiety and sleep medications) in the prior 12 months, and a quarter continued to use these drugs after becoming pregnant.
Estimating one’s actual drink size
Table 2 (first data column) shows the percentage of women who underestimated the actual number of ounces in their self-selected drinking vessels. This information comes from the question, “About how many ounces do you think this is?” Beverage-specific data is limited to the number of women who reported drinking the beverage (the number who drank each beverage type is shown in parentheses): note that the most popular beverages were spirits (consumed by 84% of the women, n=225) and beer (consumed by 74% of the women, n=197); and the least preferred beverage was fortified wine (consumed by 26% of the women, n=70). Underestimates were more pronounced for higher ethanol content beverages and for beverages that are frequently poured from larger containers (for example, spirits) rather than bottled as a single serving (that is, beer and wine coolers). Nearly two-thirds of the spirits and fortified wine drinkers (61% and 60% respectively) said their drinks contained less than the actual number of ounces in the pour level they had identified on their selected vessels for these beverages. Fewer malt liquor (52%) and wine drinkers (37%) underestimated the true number of ounces in their drinks.
Table 2.
Do Early Start Plus clients (n=266) know how big their drinks are?
| Beverage | a Underestimated the number of ounces | b Drink size was larger than a standard size |
|---|---|---|
| Beer (n=197)c | 29% | 29% |
| Wine (n=134)c | 37% | 73% |
| Spirits (n=225) c | 61% | 90% |
| Malt liquor (n=114)c | 52% | 75% |
| Fortified wine (n=70)c | 60% | 46% |
| Wine cooler (n=95)c | 26% | 3% |
Percent of women who underestimated the actual number of ounces in their self-selected drinking vessel for each 6 beverages consumed.
Percent of women whose actual drink size portions were larger than the assigned standard size drink portions for each of the 6 beverages consumed.
Number of women who reported drinking the beverage.
As an additional step, we looked specifically at women who reported they actually drank standard size beverages (for example, their beer portions were 12 ounces, wine portions were 4 ounces etc.) to see whether they might be better at estimating the number of ounces in their drinks. They correctly estimated the number of fluid ounces in their standard drinks of beer, fortified wine, and wine coolers, but they misestimated the number of ounces in their wine, spirits, and malt liquor drinks (results not shown). Further, daily drinkers were not significantly better (or worse) at estimating the number of ounces in their drinks than less frequent (weekly or less-than-weekly) drinkers (results not shown).
Table 2 also displays the percentages of women whose actual drink portions were larger than our assigned standard-sized drink portions for each of the six beverages (second data column). Most spirits drinkers (90%) drank larger-than-standard portions. Approximately three-quarters of the wine (73%, n=134) and malt liquor (75%, n=114) drinkers consumed larger-than-standard portions of these beverages.
Comparing self-defined to standard drink size portions
The last data column in Table 3 displays the median conversion ratios by beverage type. As a reference, the table also displays the assigned number of ounces in a standard drink size portion (first data column) and the median number of ounces in the women’s actual self-selected drink size portions (second data column) used to calculate our conversion ratios (self-selected portion ÷ standard size portion). The median conversion ratios for adjusting actual self-selected portions as a function of standard drink sizes were highest for spirits (2.0), wine (1.5), and malt liquor (1.5). Women (as a whole) did not underestimate the size of their beer, fortified wine, and wine cooler drinks.
To explore whether heavier drinkers might be more prone to consume larger drink size portions than lighter or less frequent drinkers, we looked at conversion ratios (self-selected portion ÷ standard size portion) for three classes of heavier drinkers: those who reported drinking larger-than-standard drink size portions, those who drank daily, and those who reported ever drinking 3 or more drinks at a sitting in the 12 months before becoming pregnant (Table 4; see notes for details). Women whose usual drink size portion(s) were larger than the assigned standard size portion underestimated their drink size portions for all beverages by a conversion of ratio of 1.5 (50%) or more (first data column), with the highest level of underestimation for spirits and fortified wine (these conversion ratios were ∃ 2.0, or ∃ 200% above the standard drink size portion). We found only one significant difference when we tested whether daily drinkers were more likely than less frequent drinkers to have larger than standard sized drink portions (second data column): daily wine drinkers self-selected larger drinks than the weekly and less-than-weekly wine drinkers (1.75, 1.50, and 1.00 respectively; Kruskal-Wallis Test, chi-square value = 15.4, df = 2, p = .001). Translating these conversion ratios to actual fluid ounces, this means that the median serving size of wine was 7 fluid ounces for daily drinkers (almost double the assigned standard size or equivalent to nearly 2 standard drinks), 6 fluid ounces for weekly drinkers, and 4 fluid ounces (assigned standard size portion) for infrequent drinkers. Last, testing whether high volume drinkers (≥3 drinks at a sitting) were more prone to have larger drinks than lighter drinkers (third data column), we found no significant differences (Mann-Whitney U Test) for any of the six beverages. For parsimony, the conversion ratios are shown for the daily drinkers and the high volume drinkers but not their respective comparison groups in Table 4.
Table 4.
How do heavier drinkers actual drink size portions compare to standard drink size portions?
| a Median Conversion Ratios | |||
|---|---|---|---|
| Beverage | Self-selected > Standard size portion | b Daily drinker | c High volume (≥3) drinker |
| Beer (n=58,33,187 respectively)d | 1.75 | 1.00 | 1.0 |
| Wine (n=98,23,122d | 1.63 | 1.75 | 1.5 |
| Spirits (n=202,30,209)d | 2.00 | 1.50 | 2.0 |
| Malt liquor (n=86,25,107)d | 1.50 | 1.50 | 1.5 |
| Fortified wine (n=32,14,68)d | 2.17 | 2.30 | 1.0 |
| Wine cooler (n=3,10,90)d | -- | 1.00 | 1.0 |
Median conversion ratio = median self-select drink size portion ÷ standard drink size portion.
Kruscal-Wallis Test comparing daily drinkers to weekly and less-than-weekly drinkers for each beverage category; significance found only for wine drinkers(p=0.001).
Mann-Whitney U Test used comparing binge drinkers (3+) to non-binge drinkers; no significant differences for any beverage type.
The number of women who drank each beverage type and fit the drinker typology (cell sizes are shown in parentheses).
Discussion
This study extends previous work on drink size underestimation among poor, uninsured, predominantly African-American (56%) and American-Indian (33%) pregnant women (DEER) (Kaskutas & Graves, 2000) to a privately insured population with higher socioeconomic status and proportionately more White and Hispanic women (Early Start Plus). Despite demographic differences, the rate of regular high volume drinking (having ≥3 drinks in a sitting) for the year prior to pregnancy was the same in these two samples of childbearing aged women (about 50%). These two studies have an advantage over comparisons with other similar research on drink size (see Table 1) in that identical measures were used to determine differences between actual and assigned standard drink size portions.
We found important similarities in drink size estimations between the two samples. For example, high proportions of women in both samples were unable to determine accurately the number of ounces in their self-defined drinks, highlighting the folly of asking survey respondents how many ounces there are in their usual drinks. Secondly, the majority of women in both samples had larger-than-standard size portions for wine, spirits and malt liquor drinks. Third, the magnitude in the discrepancy between actual and standard drink sizes was almost identical for two popular beverages (wine and spirits) in both samples, with wine drinks actually one-and-a-half times the standard size and spirits drinks twice the standard size (i.e., mark-ups of 1.5 and 2.0 respectively). These results highlight the need for paying attention to drink size when assessing risk among pregnant drinkers, regardless of insurance status or other presumed socioeconomic indicators of risk.
Our review of other drink size studies suggests that attention to portion size is important in general population studies as well. As shown in Table 1, people tend to underestimate the size of their drinks. Researchers and practitioners may want to take seriously the recommendation of offering respondents alternative ways for determining their drink sizes. A variety of field-tested methods exists (e.g., using actual vessels; using photographs; and for home surveys, having respondents use their actual drinking vessels and measure those drink sizes). Because of people’s inability to accurately estimate how many ounces are in their usual drinks (as supported in this and other research (Kaskutas & Graves, 2000), we strongly encourage researchers and practitioners to explore these alternative and more precise methods for measuring alcohol consumption. Survey respondents cannot be expected to translate their drink sizes into standard drinks: drinkers are oblivious to the discrepancy between their typical drink and a standard drink for a given beverage (Fryer et al., 2004). Even experienced bartenders unwittingly pour larger amounts of liquor into certain types of glasses (short, wide ones) (Wansink & van Ittersum, 2005).
Moreover, the magnitude of the drink size underestimations reported in various studies becomes significant when we consider such messages as the US Surgeon General’s recommendation that females not drink more than two standard drinks a day (Surgeon General, 1988). U.S. dietary guidelines take a more conservative approach and suggest no more than one drink a day for females (2 for males) (U.S. Department of Agriculture, 2000). The detrimental health effects of going from moderate drinking (Dufour, 1999) to heavier drinking have been documented in evidence-based research (Rehm, Greenfield, & Kerr, 2006). In our current sample of at-risk drinkers, two-thirds of the women reported drinking 3 drinks or more a day (self-defined) at least weekly in the year prior to pregnancy. In addition, most women drank spirits, the beverage with the highest underestimation.
In conclusion, the magnitude of drink size underestimation (especially for higher alcohol content beverages and among the heaviest drinkers) calls into question previous research on the epidemiology of drinking among women prior to pregnancy, as well as the risk levels that have been established for drinking a particular amount of alcohol. Our research and that of others (see Table 1) suggests across-the-board mismeasurement of drinking, with greater error among those beverage types contributing the most to a population’s alcohol consumption and to a population’s harms associated with risky drinking.
Acknowledgments
This project was supported by a grant (R01 AA12486-05) from the National Institute on Alcohol Abuse and Addiction.
Biographies
Jane Witbrodt, MPH is a senior analyst the Alcohol Research Group in Emeryville, California and a doctoral student at the Karolinska Institute, Stockholm. Prior to her current research focus, she worked in substance abuse treatment, first as a clinician in an inpatient program and later as a program director in an outpatient program. Her interests are primarily in exploring both formal and informal solutions to alcohol and drug addictions, with special interest in women’s issues. She has first-authored articles on substance use problems in the Journal of Consulting and Clinical Psychology, the American Journal of Drug and Alcohol Abuse, and the Journal of Addiction Nursing; and she has coauthored several papers with Dr. Lee Ann Kasktuas.
Dr. Lee Ann Kaskutas is a senior scientist at the Alcohol Research Group in Emeryville, California, and is an Associate Adjunct Professor at the School of Public Health in Berkeley, California. Her current interests include mutual aid organizations (such as Alcoholics Anonymous), peer helping, recovery, and drinking measurement. She recently co-edited the forthcoming volume of Recent Developments in Alcoholism, and authored a chapter on the epidemiology of AA participation in that book (Kaskutas, L. A., Y. Ye, et al. (2007). (forthcoming) Epidemiology of Alcoholics Anonymous Participation. Recent Developments in Alcoholism, Volume 18: Alcoholics Anonymous and Spiritual Aspects of Addiction Recovery. M. Galanter and L. A. Kaskutas. New York, NY, Kluwer Academic/Plenam Publishers. 18).
Rachael A. Korcha, MA, at the Alcohol Research Group, has been researching addictive behaviors for the last 15 years. Her current research work examines psycho-social functioning among childhood cancer survivors, longitudinal follow-up of sober living house residents and intimate partner violence patterns among economically impoverished women. She has coauthored articles in Addiction, the American Journal of Drug and Alcohol Abuse, and Alcoholism: Clinical & Experimental Research.
Mary Anne Armstrong, MA is a Biostatistician and Investigator at the Kaiser Permanente Division of Research in Oakland, California. She has been with the Division of Research since 1980, where she has worked in a variety of research areas, including alcohol and health, perinatal substance abuse, and maternal and child health, and has authored or co-authored more than 70 publications. She is a member and Vice-Chair of the Northern California Kaiser Permanente Central Research Committee and is the Director of the Division of Research Biostatistical Consulting Unit. She is currently the Principal Investigator of a 4-year NIAAA-funded grant to validate the 4Ps Plus maternal substance use screening questionnaire with Dr. Ira Chasnoff.
References
- Alcohol Research Group. National Alcohol Survey (NAS1–NAS11) Berkeley, CA: Alcohol Research Group, Public Health Institute; 1964–2005. [Google Scholar]
- Armstrong MA, Kaskutas LA, Witbrodt J, Taillac CJ, Hung YY, Osejo VM, et al. Using drink size to talk about drinking during pregnancy: a randomized clinical trial of Early Start Plus. Social Work in Health Care. 2008 doi: 10.1080/00981380802451210. [in press] [DOI] [PMC free article] [PubMed] [Google Scholar]
- Armstrong MA, Lieberman LR, Carpenter DM, Gonzales VM, Usatin MS, Newman L, et al. Early Start: an obstetric clinic-based, perinatal substance abuse intervention program. Quality Management in Health Care. 2001;9(2):6–15. doi: 10.1097/00019514-200109020-00004. [DOI] [PubMed] [Google Scholar]
- Banwell C. How many standard drinks are there in a glass of wine? Drug and Alcohol Review. 1999;18:99–101. [Google Scholar]
- Carruthers SJ, Binns CW. The standard drink and alcohol consumption. Drug and Alcohol Review. 1992;11:363–370. doi: 10.1080/09595239200185491. [DOI] [PubMed] [Google Scholar]
- Clark WB, Hilton M, editors. Alcohol in America: Drinking practices and problems. Albany, NY: State University of New York Press; 1991. [Google Scholar]
- Dawson DA. Methodological issues in measuring alcohol use. Alcohol Research & Health. 2003;27(1):18–29. [PMC free article] [PubMed] [Google Scholar]
- Dufour MC. What is moderate drinking? Defining “drinks” and drinking levels. Alcohol Health & Research World. 1999;23(1):5–14. [PMC free article] [PubMed] [Google Scholar]
- Ernhart CB, Morrow-Tlucak M, Sokol RJ, Martier S. Underreporting of alcohol use in pregnancy. Alcoholism: Clinical and Experimental Research. 1988;12:506–511. doi: 10.1111/j.1530-0277.1988.tb00233.x. [DOI] [PubMed] [Google Scholar]
- Fryer M, Kalafatelis E, McMillen P, Palmer S. An in-depth investigation of volumes of alcohol consumed by Youth Uncontrolled Binge Drinkers, and Adult Constrained & Uninhibited Binge Drinkers [BRC #2838] Wellington, New Zealand: BRC Marketing & Social Research & Alcohol Advisory Council of New Zealand; 2004. Standard Drink Calibration. [Google Scholar]
- Gill JS, Donaghy M. Variation in the alcohol content of a ‘drink’ of wine and spirit poured by a sample of the Scottish population. Health Education Research. 2004;19(5):484–491. [PubMed] [Google Scholar]
- Graves K, Kaskutas LA, Korcha R. Impact of self-selected vessel size on alcohol consumption. Alcoholism: Clinical & Experimental Research. 1999;23(5 Suppl):122A. [Google Scholar]
- Greenfield TK. Ways of measuring drinking patterns and the difference they make: experience with graduated frequencies. Journal of Substance Abuse. 2000;12(1):33–49. doi: 10.1016/s0899-3289(00)00039-0. [DOI] [PubMed] [Google Scholar]
- Greenfield TK, Midanik LT, Rogers JD. A ten-year national trend study of alcohol consumption 1984–1995: is the period of declining drinking over? American Journal of Public Health. 2000;90(1):47–52. doi: 10.2105/ajph.90.1.47. [DOI] [PMC free article] [PubMed] [Google Scholar]
- Kaskutas LA. Understanding drinking during pregnancy among urban American Indians and African Americans: health messages, risk beliefs, and how we measure consumption. Alcoholism: Clinical and Experimental Research. 2000;24(8):1241–1250. [PubMed] [Google Scholar]
- Kaskutas LA, Graves K. An alternative to standard drinks as a measure of alcohol consumption. Journal of Substance Abuse. 2000;12:67–78. doi: 10.1016/s0899-3289(00)00042-0. [DOI] [PubMed] [Google Scholar]
- Kerr WC, Greenfield TK, Tujague J, Brown S. A drink is a drink? Variation in the alcohol content of beer, wine, and spirits drinks in a U.S. methodological sample. Alcoholism: Clinical & Experimental Research. 2005;29(11):2015–2021. doi: 10.1097/01.alc.0000187596.92804.bd. [DOI] [PubMed] [Google Scholar]
- Kerr WC, Greenfield TK, Tujague J, Brown S. The alcohol content of wine consumed in the US and per capita consumption: new estimates reveal different trends. Alcoholism: Clinical & Experimental Research. 2006;30(3):516–522. doi: 10.1111/j.1530-0277.2006.00065.x. [DOI] [PubMed] [Google Scholar]
- Lemmens PH. The alcohol content of self-report and ‘standard’ drinks. Addiction. 1994;89:593–601. doi: 10.1111/j.1360-0443.1994.tb03336.x. [DOI] [PubMed] [Google Scholar]
- Martin CS, Nirenberg TD. Alcohol content variation in the assessment of alcohol consumption. Addictive Behaviors. 1991;16:555–560. doi: 10.1016/0306-4603(91)90064-o. [DOI] [PubMed] [Google Scholar]
- Midanik LT. The validity of self-reported alcohol consumption and alcohol problems: a literature review. British Journal of Addiction. 1982;77:357–382. doi: 10.1111/j.1360-0443.1982.tb02469.x. [DOI] [PubMed] [Google Scholar]
- Miller WR, Heather N, Hall W. Calculating standard drink units: international comparisons. British Journal of Addiction. 1991;86(1):43–47. doi: 10.1111/j.1360-0443.1991.tb02627.x. [DOI] [PubMed] [Google Scholar]
- National Institute on Alcohol Abuse and Alcoholism. National Epidemiologic Survey on Alcohol and Related Conditions (NESARC) National Institute on Alcohol Abuse and Alcoholism, National Institutes on Health; 2004. [accessed 01/10/06]. http://niaaa.census.gov. [PMC free article] [PubMed] [Google Scholar]
- Office of Applied Studies. National Survey on Drug Use & Health (NSDUH) Washington, DC: Office of Applied Studies, SAMHSA; 2005. http://www.oas.samhsa.gov/nsduh.htm. [Google Scholar]
- Rehm J, Greenfield TK, Kerr WC. Patterns of drinking and mortality from different diseases – an overview. Contemporary Drug Problems. 2006;33(2):205–235. [Google Scholar]
- Room R. Measuring alcohol consumption in the United States: methods and rationales. In: Kozlowski L, Annis HM, Cappell HD, Glaser FB, Goodstadt MS, Israel Y, Kalant H, Sellers EM, Vingilis ER, editors. Research advances in alcohol and drug problems. Vol. 10. New York: Plenum Press; 1990. pp. 39–80. [Google Scholar]
- Russell M, Chan AWK, Mudar P. Gender and screening for alcohol-related problems. In: Wilsnack RW, Wilsnack SC, editors. Gender and Alcohol. Individual and social perspectives. New Brunswick, NJ: Rutgers Center of Alcohol Studies; 1997. pp. 417–444. [Google Scholar]
- Russell M, Marshall JR, Trevisan M, Freudenheim J, Chan AWK, Markovic N, et al. Test-retest reliability of the Cognitive Lifetime Drinking History. American Journal of Epidemiology. 1997;146(11):975–982. doi: 10.1093/oxfordjournals.aje.a009225. [DOI] [PubMed] [Google Scholar]
- SPSS Inc. Base 12.0. Chicago, IL: SPSS Inc; 2003. [Google Scholar]
- Stockwell T, Donath S, Cooper-Stanbury M, Chikritzhs T, Catalano P, Mateo C. Under-reporting of alcohol consumption in household surveys: a comparison of quantity-frequency, graduated-frequency and recent recall. Addiction. 2004;99(8):1024–1033. doi: 10.1111/j.1360-0443.2004.00815.x. [DOI] [PubMed] [Google Scholar]
- Surgeon General. Report on nutrition and health. Washington, D.C: Government Printing Office; 1988. [Google Scholar]
- U.S. Department of Agriculture. Nutrition and Your Health: Dietary guidelines for Americans. 5. Washington, D.C: U.S. Department of Agriculture; U.S. Department of Health and Human Services; 2000. [Google Scholar]
- Wansink B, van Ittersum K. Shape of glass and amount of alcohol poured: comparative study of effect of practice and concentration. BMJ. 2005;331(December 24):1512–1514. doi: 10.1136/bmj.331.7531.1512. [DOI] [PMC free article] [PubMed] [Google Scholar]
- White AM, Kraus CL, Flom JD, Kestenbaum LA, Mitchell JR, Shah K, et al. College students lack knowledge of standard drink volumes: implications for definitions of risky drinking based on survey data. Alcoholism: Clinical & Experimental Research. 2005;29(4):631–638. doi: 10.1097/01.alc.0000158836.77407.e6. [DOI] [PubMed] [Google Scholar]
- White AM, Kraus CL, McCracken LA, Swartzwelder HS. Do college students drink more than they think? Use of a free-pour paradigm to determine how college students define stardard drinks. Alcoholism: Clinical & Experimental Research. 2003;27(11):1750–1756. doi: 10.1097/01.ALC.0000095866.17973.AF. [DOI] [PubMed] [Google Scholar]
- Williams GD, Proudfit AH, Quinn EA, Campbell KE. Variations in quantity-frequency measures of alcohol consumption from a general population survey. Addiction. 1994;89:413–421. doi: 10.1111/j.1360-0443.1994.tb00915.x. [DOI] [PubMed] [Google Scholar]
- Wilson P. Improving the methodology of drinking surveys. The Statistician. 1981;30:159–167. [Google Scholar]
- Witbrodt J, Kaskutas LA, Korcha R, Armstrong MA. [under review] Underestimation of Alcohol Consumption among Women At-risk for Drinking during Pregnancy. Emeryville, CA: Alcohol Research Group, Public Health Institute; 2007. [Google Scholar]
- World Health Organization. International Guide for Monitoring Alcohol Consumption and Related Harm. Copenhagen, Denmark: World Health Organization, Department of Mental Health and Substance Dependence, Noncommunicable Diseases and Mental Health Cluster; 2000. [Google Scholar]