

Abstract
The reproducibility of repeated single-voxel 1H MRS (SV-MRS) and spectroscopic imaging (MRSI) measurements of intramyocellular lipid (IMCL) in the tibialis anterior muscle of five lean and five overweight female Caucasians, during 7 days of controlled dietary fat and calorie intake, was assessed at 1.5 T. Duplicate measures of IMCL relative to total muscle creatine (IMCL/tCr) obtained 3 days apart by both SV-MRS and MRSI correlated well (r =0.65 and r =0.95, respectively, P <0.05). The coefficients of variation for repeated measures of IMCL/tCr by SV-MRS and MRSI were 24.4% and 10.7%, respectively. IMCL/tCr measured by MRSI was higher in overweight subjects than in lean subjects (8.3 ± 3.8 vs 4.3 ± 2.4, P <0.05). Although both methods achieved good reproducibility in measuring IMCL in vivo, MRSI was found to offer greater flexibility and reliability, and higher sensitivity to IMCL differences, whereas SV-MRS was advantageous with respect to shorter scan time and ease of implementation.
Keywords: intramyocellular lipid, reproducibility, MRS, spectroscopic imaging, diet, overweight
INTRODUCTION
Intramyocellular lipid (IMCL), the small droplets of triglycerides in skeletal muscle fibers, is an important source of cellular energy for the tissue and has been increasingly implicated in the pathophysiology of obesity, insulin resistance, and diabetes mellitus (1–4). An understanding of in vivo metabolism of IMCL thus has the potential to contribute significant new insights into the worldwide problem of obesity and its complications. Measures of IMCL have traditionally been derived from destructive biochemical analyses of muscle tissue biopsy specimens. However, this approach is limiting, as it does not permit reliable and consistent discrimination of IMCL from extramyocellular lipid (EMCL), and is not applicable in longitudinal studies (5,6). In contrast, it has been recently shown that magnetic susceptibility differences and appropriate geometric orientation of in vivo muscle fibers can induce a frequency difference of up to ~0.2 ppm between the resonances of IMCL and EMCL on 1H MRS, to allow reliable discrimination between IMCL and EMCL in human calf muscle (7–16). Non-invasive 1H MRS clearly offers a distinct advantage over biopsy in longitudinal studies of muscle lipid content and metabolism.
Although several single- (SV-MRS) and multi-voxel or spectroscopic imaging (MRSI) studies of IMCL have now been reported (10–16), there remains a need to fully establish the experimental conditions needed to derive consistent in vivo human muscle IMCL measurements by 1H MRS, especially in studies of obese and diabetic subjects with high intermuscular adipose tissue infiltration, which might lead to inadequate discrimination of IMCL and EMCL (17). Furthermore, IMCL is a dynamic energy pool, and the in vivo concentration fluctuations due to dietary, metabolic, and physiological demands (14,18–20) may confound interpretation.
We therefore undertook this study to assess the reproducibility and reliability of making repeated measurements of IMCL in the tibialis anterior (TA) muscle of lean and overweight female Caucasians by 1H SV-MRS and MRSI, under conditions that would minimize the potential confounding effects of uncontrolled dietary caloric and fat intake on IMCL concentrations. For each subject, only the total daily calories and total calories from fat consumed were controlled. The choice of source of calories and fat was left to individual preference.
METHODS
Study subjects
Ten healthy pre-menopausal female Caucasians, 25–45 years of age, were recruited for the study. Of these, five were overweight, as assessed by body mass index (BMI) (mean ± SD age 32.5 ± 5.7 years; BMI 33.5 ± 4.2 kg/m2), and five were lean (age 32.3 ± 8.7 years; BMI 20.4 ± 0.9 kg/m2). All subjects were medically healthy, with regular menstrual cycles and sedentary lifestyles. Subjects with diabetes, taking oral contraceptives, or who had undergone a weight change of more than 5 kg within the preceding 3 months were excluded from the study.
Diet control
All the study participants were instructed to keep a prospective diet record for 7 days to be used as the basis for their individualized diet plans. Each record consisted of a list and amounts of items consumed such as meals, snacks, and drinks, expressed in common household measurement units (e.g. ounce, pound, mL, cup, serving, tablespoon, or slice). On the basis of these records, the caloric and fat contents of each subject’s diet were calculated using commercially available software (Weight-By-Date Pro; ProVariant Software, Westerville, OH, USA). A 1-week diet plan was then generated for each subject, slightly modified from the diet record to maintain the total daily fat and caloric intake within ±5%. Starting on the 5th day of the menstrual cycle, the subjects were started on the 7-day diet as instructed by a trained dietitian. At 9:00 am of day 4 and day 7 of this 7-day diet period, 1H SV-MRS and MRSI scans were performed on each subject after a 12-h overnight fast.
1H MRS methods
Duplicate 1H SV-MRS and MRSI scans of the TA muscle in the left calf for IMCL measurements were performed on a 1.5 T whole-body Signa ‘LX’ MR system (General Electric, Milwaukee, WI, USA), using the standard PRESS sequence [P. A. Bottomley, US Patent 4480 228 (1984)] with a manufacturer-supplied transmit/receive quadrature lower-extremity coil. To ensure reproducible voxel or slice positioning on repeated scans, tissue anatomy landmark-based prescription was used, in conjunction with an MRI-visible external marker (Fig. 1) which remained affixed to the subject’s calf between scans. In both 1H SV-MRS and MRSI acquisitions, the volume of interest was positioned to minimize inclusion of visible adipose tissue, and 3 cm-thick outer-volume suppression bands were prescribed to suppress signal around the six sides of the selected voxel. Water suppression and the static magnetic field homogeneity were optimized using automated procedures supplied by the instrument manufacturer.
Figure 1.
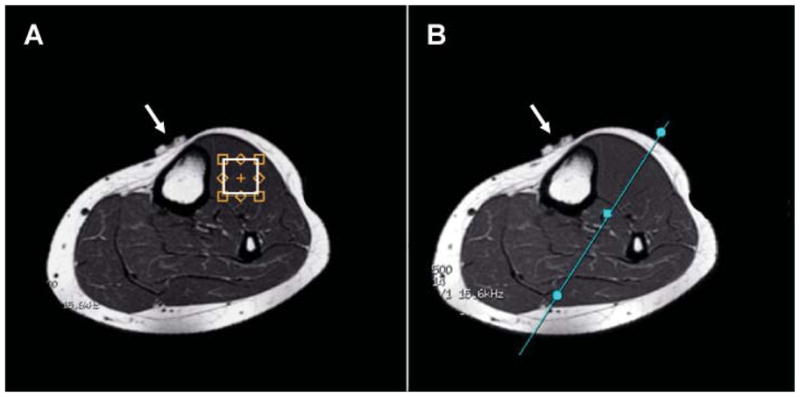
T1-weighted MR images depicting (A) placement of the voxel in the TA muscle for SV-MRS data acquisition, and (B) location of coronal-oblique MRI slice traversing the TA muscle used to prescribe all 1H MRSI scans. The white arrows point to the MRI-visible marker used to help to achieve reproducible voxel or slice positioning in the same subject from scan to scan.
1H SV-MRS
A 1.5 × 1.5 × 1.0 cm3 (2.25 cm3) voxel was positioned in the left calf TA muscle on axial T1-weighted images (Fig. 1A), and then the data were acquired in 3.2 min with the PRESS sequence, using TE/TR 35/1500 ms, 128 signal averages, 2048 time-domain points, and a 1 kHz spectral width.
1H MRSI
Two-dimensional 1H MRSI data were recorded from a single 0.5 cm coronal-oblique slice that bisected the single-voxel location in the left calf TA muscle (Fig. 1B). The data were recorded in 14.5 min, using the PRESS-SI sequence, with 24 × 24 phase-encoding steps, one excitation per phase-encoding step, field of view 16 cm, TE/TR 35/1500 ms, 2048 time-domain points, and 1 kHz spectral width. The nominal voxel size, after zero-filling to a matrix size of 32 × 32 and then post-processing, was 0.22 cm3.
MRS data processing
The resulting 1H SV-MRS and MRSI data were processed using IDL-based MRS data analysis software, XsOs-NMR, developed in-house by two of the investigators (X.M., D.C.S.). Peak areas for IMCL, EMCL and tCr in both the SV-MRS and MRSI scans were obtained by simulating and fitting the spectral resonances as a sum of Lorentzian lineshape functions, using time-domain nonlinear least squares. Figure 2 illustrates the quality of the resulting fit for a TA muscle spectrum of a lean female subject.
Figure 2.

Sample time-domain non-linear least-squares Lorentzian lineshape model fitting of a TA muscle spectrum for deriving IMCL, EMCL and tCr peak areas: (a) measured spectrum; (b) calculated ‘best-fit’ spectrum; (c) individual components of the ‘best-fit’ spectrum; (d) residual of the difference between the measured and calculated ‘best-fit’ spectra.
IMCL concentrations were expressed as peak area ratios relative to total muscle creatine (IMCL/tCr). As the PRESS SV-MRS sequence supplied by the instrument manufacturer automatically records a spectrum of the unsuppressed water resonance from the voxel of interest, IMCL concentrations for 1H SV-MRS data were also expressed as peak area ratios relative to internal tissue water (IMCL/W). For the 1H MRSI data, IMCL/tCr was obtained by deriving the peak areas voxel-by-voxel, then computing the mean values for all TA voxels that exhibited adequately resolved IMCL and EMCL resonances, which were selected by consensus by two of the investigators (W.S., X.M.). Spectra from voxels with unresolved EMCL and IMCL were excluded from further analysis; although this resulted in a variable number of voxels for different subjects, it did not result in exclusion of any subject. Table 1 provides, for each subject, the number of useable MRSI voxels in the duplicate scans included in the statistical data analyses.
Table 1.
Number of TA MRSI voxels per subject used in analysis along with the derived IMCL/tCr values for the duplicate scans. Values are mean ± SD
| Group | Subject I.D. | Scan 1 |
Scan 2 |
||
|---|---|---|---|---|---|
| No. of voxels | IMCL/tCr | No. of voxels | IMCL/tCr | ||
| Lean | Ln-01 | 10 | 5.78 ± 1.48 | 23 | 7.18 ± 3.20 |
| Ln-02 | 8 | 4.65 ± 1.37 | 6 | 5.04 ± 1.45 | |
| Ln-03 | 7 | 6.07 ± 1.56 | 5 | 6.90 ± 1.87 | |
| Ln-04 | 13 | 1.96 ± 0.45 | 11 | 1.57 ± 0.62 | |
| Ln-05 | 12 | 1.73 ± 0.90 | 22 | 1.78 ± 0.50 | |
| Obese | Ob-01 | 23 | 14.39 ± 2.33 | 16 | 12.66 ± 3.96 |
| Ob-02 | 4 | 3.48 ± 2.78 | 2 | 2.94 ± 1.06 | |
| Ob-03 | 9 | 11.1 ± 2.60 | 13 | 8.23 ± 4.82 | |
| Ob-04 | 12 | 8.10 ± 4.12 | 9 | 6.34 ± 2.39 | |
| Ob-05 | 17 | 7.87 ± 2.59 | 15 | 7.80 ± 1.21 | |
Statistical methods
The reproducibility of the repeated measurements of IMCL by 1H SV-MRS and MRSI was assessed with the Pearson correlation coefficient (r), and with the percentage coefficient of variation (%CV). Pearson’s correlation coefficient was also used to determine the magnitude of the correlation between 1H SV-MRS and MRSI measures of IMCL, as well as to assess whether BMI correlated with 1H SV-MRS and MRSI measures of IMCL. Significant differences were assessed at P <0.0.5 using two-tailed Student’s t-test. All results are expressed as mean ± SD.
RESULTS
Dietary caloric intake in lean and overweight subjects
During the 7-day diet period, the diet record showed that lean subjects consumed significantly fewer total dietary calories (1746.4 ± 127.4 vs 2162.8 ± 240.9 kcal/day; P =0.009) and fewer dietary fat calories (533.8 ± 63.5 vs 726.6 ± 157.7 kcal/day; P =0.04) than overweight subjects, reflecting the relative amounts of total daily calories regularly consumed by individuals in the two groups.
1H MRS data for TA muscle
1H SV-MRS
Figure 3 shows representative single-voxel MR spectra recorded from the right calf muscle of a normal-weight female subject. To demonstrate the spatial heterogeneity of fat distribution, data are shown for three 2.25 cm3 voxels (Fig. 2) which were prescribed on a T1-weighted MRI slice parallel to the long axis of the TA muscle (i.e. perpendicular to the slice shown in Fig. 1A), and were selected to contain: (i) muscle tissue with no visible intermuscular adipose tissue (Fig. 3A, voxel ‘a’); (ii) muscle with minimal visible intermuscular adipose tissue (Fig. 3A, voxel ‘b’); and (iii) muscle with relatively large amount of intermuscular adipose tissue (Fig. 3A, voxel ‘c’). The lipid region of the spectrum for the voxel selected in the lean muscle tissue (Fig. 3A, voxel ‘a’) shows a single peak, which, on the basis of its chemical shift of 1.28 ppm, was assigned to IMCL (Fig. 3B, panel ‘a’). The spectrum from the voxel selected to contain muscle with minimal visible intermuscular adipose tissue (Fig. 3A, voxel ‘b’) shows two peaks, which could be readily assigned to IMCL at 1.28 ppm and EMCL at 1.50 ppm (Fig. 3B, panel ‘b’) (10), whereas the spectrum from the voxel selected in muscle with relatively large amount of visible intermuscular adipose tissue (Fig. 3A, voxel ‘c’) shows a very large EMCL peak at 1.50 ppm which has completely obscured the smaller underlying IMCL resonance (Fig. 3B, panel ‘c’). Also present in these spectra is a resonance with a relatively stable amplitude which can be assigned to muscle tCr on the basis of its 3.0 ppm chemical shift. These data illustrate that, for SV-MRS, careful a priori voxel placement is critical to obtain minimally contaminated IMCL spectra, a requirement that can be challenging for inexperienced MRI technologists or in studies of overweight or obese subjects.
Figure 3.

Representative SV-MRS data of the TA muscle of a lean subject: (A) T1-weighted MR images showing voxels selected in calf muscle regions with (a) no visible intermuscular adipose tissue, (b) minimal visible adipose tissue, and (c) large amount of visible intermuscular adipose tissue. (B) Spectral data from voxels corresponding to those depicted in (A), consisting of resonances for IMCL (1.28 ppm), EMCL (1.50 ppm), and tCr (3.0 ppm). The spectra depicted in (a), (b) and (c) cover the range of spectral patterns observed in this study: (a) IMCL, resonance only, which was uncommon, (b) resolved IMCL and EMCL resonances, which was typical, and (c) a case of severe overlap of the IMCL resonance by that of EMCL.
1H MRSI
Figure 4 shows a 3 × 3 grid of voxels from the same lean subject as for single-voxel data shown in Fig. 3, although the total size of all nine MRSI voxels (1.98 cm3) was small enough to fit inside each of the SV-MRS voxels (2.25 cm3). Note that most of the MRSI voxels exhibit spectra with well-resolved IMCL and EMCL resonances, and IMCL amplitudes that are similar across voxels, whereas those of EMCL vary substantially from voxel to voxel. For this study, only MRSI voxels with well-separated IMCL and EMCL resonances were selected during processing for further analysis, a flexibility that is a distinct advantage of 1H MRSI over SV-MRS. In addition, the spectra reveal resonances for tCr and tCho.
Figure 4.

Representative 1H MRSI data of the same TA muscle as in Fig. 3, showing the spatial distribution of IMCL, EMC, and tCr in a 3 × 3 grid of voxels. Note well-resolved IMCL and EMCL resonances in most voxels, and substantial variations in the intensity of EMCL, whereas those of IMCL and tCr remain relatively constant spatially.
Reproducibility of repeated in vivo measurements of IMCL
Concentrations of TA muscle IMCL derived from duplicate MRS measurements on each subject, 3 days apart, were compared (Fig. 5). For SV-MRS, these repeated measures of IMCL correlated well, whether expressed relative to tCr (r =0.65, P <0.05; Fig. 5A) or to voxel tissue water (r =0.76, P <0.05). The duplicate measures of IMCL obtained by 1H MRSI for each subject (Fig. 5B) also correlated, but with a higher correlation coefficient (r =0.95, P <0.05) than for SV-MRS. The mean %CV for IMCL/tCr measured by MRSI was 10.7% for all subjects, 9.6% for lean subjects only, and 12.0% for overweight subjects only. The mean %CV for IMCL/tCr (or IMCL/W) measured by SV-MRS was considerably poorer: 24.4% (23.7%) for all subjects, 16.9% (16.1%) for lean subjects only, and 31.8% (31.3%) for overweight subjects only.
Figure 5.

Correlation of first vs second IMCL/tCr values measured by (A) SV-MRS and (B) MRSI for each of 10 subjects.
1H SV-MRS vs MRSI measures of IMCL
For individual subjects, the first and second measures of IMCL/tCr obtained by 1H SV-MRS and MRSI correlated with each other (r =0.51, P <0.05 for SV-MRS scan 1 vs MRSI scan 1; r =0.615, P <0.05 for SV-MRS scan 2 vs MRSI scan 2), as did the means of the duplicate measures [r =0.63, P <0.05 for mean SV-MRS (scans 1 and 2) vs mean MRSI (scans 1 and 2)].
IMCL concentrations in lean and overweight subjects
Values of IMCL/tCr obtained by 1H MRSI were significantly higher (P <0.05) in overweight subjects (8.3 ± 3.8) than in lean subjects (4.3 ± 2.4), whereas neither of the 1H SV-MRS measures of IMCL showed a significant difference (IMCL/tCr: 5.3 ± 2.8 vs 4.7 ± 2.0 for overweight and lean, respectively, P =0.70; IMCL/W: 0.040 ± 0.010 vs 0.034 ± 0.002 for overweight and lean, respectively, P =0.58). IMCL/tCr measured by 1H MRSI approached a positive correlation with BMI (r =0.592, P =0.07), whereas that measured by 1H SV-MRS did not (r =0.05, P =0.89).
DISCUSSION
This study shows that reproducible 1H SV-MRS and MRSI measurements of IMCL can be obtained from the human TA muscle at 1.5 T under conditions of controlled dietary caloric and fat intake, with MRSI providing better reproducibility than SV-MRS. We have demonstrated a well-tolerated, 7-day dietary plan that provides relatively stable amounts of total daily calories and fat. Such dietary control has the potential to significantly enhance the reliability of IMCL concentrations measured by 1H MRS, especially in longitudinal studies. A significant difference was found between IMCL/tCr measured by MRSI for the lean and overweight subjects, whereas SV-MRS failed to detect such a difference. This is probably due to the 10-fold higher spatial resolution (0.22 vs 2.25 cm3), and greater voxel selection flexibility of MRSI, which permit only IMCL spectra that are minimally contaminated by EMCL to be selected after acquisition for further analysis (21). The resulting higher-quality MRSI data are likely to be more sensitive to small differences in IMCL than data derived from spectra with poorly resolved IMCL and EMCL resonances, as can be the case for data derived from the larger SV-MRS voxels (e.g. Fig. 3B, ‘c’) (11,13,14,16).
Controlled dietary calorie and fat intake
Rather than providing the study participants with a predetermined diet of fixed calories and macro-nutrients that might not agree well with a subject’s customary food preferences, we implemented a sensible dietary control plan that tried to reconcile individual dietary preferences with maintenance of a constant daily total caloric intake. This approach has the advantage of supplying the subjects with calories from food sources that would result in more innate IMCL fluctuations and metabolism, as well as in a dietary plan that would ensure tolerance and, hence, compliance. A daily diet that is too different from that usually consumed has the potential to affect IMCL concentrations in ways that would simply reflect temporary systemic changes caused by changes in diet. In this study, we sought to avoid this potential confounding effect by developing a realistic diet plan based on individual selection of nutrients, with the only restriction being maintenance of total daily calories and fat intake. Although Decombaz et al. (22) implemented an analogous dietary record method, in which the subjects were asked to keep a 4-day dietary record, our method has further refined this approach by attempting to minimize large variations in the individual diet records.
Reproducibility of IMCL measurements
Although reproducibility studies of in vivo IMCL measurements by SV-MRS have been reported (10,23– 26), there have been no studies assessing the reproducibility of IMCL measurements by MRSI on a 1.5 T MR system, nor have there been reports comparing the reliability of these two techniques under carefully and sensibly controlled dietary caloric and fat intake. Boesch et al. (10) performed five successive SV-MRS measurements of IMCL in a single subject, identically repeated 1 week later, and reported a %CV of 6% for the TA muscle. Similarly, Szczepaniak et al. (26) derived coefficients of variation of 7.9–11.8%, and Krebs et al. (24) reported a within-subject %CVof 23.3% for the soleus muscle from consecutive scans. With time intervals ranging from 30 min to 3 days, Rico-Sanz et al. (25) reported a %CVof 13.6 ± 3.5%, and Torriani et al. (23) reported a %CV of 13.4–14.4% for the soleus muscle. Without explicitly stated time intervals, Hwang et al. (13) and Larson-Meyer et al. (14) reported %CVs of 13% for IMCL/W in TA muscle and 16.9% for IMCL/tCr in soleus muscle for MRSI studies conducted on a 4 T MR system. In general, these previous reproducibility studies followed one of two designs: (a) the time elapsed between consecutive IMCL measures was much less than 24 h; (b) the time elapsed between consecutive IMCL measures was 24 h or more. Depending on the study design, the reported %CVs would reflect variations due to either systematic instrumental and subject repositioning errors or a combination of physiological/metabolic IMCL fluctuations and systematic/repositioning errors. As our study followed design (b) above, it is likely that our %CVs for SV-MRS and MRSI measurements of IMCL include variations due to both systematic/repositioning errors and physiological fluctuations. Overall, there is fair agreement between %CVs for studies that used the same design. Not surprisingly, previous %CVs derived from same-day, consecutive duplicate IMCL measures were generally lower, because they contain little or no contributions from physiological fluctuations.
Our derived %CV for MRSI measurements of IMCL/tCr (10.7%) was about half that for our SV-MRS measurements (24.4%), which might be attributable to the higher spectral data quality that can be achieved by the higher spatial resolution and greater post-acquisition voxel selection flexibility of MRSI. It is also of interest to note that our %CV for IMCL/tCr, derived from MRSI measures obtained 3 days apart, compare favorably with previously reported SV-MRS %CVs derived from duplicate, same-day IMCL measures. This suggests that our dietary control of total caloric and fat intake may have minimized the contribution of physiological IMCL fluctuations in our derived value of %CV for 1H MRSI measures.
IMCL vs BMI in lean and overweight subjects
In this study, higher IMCL concentrations were found by MRSI in overweight subjects compared with lean subjects, which is in agreement with the study of Sinha et al. (27), but at odds with that of Perseghin et al. (28), who found no significant differences in IMCL concentrations between lean and overweight subjects. The discrepancy with the latter study might be due to differences in the definition of ‘overweight’. In ref. (28), it was defined on the basis of percentage total body fat, and not on the basis of BMI, as in our study. As we recently showed that BMI, rather than the percentage of total body fat, is a more reliable index of obesity-related health risks (29), it is likely that there was a great deal of overlap between the subjects who were considered overweight and lean (21.9 vs 20.1 kg/m2) in the study of Perseghin et al. (28), which might have masked potential IMCL differences.
The present study did not find a significant correlation between BMI and IMCL, although values of IMCL/tCr derived by the 1H MRSI approached significance (r =0.592, P =0.07). This is probably due to the limited sample size of our study, as well as to large variations in IMCL within our two study groups. Alternatively, IMCL might not correlate at all with BMI (30), as Virkamaki et al. (31) reported measuring different IMCL concentrations in subjects with similar BMI values. These conflicting observations suggest that obesity might be only one of a number of factors that affect IMCL concentrations.
Limitation and future directions
The small sample size of this study limits the generalizability of our results and suggests caution in extrapolating them to different study designs or paradigms. Future studies would need to look at a larger sample size as well as at muscles other than TA (e.g. the highly oxidative soleus muscle) and systemically investigate the variation in IMCL induced by diet, physical activity, and other physiological factors.
CONCLUSION
Reproducible in vivo measures of IMCL in the TA muscle have been obtained by 1H SV-MRS and MRSI under conditions of controlled dietary caloric and fat intake. In this study, values of IMCL obtained by 1H MRSI were found to be more sensitive to differences between overweight and lean subjects, as well as more reproducible than those derived by SV-MRS in terms of coefficient of variation and Pearson’s correlation coefficient. These results suggest that the higher spatial resolution and greater flexibility of 1H MRSI are advantageous for in vivo measurements of muscle IMCL concentrations. On the other hand, the shorter scan time, wider availability, and ease of implementation of SV-MRS are attractive features that make it a viable alternative. Despite the limited sample size, this study suggests the possibility of making reliable time-course 1H MRS measurements of IMCL through implementation of a dietary control approach that minimizes non-specific fluctuations in IMCL concentrations, while ensuring subject compliance and tolerance.
Acknowledgments
This work was supported by a ‘Pilot and Feasibility’ Award from St Luke’s-Roosevelt Hospital Center (to D.C.S.), and by Cornell University Faculty Development Funds (D.C.S.).
Contract/grant sponsors: St Luke’s-Roosevelt Hospital Center; Cornell University Faculty Development Funds.
Abbreviations used
- BMI
body mass index
- CV
coefficient of variation
- EMCL
extramyocellular lipid
- IMCL
intramyocellular lipid
- MRSI
magnetic resonance spectroscopic imaging
- SV-MRS
single-voxel 1H MRS
- TA
tibialis anterior
- tCho
total choline
- tCr
total creatine
- W
internal water
References
- 1.Greco AV, Mingrone G, Giancaterini A, Manco M, Morroni M, Cinti S, Granzotto M, Vettor R, Camastra S, Ferrannini E. Insulin resistance in morbid obesity: reversal with intramyocellular fat depletion. Diabetes. 2002;51:144–51. doi: 10.2337/diabetes.51.1.144. [DOI] [PubMed] [Google Scholar]
- 2.Jacob S, Machann J, Rett K, Brechtel K, Volk A, Renn W, Maerker E, Matthaei S, Schick F, Claussen CD, Haring HU. Association of increased intramyocellular lipid content with insulin resistance in lean nondiabetic offspring of type 2 diabetic subjects. Diabetes. 1999;48:1113–9. doi: 10.2337/diabetes.48.5.1113. [DOI] [PubMed] [Google Scholar]
- 3.Weiss R, Dufour S, Groszmann A, Petersen K, Dziura J, Taksali SE, Shulman G, Caprio S. Low adiponectin levels in adolescent obesity: a marker of increased intramyocellular lipid accumulation. J Clin Endocrinol Metab. 2003;88:2014–8. doi: 10.1210/jc.2002-021711. [DOI] [PubMed] [Google Scholar]
- 4.Misra A, Sinha S, Kumar M, Jagannathan NR, Pandey RM. Proton magnetic resonance spectroscopy study of soleus muscle in non-obese healthy and Type 2 diabetic Asian Northern Indian males: high intramyocellular lipid content correlates with excess body fat and abdominal obesity. Diabet Med. 2003;20:361–7. doi: 10.1046/j.1464-5491.2003.00932.x. [DOI] [PubMed] [Google Scholar]
- 5.Pan AD, Lillioja S, Kriketos AD, Milner MR, Baur LA, Bogardus C, Jenkins AB, Storlien LH. Skeletal muscle triglyceride levels are inversely related to insulin action. Diabetes. 1997;46:983–8. doi: 10.2337/diab.46.6.983. [DOI] [PubMed] [Google Scholar]
- 6.Phillips DI, Caddy S, Ilic V, Fielding BA, Frayn KN, Borthwick AC, Taylor R. Intramuscular triglyceride and muscle insulin sensitivity: evidence for a relationship in nondiabetic subjects. Metabolism. 1996;45:947–50. doi: 10.1016/s0026-0495(96)90260-7. [DOI] [PubMed] [Google Scholar]
- 7.Boesch C, Kreis R. Observation of intramyocellular lipids by 1H-magnetic resonance spectroscopy. Ann N Y Acad Sci. 2000;904:25–31. [PubMed] [Google Scholar]
- 8.Boden G, Lebed B, Schatz M, Homko C, Lemieux S. Effects of acute changes of plasma free fatty acids on intramyocellular fat content and insulin resistance in healthy subjects. Diabetes. 2001;50:1612–7. doi: 10.2337/diabetes.50.7.1612. [DOI] [PubMed] [Google Scholar]
- 9.Krssak M, Petersen KF, Dresner A, DiPietro L, Vogel SM, Rothman DL, Roden M, Shulman GI. Intramyocellular lipid concentrations are correlated with insulin sensitivity in humans: a 1H NMR spectroscopy study. Diabetologia. 1999;42:113–6. doi: 10.1007/s001250051123. [DOI] [PubMed] [Google Scholar]
- 10.Boesch C, Slotboom J, Hoppeler H, Kreis R. In vivo determination of intra-myocellular lipids in human muscle by means of localized 1H-MR-spectroscopy. Magn Reson Med. 1997;37:484–93. doi: 10.1002/mrm.1910370403. [DOI] [PubMed] [Google Scholar]
- 11.Dong Z, Hwang JH. Lipid signal extraction by SLIM: application to 1H MR spectroscopic imaging of human calf muscles. Magn Reson Med. 2006;55:1447–53. doi: 10.1002/mrm.20895. [DOI] [PubMed] [Google Scholar]
- 12.Howald H, Boesch C, Kreis R, Matter S, Billeter R, Essen-Gustavsson B, Hoppeler H. Content of intramyocellular lipids derived by electron microscopy, biochemical assays, and (1)H-MR spectroscopy. J Appl Physiol. 2002;92:2264–72. doi: 10.1152/japplphysiol.01174.2001. [DOI] [PubMed] [Google Scholar]
- 13.Hwang JH, Pan JW, Heydari S, Hetherington HP, Stein DT. Regional differences in intramyocellular lipids in humans observed by in vivo1H-MR spectroscopic imaging. J Appl Physiol. 2001;90:1267–74. doi: 10.1152/jappl.2001.90.4.1267. [DOI] [PubMed] [Google Scholar]
- 14.Larson-Meyer DE, Newcomer BR, Hunter GR. Influence of endurance running and recovery diet on intramyocellular lipid content in women: a 1H NMR study. Am J Physiol Endocrinol Metab. 2002;282:E95–E106. doi: 10.1152/ajpendo.2002.282.1.E95. [DOI] [PubMed] [Google Scholar]
- 15.Schick F, Eismann B, Jung WI, Bongers H, Bunse M, Lutz O. Comparison of localized proton NMR signals of skeletal muscle and fat tissue in vivo: two lipid compartments in muscle tissue. Magn Reson Med. 1993;29:158–67. doi: 10.1002/mrm.1910290203. [DOI] [PubMed] [Google Scholar]
- 16.Vermathen P, Kreis R, Boesch C. Distribution of intramyocellular lipids in human calf muscles as determined by MR spectroscopic imaging. Magn Reson Med. 2004;51:253–62. doi: 10.1002/mrm.10721. [DOI] [PubMed] [Google Scholar]
- 17.Tiikkainen M, Bergholm R, Vehkavaara S, Rissanen A, Hakkinen AM, Tamminen M, Teramo K, Yki-Jarvinen H. Effects of identical weight loss on body composition and features of insulin resistance in obese women with high and low liver fat content. Diabetes. 2003;52:701–7. doi: 10.2337/diabetes.52.3.701. [DOI] [PubMed] [Google Scholar]
- 18.Decombaz J, MMF, Hoppeler H, Kreis R, Boesch C. Effect of diet on the replenishment of intramyocellular lipids after exercise. Eur J Nutr. 2000;39:244–7. doi: 10.1007/s003940070002. [DOI] [PubMed] [Google Scholar]
- 19.Schrauwen-Hinderling VB, Schrauwen P, Hesselink MK, van Engelshoven JM, Nicolay K, Saris WH, Kessels AG, Kooi ME. The increase in intramyocellular lipid content is a very early response to training. J Clin Endocrinol Metab. 2003;88:1610–6. doi: 10.1210/jc.2002-021464. [DOI] [PubMed] [Google Scholar]
- 20.Schwartz RS, Shuman WP, Larson V, Cain KC, Fellingham GW, Beard JC, Kahn SE, Stratton JR, Cerqueira MD, Abrass IB. The effect of intensive endurance exercise training on body fat distribution in young and older men. Metabolism. 1991;40:545–51. doi: 10.1016/0026-0495(91)90239-s. [DOI] [PubMed] [Google Scholar]
- 21.Shen W, Mao L, Wang Z, Punyanitya M, Heymsfield SB, Shungu DC. Measurement of intramyocellular lipid levels by 2D magnetic resonance spectroscopic imaging at 1.5 T. Acta Diabetol. 2003;40:S51–4. doi: 10.1007/s00592-003-0026-x. [DOI] [PMC free article] [PubMed] [Google Scholar]
- 22.Decombaz J, Schmitt B, Ith M, Decarli B, Diem P, Kreis R, Hoppeler H, Boesch C. Postexercise fat intake repletes intramyocellular lipids but no faster in trained than in sedentary subjects. Am J Physiol Regul Integr Comp Physiol. 2001;281:R760–9. doi: 10.1152/ajpregu.2001.281.3.R760. [DOI] [PubMed] [Google Scholar]
- 23.Torriani M, Thomas BJ, Halpern EF, Jensen ME, Rosenthal DI, Palmer WE. Intramyocellular lipid quantification: repeatability with 1H MR spectroscopy. Radiology. 2005;236:609–14. doi: 10.1148/radiol.2362041661. [DOI] [PubMed] [Google Scholar]
- 24.Krebs M, Krssak M, Nowotny P, Weghuber D, Gruber S, Mlynarik V, Bischof M, Stingl H, Furnsinn C, Waldhausl W, Roden M. Free fatty acids inhibit the glucose-stimulated increase of intramuscular glucose-6-phosphate concentration in humans. J Clin Endocrinol Metab. 2001;86:2153–60. doi: 10.1210/jcem.86.5.7488. [DOI] [PubMed] [Google Scholar]
- 25.Rico-Sanz J, Hajnal JV, Thomas EL, Mierisova S, Ala-Korpela M, JDJDB Intracellular and extracellular skeletal muscle triglyceride metabolism during alternating intensity exercise in humans. J Physiol. 1998;510:15–22. doi: 10.1111/j.1469-7793.1998.615bk.x. [DOI] [PMC free article] [PubMed] [Google Scholar]
- 26.Szczepaniak LS, Babcock EE, Schick F, Dobbins RL, Garg A, Burns DK, McGarry JD, Stein DT. Measurement of intracellular triglyceride stores by H spectroscopy: validation in vivo. Am J Physiol. 1999;276:E977–89. doi: 10.1152/ajpendo.1999.276.5.E977. [DOI] [PubMed] [Google Scholar]
- 27.Sinha R, Dufour S, Petersen KF, LeBon V, Enoksson S, Ma YZ, Savoye M, Rothman DL, Shulman GI, Caprio S. Assessment of skeletal muscle triglyceride content by (1)H nuclear magnetic resonance spectroscopy in lean and obese adolescents: relationships to insulin sensitivity, total body fat, and central adiposity. Diabetes. 2002;51:1022–7. doi: 10.2337/diabetes.51.4.1022. [DOI] [PubMed] [Google Scholar]
- 28.Perseghin G, Scifo P, Danna M, Battezzati A, Benedini S, Meneghini E, Maschio AD, Luzi L. Normal insulin sensitivity and IMCL content in overweight humans are associated with higher fasting lipid oxidation. Am J Physiol Endocrinol Metab. 2002;283:E556–64. doi: 10.1152/ajpendo.00127.2002. [DOI] [PubMed] [Google Scholar]
- 29.Shen W, Punyanitya M, Chen J, Gallagher D, Albu J, Pi-Sunyer X, Lewis CE, Grunfeld C, Heshka S, Heymsfield SB. Waist circumference correlates with metabolic syndrome indicators better than percentage fat. Obes Res. 2006;14:727–36. doi: 10.1038/oby.2006.83. [DOI] [PMC free article] [PubMed] [Google Scholar]
- 30.Levin K, Daa Schroeder H, Alford FP, Beck-Nielsen H. Morphometric documentation of abnormal intramyocellular fat storage and reduced glycogen in obese patients with Type II diabetes. Diabetologia. 2001;44:824–33. doi: 10.1007/s001250100545. [DOI] [PubMed] [Google Scholar]
- 31.Virkamaki A, Korsheninnikova E, Seppala-Lindroos A, Vehkavaara S, Goto T, Halavaara J, Hakkinen AM, Yki-Jarvinen H. Intramyocellular lipid is associated with resistance to in vivo insulin actions on glucose uptake, antilipolysis, and early insulin signaling pathways in human skeletal muscle. Diabetes. 2001;50:2337–43. doi: 10.2337/diabetes.50.10.2337. [DOI] [PubMed] [Google Scholar]