Abstract
We have designed a multi-pinhole collimator for a dual-headed, stationary SPECT system that incorporates high-resolution silicon double-sided strip detectors. The compact camera design of our system enables imaging at source–collimator distances between 20 and 30 mm. Our analytical calculations show that using knife-edge pinholes with small-opening angles or cylindrically shaped pinholes in a focused, multi-pinhole configuration in combination with this camera geometry can generate narrow sensitivity profiles across the field of view that can be useful for imaging small objects at high sensitivity and resolution. The current prototype system uses two collimators each containing 127 cylindrically shaped pinholes that are focused toward a target volume. Our goal is imaging objects such as a mouse brain, which could find potential applications in molecular imaging.
1. Introduction
Pinhole collimators are widely used for SPECT imaging of small animals (Beekman et al 2005, Furenlid et al 2004, Ishizu et al 1995, Jaszczak et al 1994, Moore et al 1991, Ogawa et al 1998, Strand et al 1994, Song et al 2003, Weber et al 1994). A number of pinhole studies were focused on the characterization of the pinhole sensitivity, resolution and point response function (PRF) (Accorsi and Metzler 2004, Bal and Acton 2006, Metzler et al 2001, 2002). The PRF is extremely useful in the accurate modeling of pinhole collimators for SPECT image reconstruction. Other studies described methods for design optimization of multi-pinhole parameters such as their number, diameter and magnification (Mok et al 2005, Rentmeester et al 2007, Cao et al 2005). Higher projection magnification and pinhole density can increase the overlap of pinhole projections, known as multiplexing, which reduces the accuracy of the information about the photon trajectories. Highly multiplexed projections with very dense pinhole distribution require some type of decoding process and are commonly referred to as coded apertures (Garibaldi et al 2005, Accorsi et al 2008). Another way of reducing the problem with multi-pinhole projection overlap is to obtain projections at a number of pinhole-detector distances (Wilson et al 2000). Since the amount of projection overlap varies as a function of this distance, the data contain information on how the projections are multiplexed. We have followed this approach, known as synthetic collimation, and incorporated dual magnification acquisitions into our SPECT imaging system.
In this work we introduce a new multi-pinhole collimator system for our silicon detector system, which we refer to as SiliSPECT. We will present the basic design characteristics of this collimator system that can be used for imaging small objects (10–15 mm in diameter). We are targeting potential applications where the volume of interest is small and high spatial resolution and sensitivity are required, such as the mouse brain. Our approach is based on restricting the region viewed by pinholes to a small volume. This can be achieved through a number of characteristics such as the minimization of the pinhole acceptance angle by using knife-edge pinholes with small opening angles or cylindrically shaped pinholes. We implemented a new analytical derivation to calculate the geometric sensitivity and PRF of these types of pinholes.
The analytic formulas derived in this paper assume no significant gamma ray penetration. This ideal assumption is only valid for low-energy gamma rays from isotopes such as 125I and using pinholes with small opening angles. One of the main objectives in this study is to show how the shape of the pinhole can change the geometric pinhole perimeter and consequently its geometric sensitivity and PRF. Using this new geometrical model is particularly important for imaging systems with compact camera geometries where objects are imaged at close distances using pinholes with small opening angles.
We are placing a large number of pinholes on the collimator tilted toward a common spot to achieve high sensitivity from the target volume. Using the new derivation, we will show that the pinhole opening angle and the collimator thickness can be modified to change the width of the sensitivity profile across the field of view and adjust it to the object size. Our current collimator system incorporates 127 cylindrically shaped pinholes that are laser-drilled through a tungsten plate of 250 µm thickness. The high intrinsic spatial resolution of SiliSPECT together with our specific selection of imaging task and the incorporation of synthetic collimation have enabled a denser distribution of pinholes because the projection multiplexing can be significantly reduced and corrected.
2. Methods
2.1. SiliSPECT, a high resolution SPECT system for low-energy gamma-ray imaging
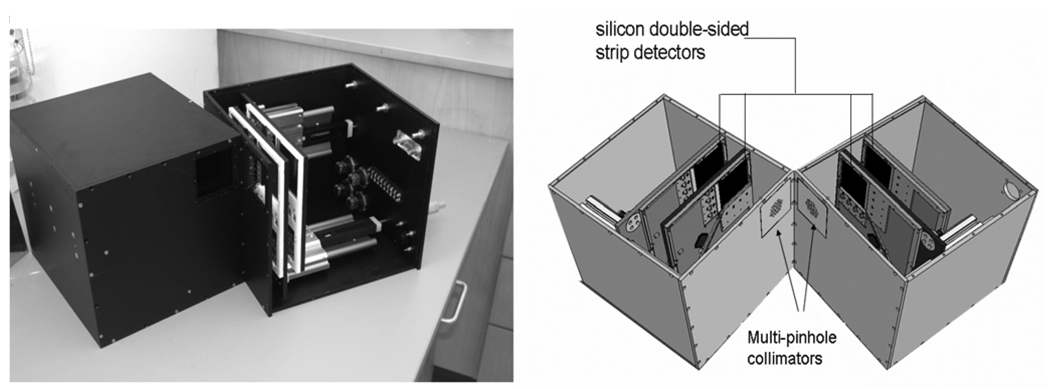
In this section we briefly describe the SiliSPECT system (figure 1). SiliSPECT is a dual-headed, stationary SPECT system. The imaging system utilizes four silicon double-sided strip detectors (DSSDs), that are pairwise stacked in each camera head for simultaneous acquisition at dual magnification. Each silicon detector is 1.0 mm thick and has a 60.4 mm × 60.4 mm active area. Its surface on each side is divided into 1024 strips to collect electron–hole pairs produced through photon interactions. The strips on one side are orthogonal to those on the other side to provide the 2D coordinates of the interaction position. The strip pitch is 59 µm on both sides. This produces 1048 576 virtual resolution elements (59 µm × 59 µm). Using an 125I source we verified experimentally that for energies around 30 keV the intrinsic spatial resolution of the silicon DSSD is the same as its strip pitch (Shokouhi et al 2007b).
Figure 1.
Left: photographic image of SiliSPECT (Peterson et al 2005, Shokouhi et al 2007a), a dual-headed small-animal SPECT that is under construction. Right: schematic design of SiliSPECT. The double-sided strip detectors are pairwise stacked on each camera head. The distance and angle between the camera heads can be modified. The simulation studies in this work were performed with the camera configuration equivalent to the geometry described in figure 14.
2.2. Multi-pinhole approach for SiliSPECT
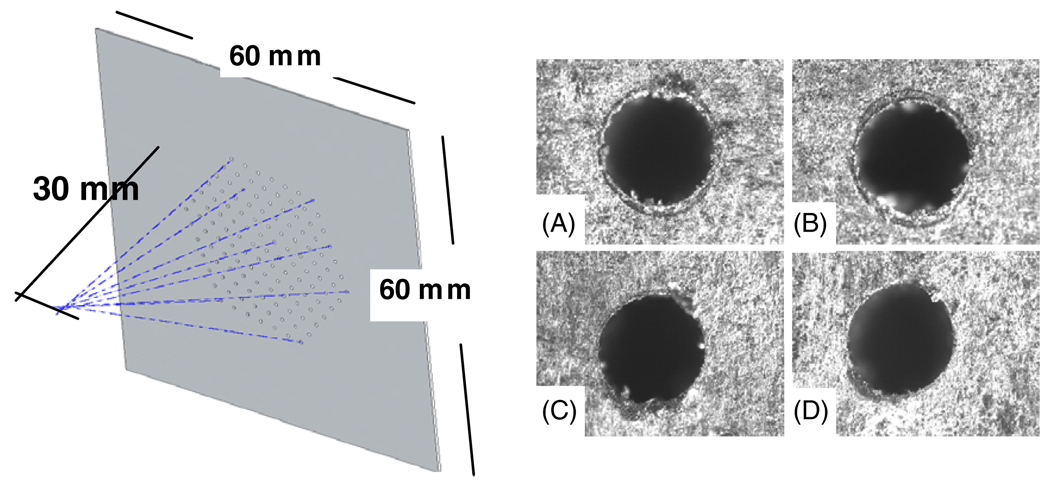
With high-resolution detectors such as silicon DSSDs the advantage of using multi-pinholes is the increased sensitivity and angular sampling that comes about because of the larger number of pinholes that can be accommodated when little magnification is required. A pair of multi-pinhole collimators was manufactured, and served as prototype models. Each collimator is made of a 250 µm tungsten layer with 127 cylindrically shaped pinholes laser drilled through. The pinholes are packed in a hexagonal configuration, with an average center-to-center spacing between the pinholes of 2.5 mm. The selection of 127 pinholes was based on the number of pinholes that could fit in a hexagonal configuration of multiple concentric rings. We selected the number of these concentric hexagonal rings in a way that the projection images on the back detectors were not significantly truncated. A slight jitter (RMS = 0.4 mm) was added randomly to spacing between individual pinholes. The justification for the random jitter in the pinhole spacing is given by the double-sided strip geometry of the silicon detectors (Shokouhi et al 2007b). Using the random jitter, we avoid aligning multiple pinholes along a single detector strip that can be possibly dead or noisy, and also removing potential aliasing effects from sampling at a given set frequency. The pinhole diameter is 250µm. All of the pinholes are tilted toward a common focal point at a distance of 30 mm away from the collimator plate (figure 2). In most small-animal SPECT systems the pinhole parameters and geometry are adjusted in a way that a more uniform sensitivity across the object, typically the whole animal body, can be achieved. With our proposed pinhole design we aim to increase the sensitivity in a region ≤10 mm in diameter while intending to reduce the sensitivity to background radiation from outside of this region. The quality of the machining depends on the ratio of the collimator thickness to the pinhole diameter. Pinholes with low tilting angle that are located in the center of the collimator can be assumed to be parallel (cylindrical shape), whereas pinholes with larger tilting angles (up to 26°) might have a slight conical shape from the entry of the laser beam due to the increased ratio of the collimator thickness to the pinhole diameter. More geometric precision can be achieved by using more costly techniques such as Tomo Lithographic molding. Cylindrical pinholes can be considered as channelized pinholes with a full acceptance angle of π or as knife-edge pinholes of no opening angle. Typical knife-edge pinholes have opening angles of 45° or more, allowing large angles of photon incidence on the detector surface. The opening angle defines the acceptance angle of a pinhole, which determines the diameter of the field viewed by the pinhole at a given distance between the object and the collimator.
Figure 2.
Left: schematic of the prototype multi-pinhole collimator. All pinholes are tilted toward a common focal point at 30 mm distance. Right: microscopic photographs of laser drilled pinholes, A is a center pinhole viewed from the front side (with respect to the object), B is an edge pinhole (large tilting angle) viewed from the front side, C is center pinhole viewed from the back side and D is an edge pinhole viewed from the back side.
Using this multi-pinhole configuration, in our acquisition geometry the projection multiplexing should be considered differently than the conventional multi-pinhole acquisition where only one detector is placed behind the collimator. Using stacked detector geometry, we are able to implement the concept of synthetic collimation by acquiring the projection images of the front detector with a different magnification than the back detector. Since the amount of the projection overlap varies at the two detectors, the data contain information on how the projections are multiplexed and on how to remove the multiplexing effect (Wilson et al 2000). We previously implemented this concept and were able to reconstruct 3D images from experimental phantoms using an older model of our detector (Peterson et al 2005). The significance of using high-resolution detectors for synthetic collimation is the ability of acquiring the projections on the front detector with minimum magnification and multiplexing while acquiring projection images at back detector at higher magnification to perform image reconstruction without loss of resolution. Based on this multi-pinhole configuration, other geometrical parameters such as the angle and distance between the two camera heads and the way the mouse is positioned between them could be modified to reduce the amount of detected background activity. We are also considering designing animal holders with lead blocks to shield the animal’s body and expose the head only. However, these will be part of our future studies that will be accompanied by experimental animal studies to investigate the contribution of the background activity to the projection images.
2.3. Geometric pinhole sensitivity
The sensitivity of a knife-edge pinhole is given by the sum of its geometric and penetrative components (Metzler et al 2001). The fraction of penetrated gamma radiation along the edge of the pinhole can be reduced by decreasing the pinhole opening angle α (Anger 1967, Williams et al 2003). For low energies, the sensitivity and resolution of pinholes with very small opening angle is dominated by the geometric component since the penetration, which is considered as one of the fundamental factors limiting the resolution, becomes smaller. Using Metzler’s formulation (Metzler et al 2001) at low energy imaging with 125I, the fraction of penetrated photons through pinholes with opening angles smaller than 10° (collimator material: 250 µm tungsten) was estimated to be less than 1% of the total photon transmission through the pinhole. Therefore, accurate formulation of the geometric pinhole characteristics such as the geometric sensitivity, resolution and PRF is indispensable for accurate image reconstruction. The conventional formulation of the geometric sensitivity (Sgeom) of a pinhole, also known as geometric detection efficiency is given by equation (1). It takes into account that the solid angle subtended by the aperture at the point source position decreases as the aperture is viewed at an increasingly oblique angle (θ):
| (1) |
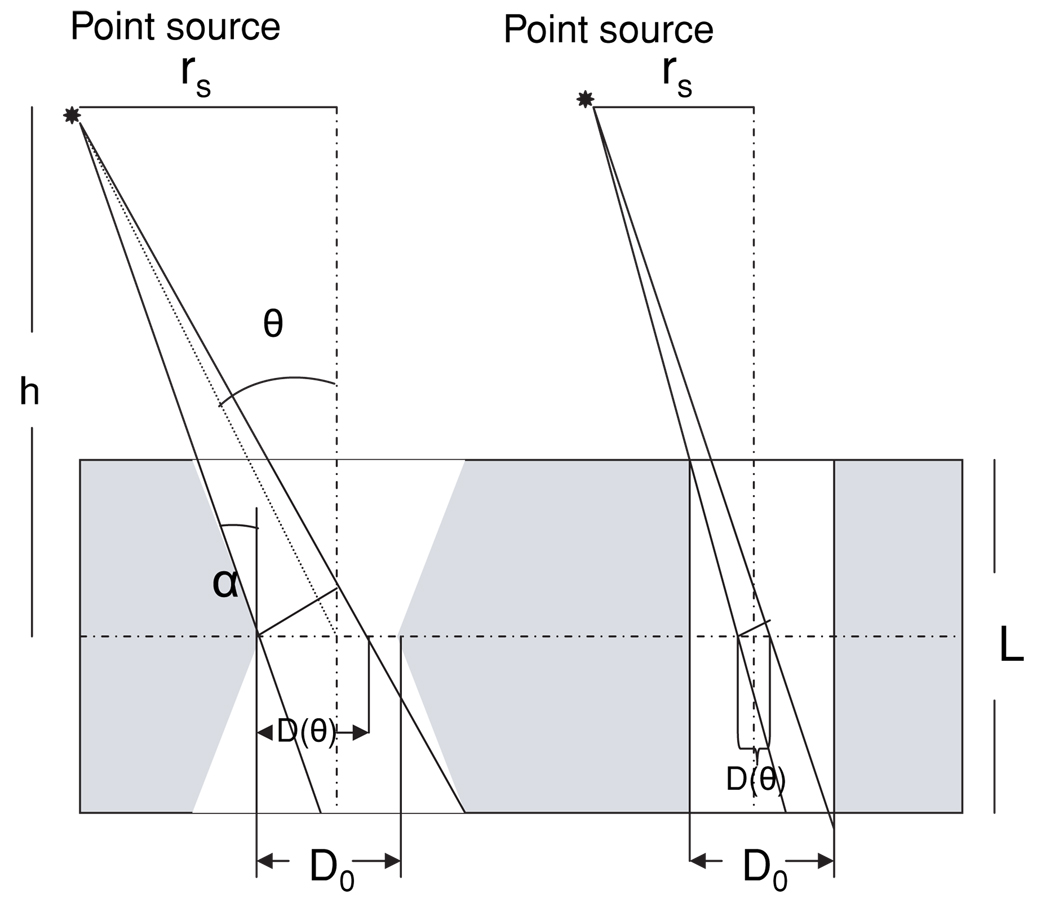
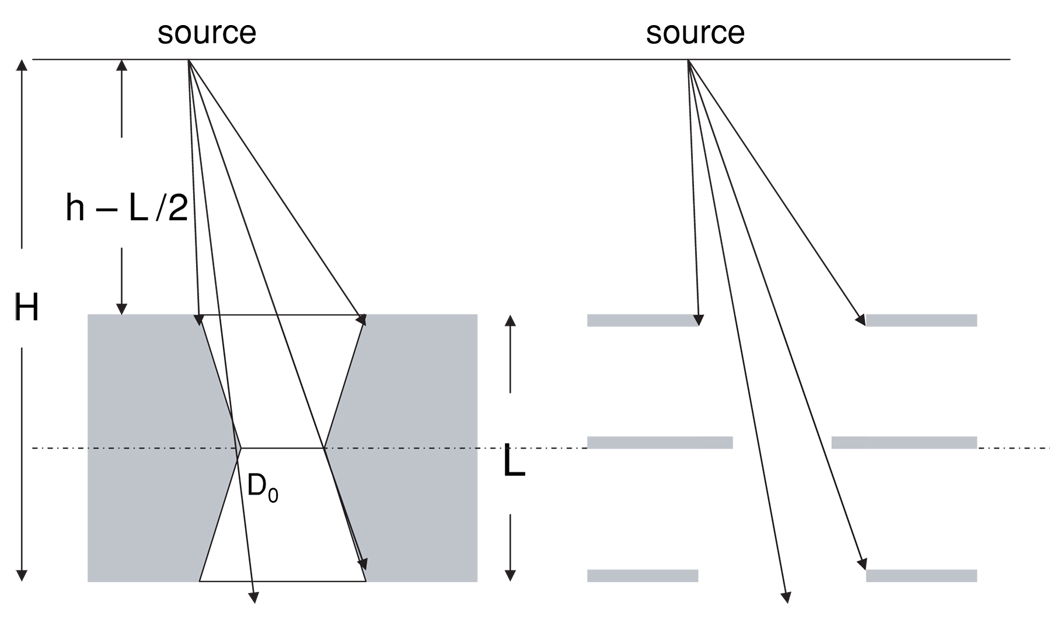
where h is the distance of the point source from the center of the pinhole on the vertical pinhole axis, θ is the angle between the vertical pinhole axis and the line between the center of the pinhole and the source location (figure 3) and D0 is the physical pinhole diameter. This equation is for an ideal pinhole with a collimator thickness of L = 0, which is a good assumption for most imaging applications where the distance between the source and aperture is much larger than the collimator thickness. In this model the geometric pinhole diameter remains constant at increasingly oblique angles. This makes the geometric pinhole perimeter (Ageom) a circle with the diameter D0. The obtained PRF from the geometric photons (PRFgeom) on a parallel imaging plane will also have a circular shape at any oblique angleθ. This model does not include the impact of the pinhole opening angle and the collimator thickness on Ageom. Nevertheless, it satisfies most imaging geometries, where h ≫ D0 with typical knife-edge pinholes of α (half opening angle) larger than 45°. However, at short source–collimator distances, such as 20–30 mm in our application, the pinhole opening angle and collimator thickness can significantly change the unshadowed geometric pinhole diameter as a function of θ (figures 3, 4). This will subsequently change the shape of Ageom, the geometric sensitivity (Sgeom) and the PRFgeom as a function ofθ. An analytical derivation of geometric PRF and angle-dependent geometric detection efficiency for pinhole collimators with keel-edge apertures was presented previously (Wang et al 2004). A general derivation of Ageom for cylindrically shaped pinholes was described by Barrett and Swindell (1981). In the following two sub-sections we will extend this formulation to derive a more accurate geometric model for knife-edge pinholes with small opening angle and cylindrically shaped pinholes to obtain Ageom, and to define a term for geometric sensitivity that includes the parameters of the pinhole geometry such as opening angle and the collimator thickness. Using this model, sensitivity profiles across the field of view will be calculated for these pinholes at different parameters such as opening angle and collimator thickness.
Figure 3.
Schematic of a knife-edge pinhole with small opening angle α and a cylindrically shaped pinhole. D0 is the physical pinhole diameter and D(θ) is the geometric pinhole diameter viewed by a point source at θ. The diagonal lines in the figure indicate the acceptance range of the photon trajectories limited by the shape of the pinhole, making D(θ) smaller than D0.
Figure 4.
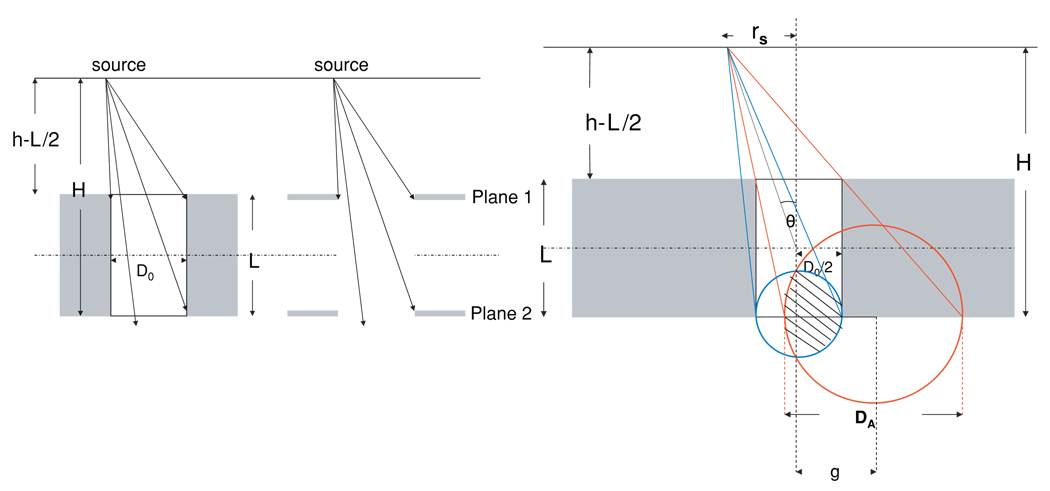
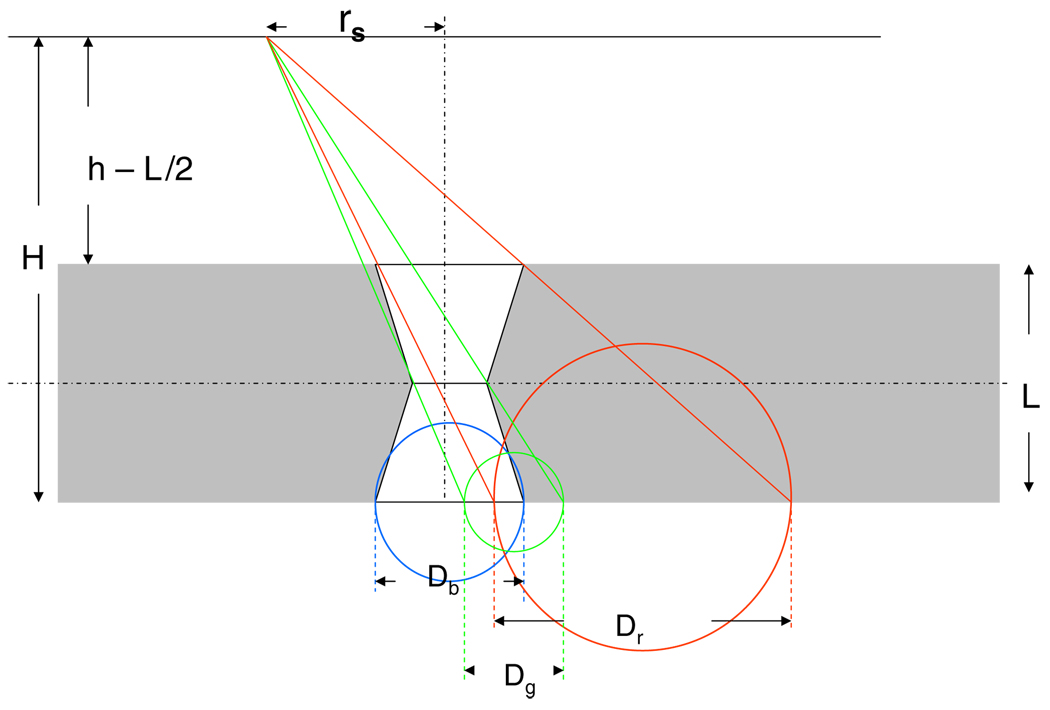
Left: geometric equivalence between a cylindrically shaped pinhole and two hypothetical planes. Right: illustration of Ageom as the overlap between two circles of the lower and upper aperture projected from source point at distance H.
2.3.1. Cylindrically shaped pinholes
The geometry of cylindrically shaped pinholes can be defined by their physical diameter (D0), the collimator thickness (L), the vertical distance between the source and the front plane of the collimator (h − L/2) and the vertical distance between the source and backplane of the collimator (H = h + L/2). This geometry is equivalent to a hypothetical pair of planes, absolutely opaque to gamma rays at distances h − L/2 and H from the source (figure 4). With this equivalence the aperture on each of the two planes will have a circular Ageom. The larger circle (color red in figure 4) represents the upper aperture as projected from the source point onto the lower aperture. The Ageom of the cylindrically shaped pinhole can be written as the intersection between these two circles at a distance H from the point source. rs is the distance between the point source and the vertical pinhole axis. g is the distance between the center of the two circles. R is the radius of the circle projected from the upper aperture and r is the radius of the lower aperture. The intersection area is an asymmetric lens constructed by two circle segments, and is calculated (Mathworld reference):
| (2) |
| (3) |
Equation (2) should be used for g > 0. For g = 0, at θ = 0, the intersection is given by the entire area of the blue circle. Figure 9 shows the simulation (MCNP5) of a point source projected through a cylindrically shaped pinhole at increasingly oblique angle of incidence. The geometric pinhole sensitivity obtained with this new model is given by
| (4) |
Figure 9.
Projection of simulated point source through cylindrically shaped pinhole diameter changing from a circle at θ =0 to an asymmetric lens by moving the point source to θ = 25.5°, 36.8°, 39.8°.
This equation gives the fraction of photons that pass through the geometric aperture of the pinhole with the perimeter Ageom to the total number of photons emitted from a hypothetical surface of a sphere 4πH2 with the point source in the middle and a radius H, which is the distance between the source and the back plane of the collimator.
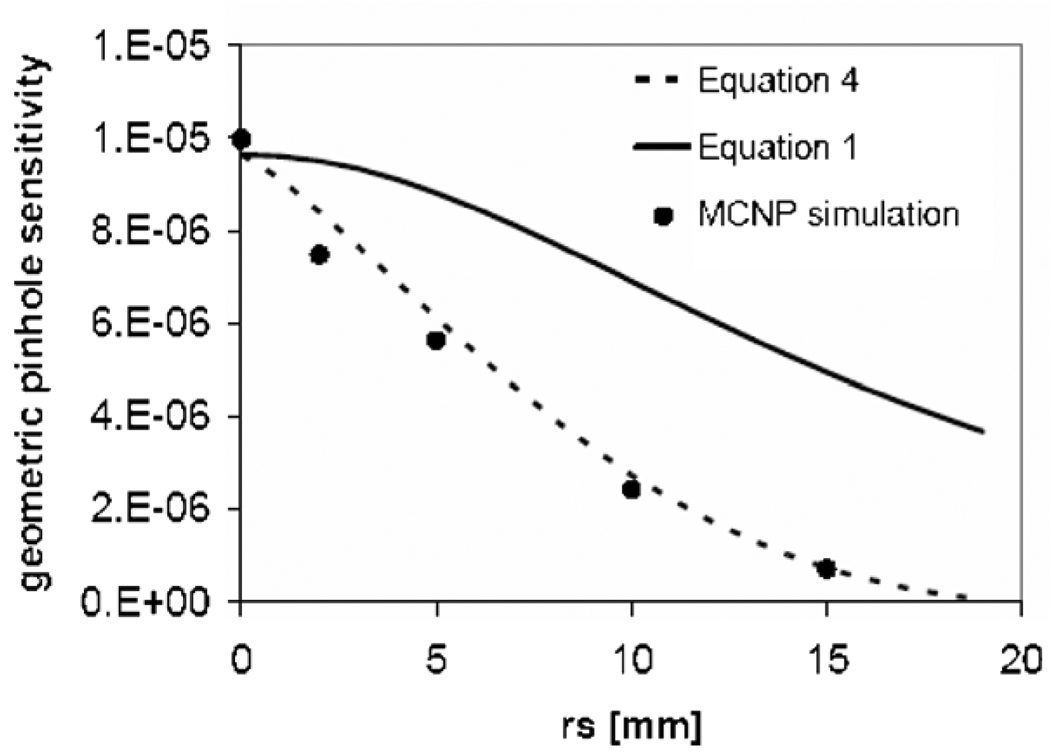
A comparison between Sgeom from equation (1) and from equation (4) at a source–aperture distance of 20 mm is shown in figure 10. These were compared to the profile obtained from a point source placed at 20 mm distance from the collimator center in aMCNP5 simulation. The collimator material (tungsten) in the simulation was modeled by defining its density (19.25 g cm−3) and atomic number (Z = 74). The Monte Carlo simulation process includes both penetrative and geometric components. However, one can separate the geometric photons from the penetrative photons by keep track of the photons through different surfaces in the collimator, and disregarding those photons entering any surface that borders the collimator cell. Only the geometric component of the simulation was used to compare with analytically calculated geometric sensitivity (figures 10 and 11).
Figure 10.
Geometric sensitivity profiles for a cylindrically shaped pinhole (D0 = 250 µm, L = 250 µm) calculated from equation (1) (solid line), equation (4) (dashed line) and MCNP simulation at h = 20 mm.
Figure 11.
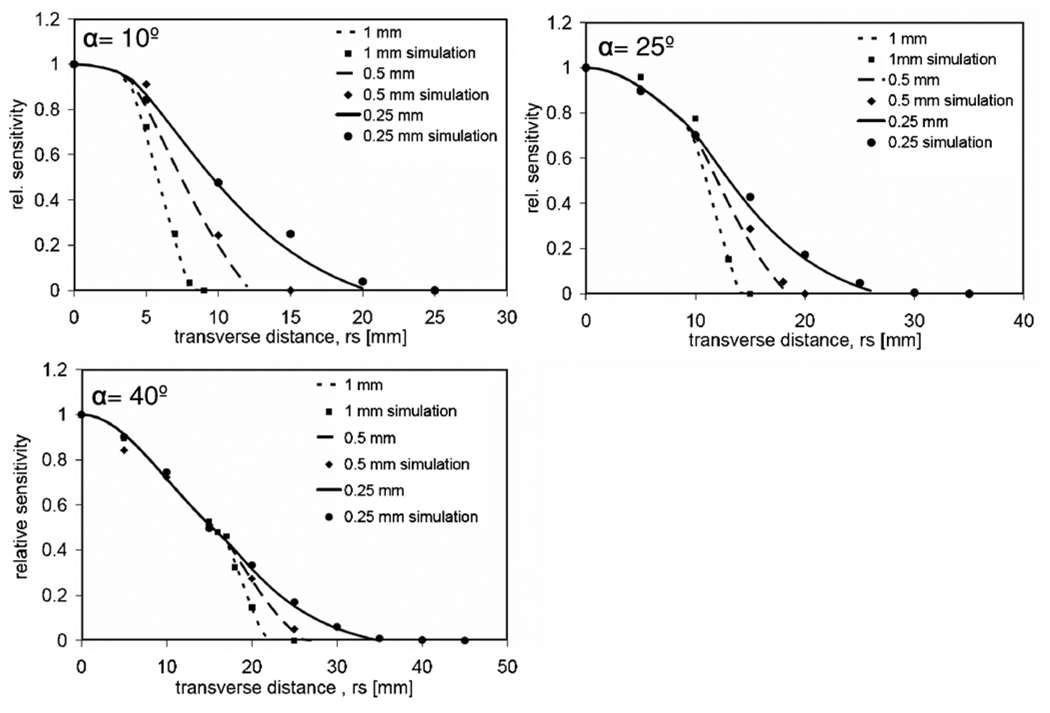
Geometric sensitivity profiles of a knife-edge pinhole with respect to the pinhole opening angle (10°, 25°, 40°) and collimator thickness (0.25 mm, 0.5 mm, 1 mm) at 20 mm source–aperture distance.
2.3.2. Sensitivity of knife-edge pinholes with small opening angles
The geometry of a knife-edge pinhole was compared to three hypothetical planes at distances h − L/2, h and H = h + L/2 from the source (figure 5). Using this geometric equivalence, the photon trajectory through the middle aperture is increasingly obstructed by the lower and the upper aperture as the point source moves away from the vertical pinhole axis. Ageom can be obtained from the overlap of three circles from the upper, lower and middle aperture at H (figure 6). The aperture in the middle has the diameter D0. The diameters of the upper and lower apertures are given by
| (5) |
Figure 5.
Geometric similarity between a knife-edge pinhole and three hypothetical planes was used to derive a new analytical model for Ageom and Sgeom.
Figure 6.
Geometry of the photon trajectory and the intersection of the circles from lower, upper and middle apertures. Dg is the diameter of the middle aperture projected from the source point onto the back plane of the collimator at distance H from source (green circle), Db is the diameter of the lower aperture (blue circle) at H and Dr is the diameter of the upper aperture that is projected from the source point onto the back plane of the collimator (red circle) at distance H.
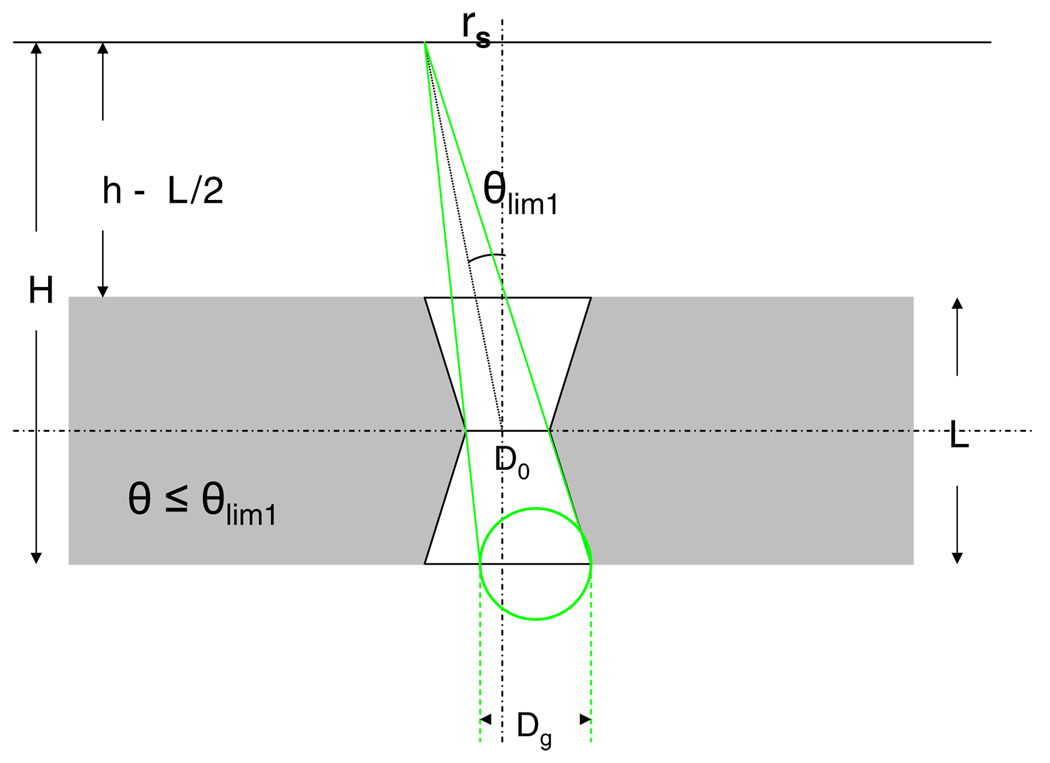
The calculation of the intersected area takes place in three different phases as the angle θ increases. At θ ≤ θlim 1 (figure 7), the geometric photon flux through the middle aperture is still not obstructed by the lower and the upper apertures. In this phase the intersected area is given by the entire perimeter of the middle aperture. Ageom is a circle, and its perimeter at H is given by the middle aperture as projected from the source point onto the back plane of the collimator (green circle in figure 7). θlim 1 is given by
| (6) |
Figure 7.
Geometry of the photon trajectory at θ ≤ θlim 1.
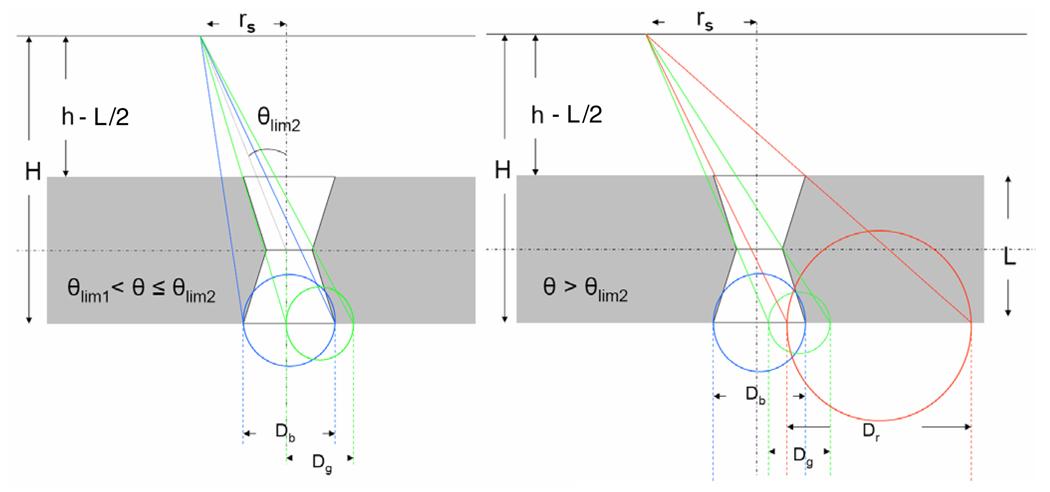
For θlim 1 < θ ≤ θlim 2 the photon trajectories through the middle aperture are obstructed only by the lower aperture (lower edges of the pinholes in figure 8). Ageom can be obtained at H from the overlap of the circle of the middle aperture (green) projected at H and the lower aperture using equation (2). At θ > θlim 2 the photon trajectory through the middle aperture is obstructed by both the lower and the upper aperture. θlim 2 is given by
| (7) |
Figure 8.
Geometry of the photon trajectory at θlim 1 < θ ≤ θlim 2 (left) and θ > θlim 2 (right).
In this phase Ageom is obtained by overlapping all three circles from the upper, lower and middle aperture at H. Ageom is given by
| (8) |
with
where
rg, Ag—radius and perimeter of the middle aperture projected from the source point onto the back plane of the collimator (green circle),
rb—radius of the lower aperture (blue circle),
rr—radius of the upper aperture projected from the source point onto the back plane of the collimator (red circle),
ggb, Agb—center-to-center distance and intersection area between the middle aperture projected from the source point onto the back plane of the collimator and the lower aperture (intersection of green circle and blue circle),
ggr, Agr—center-to-center distance and intersection area between the middle and lower apertures projected from the source point onto the back plane of the collimator (intersection of green circle and red circle).
The geometric sensitivity can be calculated using equation (4). We obtained the geometric sensitivity profile at opening angles 10°, 25°, 40° and collimator thicknesses 0.25 mm, 0.5 mm and 1 mm and compared it with Monte Carlo simulations using MCNP 5. This is presented in figure 11.
2.4. System sensitivity and angular sampling with focused pinholes
Tilting a large number of pinholes toward a common focal point is another characteristic of our imaging system. U-SPECT-I (Beekman et al 2005) was among the first small-animal SPECT scanners to use highly focused multi-pinhole collimation dedicated to the imaging of small regions such as mouse organs. We have adopted this concept for a larger number of pinholes with small opening angle and cylindrically shaped pinholes to project photons from a small imaging volume on the relatively small detector surface of our silicon DSSD (60.4 mm × 60.4 mm). In our current collimator model the focal point is placed at a distance of 30 mm from the collimator plate. In a dual-headed camera the angle between the camera heads (including the collimator plates) can be adjusted in a way that an overlap region with high angular sampling completeness and system sensitivity can be created. A good sampling completeness is usually required to reconstruct Tomographic images.
A 3D map of angular sampling completeness was calculated using the algorithm developed previously (Metzler et al 2003) based on the geometric connection between Orlov’s condition (Orlov 1975) that is formulated for parallel projection data and Tuy’s conditions (Tuy 1983) on the relationship of points to the curve of the cone-beam’s focal point. The sampling completeness is defined as
| (9) |
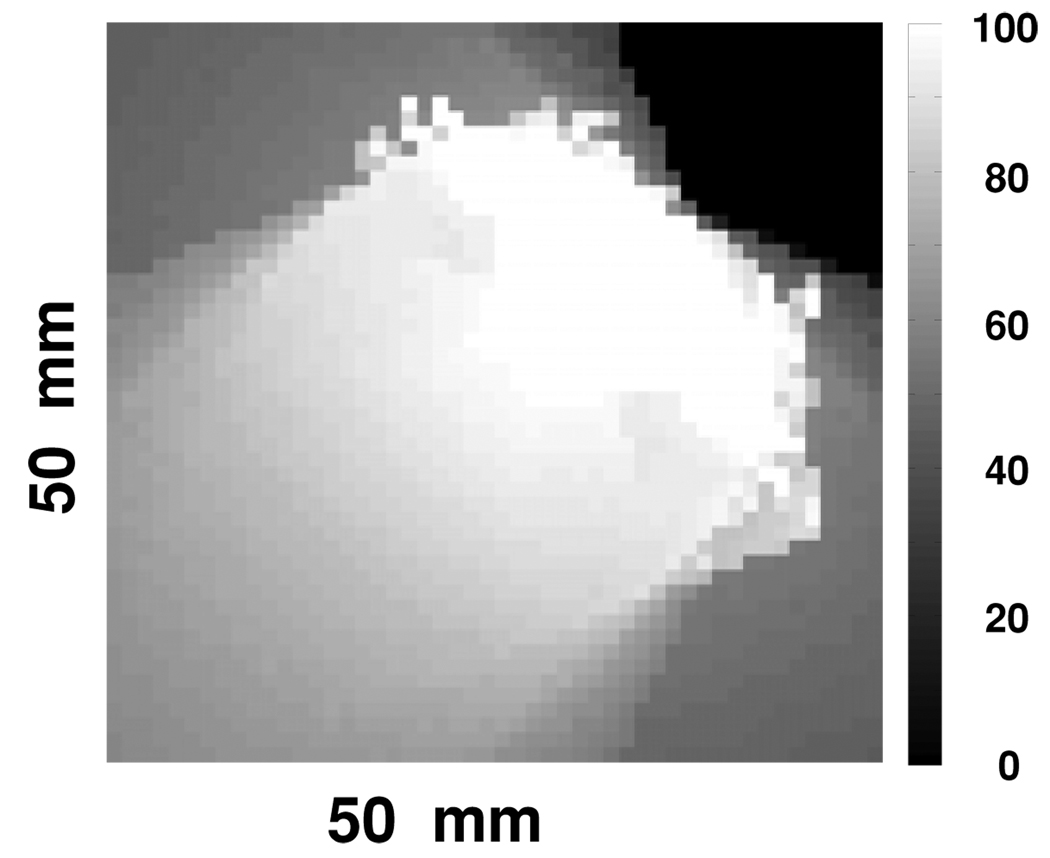
where SAIGC is the solid angle of intersected great circles (Orlov’s condition). This algorithm is applicable to both parallel-beam and cone-beam/pinhole geometries, and potentially useful for using the same computational code for the calculation of the sampling maps of different collimator configurations with cylindrically shaped pinholes, knife-edge pinholes and parallel hole collimators. An axial slice of the sampling map is presented in figure 12. Using a simulation study (MCNP5) we determined the axial profile of the system sensitivity with two sets of multi-pinhole collimators and a dual-headed camera geometry for a point source at 20 mm distance from the collimators. For detectors we modeled two silicon layers (thickness = 1 mm) placed at 20 mm and 30 mm distances behind the collimator on each camera head. The object was rotated in two orthogonal steps to represent a dual-headed and orthogonal SPECT configuration. The sensitivity profile was determined by step-wise moving the point source in the directions shown in figure 13. Figure 13 also compares the profile obtained with 127 tilted pinholes to the profile obtained from the same number of pinholes that were not focused to show the significant increase of the system sensitivity using focused pinhole geometry.
Figure 12.
An axial slice of a 3D sampling map.
Figure 13.
The axial profile (see arrow directions) of the total system sensitivity obtained from simulation studies with a dual-headed, focused multi-pinhole configuration and compared to an unfocused multi-pinhole.
2.5. Synthetic collimation
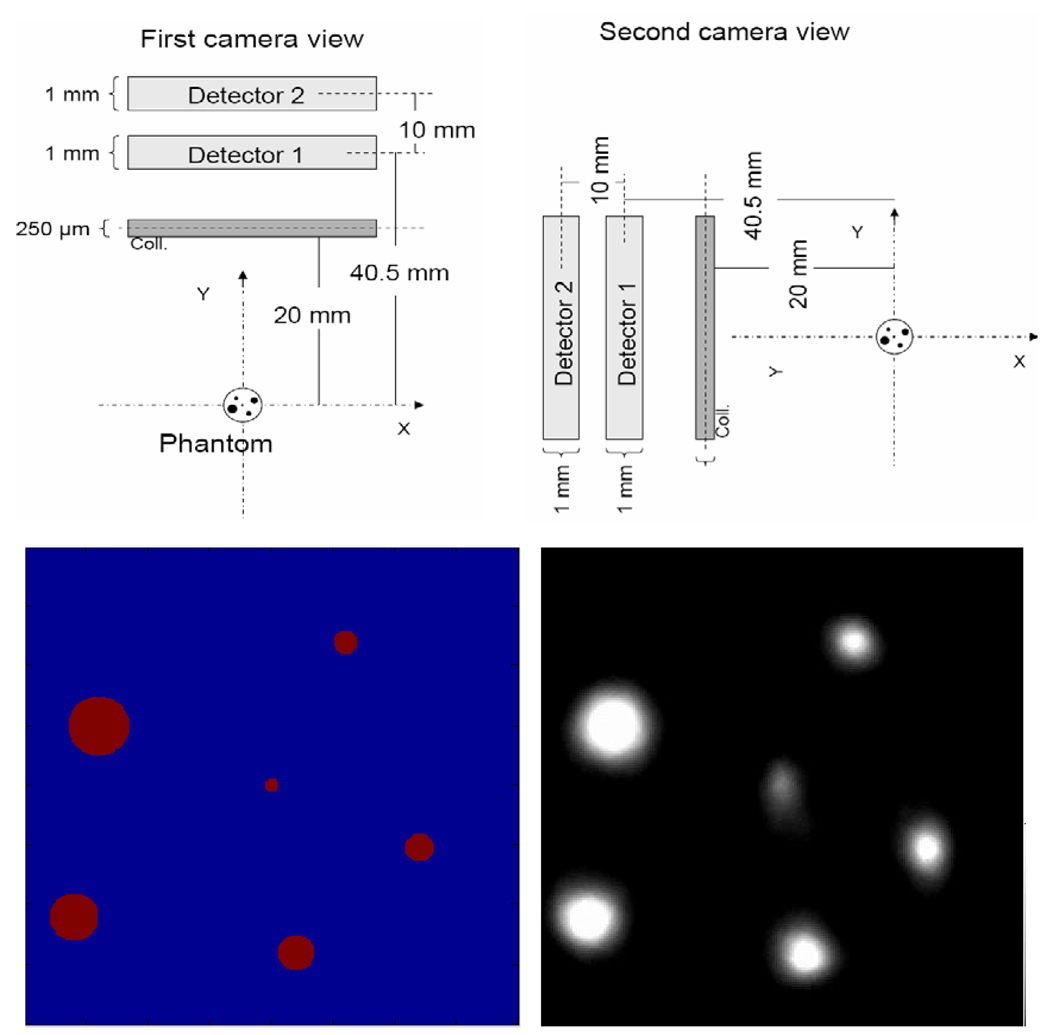
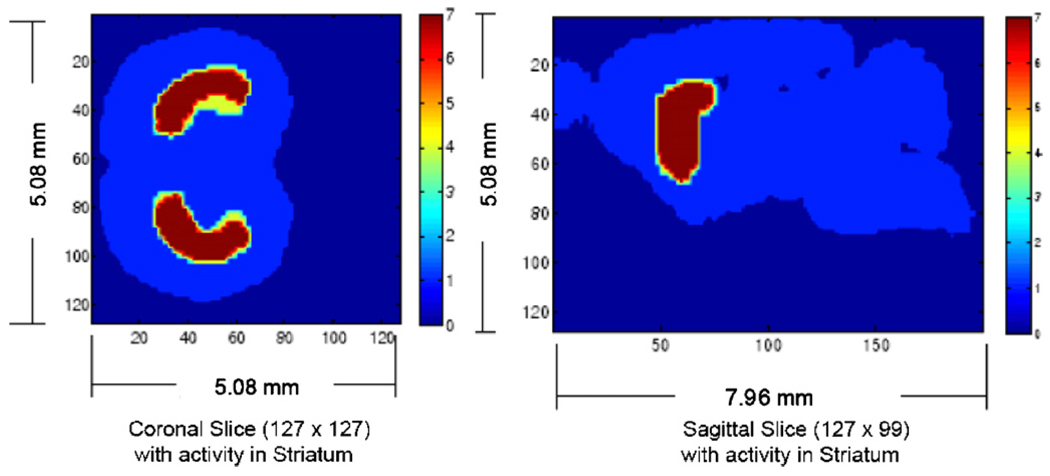
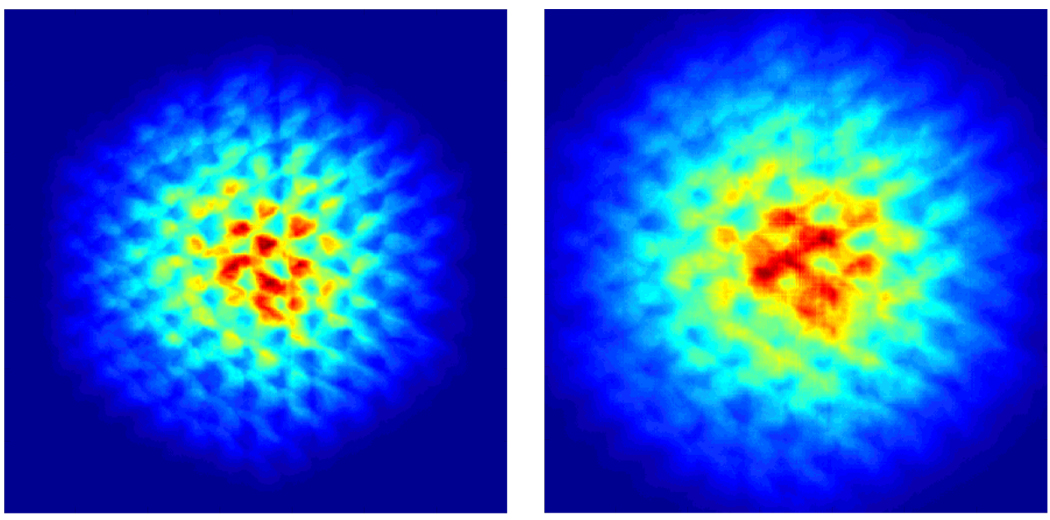
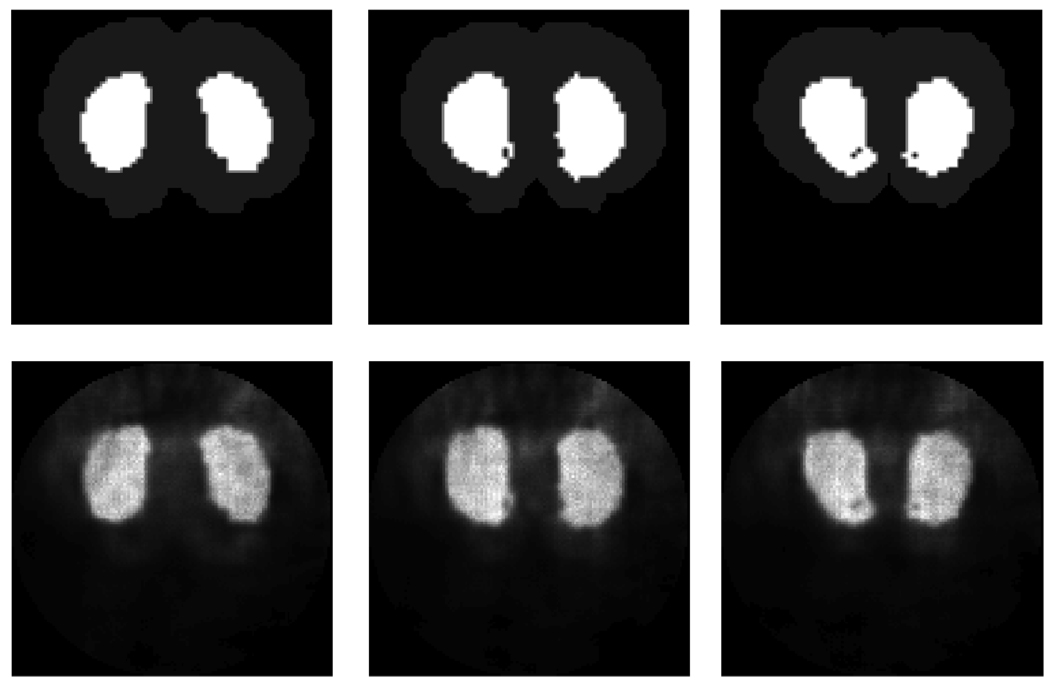
Using the same configuration described in the previous section we simulated projection data from a microstructure phantom (diameters: 60–250 µm) to perform an initial study of image reconstruction using simulated data with stacked detectors in a dual-headed camera and a pair of 127 focused multi-pinhole collimators. The front detectors acquired projection data with a magnification of 1 and the back detectors with 1.5. For the image reconstruction we used both sets of projection data with two levels of magnification. The system matrix was calculated analytically, and the photons attenuation in the front detectors was included into the system model. Figure 14 shows the modeled camera and phantom geometry together with the reconstructed image using MLEM algorithm. The purpose of this study is to indicate the theoretical levels of spatial resolution that we might achieve with our current multi-pinhole system and the projection magnification on the front and back detectors. Using the same camera figuration we simulated projection data from a more realistic phantom of a mouse brain (figure 15) with an activity ratio of 7:1 between striatum and the rest of the brain, which was roughly estimated based on an in vivo mouse brain study (Jongen et al 2008). The projection images of this phantom on one of the front detectors and one of the back detectors is presented in figure 16. The reconstructed image of this phantom is shown in figure 17.
Figure 14.
Simulation study with SiliSPECT: The projections from the phantom were acquired at two different magnifications, M1 = 1, M2 = 1.5 (top). The phantom consists of microstructure capillary tubes of diameters between 60 and 250 µm. A slice from simulated data reconstructed with MLEM algorithm is shown in the right figure below.
Figure 15.
Simulation study with SiliSPECT using a mouse brain phantom with activity distribution in striatum. An activity ratio of 7:1 between striatum and rest brain was used. The reconstructed image of the phantom is shown is figure 17.
Figure 16.
Projection images of the mouse brain phantom on the front detector at low magnification (left) and back detector at high magnification (right).
Figure 17.
Axial slices of the reconstructed image (lower row) from the mouse brain phantom (upper row) using 80 iterations of MLEM algorithm with a voxel size of 137 µm.
3. Results
3.1. Cylindrically shaped pinholes
Figure 9 shows the surface plot of simulated photons through the pinhole opening. One can see that at increasingly oblique angle of incidence an asymmetric lens is constructed.
A comparison between (equation (1)) and Sgeom (equation (1)) at a distance of h = 20 mm and increasing θ for a cylindrically shaped pinhole is shown in figure 10 and compared to the simulated profile. The geometric sensitivity profile obtained with the new analytic model matched closely with the simulation results.
3.2. Knife-edge pinholes with small opening angle
The dependence of on L for different pinhole opening angles is presented in figure 11.
The sensitivity profile obtained with the new analytic model matched with the simulation results. From figure 11 we can also see that the sensitivity profile can be modified by changing the pinhole opening angle and collimator thickness. In particular, very narrow profiles can be obtained using thicker collimators and smaller opening angles. Therefore, this model is more accurate for knife-edge pinholes with small opening angle, and could also be used to adjust the pinhole’s sensitivity profile with respect to the object size.
3.3. System sensitivity and angular sampling
An example axial slice of the angular sampling map in the space between two camera heads is presented in figure 12. Figure 12 indicates that with the current multi-pinhole configuration even in a dual-headed, stationary SPECT system a small region with relatively high sampling completeness can be created. Using a Monte Carlo simulation study with MCNP5 the axial profile of the total system sensitivity of our dual-headed camera with two multi-pinhole collimators (each collimator: 127 tilted pinholes, 250 µm in diameter) was plotted and compared versus the profile obtained from the same number of pinholes that were not focused. In both cases the point source was placed at a normal distance of 20 mm from the two collimator plates. This plot is presented in figure 13.
With focused pinhole system the simulated peak absolute sensitivity is 0.082% (810 cps MBq−1) and remains around 0.07% in the central 10 mm diameter of the FOV. This is almost twice as much as the peak sensitivity value that can be obtained from the same number of pinholes when they are not focused.
3.4. Synthetic collimation and image reconstruction
Figure 14 shows the geometry and results from a simulation study of a microstructure phantom (diameter: 60–250µm) usingMCNP5 that modeled stacked detectors in a dual-headed camera with a pair of 127 focused multi-pinhole collimators. A total of 5000 000 projection counts were generated, and 25 ML-EM iterations were used to reconstruct the 3D image. No background was modeled in the simulation. By not including a background, we have conducted an idealized study with the purpose to indicate only the theoretical levels of spatial resolution that we might achieve with our current prototype system and the capability of reconstructing 3D objects in small imaging volumes using only two stationary camera heads.
We also used a phantom with some background for our image reconstruction studies using our focused multi-pinhole configuration. The phantom used for the mouse brain study is shown in figure 15. The projection images of this phantom on the front detectors and back detectors and the axial slices of the reconstructed are presented in figures 16 and 17.
Figure 16 shows the projection images of the mouse brain phantom on the front and back detectors. Figure 17 shows the reconstructed image of the phantom using MLEM image reconstruction.
4. Discussion
We have designed and studied a multi-pinhole collimator for a high-resolution SPECT system. Our main objective is imaging small objects at high resolution, high sensitivity and low pinhole magnification with a compact, stationary and dual-headed camera that utilizes detectors with intrinsic resolutions of 60 µm.
4.1. New analytical pinhole model
We implemented an analytical model of geometric pinhole sensitivity for cylindrically shaped pinholes based on a derivation originally developed by Barrett and Swindell (Barrett and Swindell 1981). We have shown that this formulation describes Ageom and the geometric pinhole sensitivity more accurately. We demonstrated that the shape of Ageom is given by the intersection of two circles constructed by the lower and upper edge of the pinhole. We have also extended this derivation to knife-edge pinholes with small opening angles to define terms for Ageom and Sgeom as a function of pinhole opening angle and collimator thickness. This derivation was based on the geometric equivalence between a knife-edge pinhole and three hypothetical planes. The results from figure 11 validate our derivation and also show that the opening angle and collimator thickness can be potentially used to adjust the sensitivity profile of a pinhole with respect to the object size, and to potentially reduce the impact of the background photons. Our new model of Ageom for cylindrically shaped pinholes and knife-edge pinholes with small opening angles are important for accurate image reconstruction using analytical system models.
4.2. Focused multi-pinhole configuration
Another characteristic of our collimator is a focused multi-pinhole geometry. We obtained the angular sampling map and system sensitivity of a prototype multi-pinhole collimator with a focused geometry of 127 cylindrically shaped pinholes. The sampling map was calculated based on a geometric connection between Orlov’s and Tuy’s conditions. The sampling map showed that even in a dual-headed and stationary SPECT high angular sampling can be achieved. The sampling map was calculated for an orthogonal position of the camera heads. For the future studies we will assess the sampling maps for different angles and positions between the two camera heads. The axial profile of the system sensitivity indicated that a focused multi-pinhole geometry can significantly enhance the total system sensitivity. The results from system sensitivity and angular sampling suggest that the current collimator is adapted to imaging small volumes such as a mouse brain or other targeted organs at high resolution, high sensitivity and high angular sampling.
4.3. Synthetic collimation and image reconstruction with simulated phantoms
We will implement synthetic collimation in our pinhole acquisition using stacked detector acquisition. The front detectors acquire projections at low magnification. Photons that transmit through the front detector may be detected in the back detectors at higher magnification. This configuration not only increases the number of detected photons but also allows 3D image reconstruction with a limited number of camera views. With smaller number of camera heads and low magnification a more compact SPECT can be designed to scan small objects/organs at very close distances, thus improving the sensitivity. The image reconstruction was performed with a simple phantom. However, the purpose of this study was to indicate only the theoretical levels of spatial resolution that we might achieve with our current system using modest projection magnification.
The image reconstruction of the simulated projection data from the mouse brain phantom represented amore realistic imaging task with background. The projection images of the mouse brain phantom on the front detectors and back detectors represent the levels of multiplexing. The reconstructed image in figure 17 indicated the possibility of using synthetic collimation for image reconstruction with the presence of multiplexing. Since the amount of the projection overlap varies at the two detectors, the data contain information on how the projections are multiplexed and on how to remove the multiplexing effect. The significance of using high-resolution detectors for synthetic collimation is the ability of acquiring the projections on the front detector with minimum magnification and multiplexing while acquiring projection images at back detector at higher magnification to achieve image reconstruction without loss of resolution. While artifacts may exist in the current images, their removal through the use of different sampling schemes and reconstruction parameters is a subject of active research. Additionally, one of our main proposed applications with this system, the imaging task of detecting beta-amyloid plaques, is not expected to be compromised by the presence of these artifacts. Our simulated image reconstruction of the mouse phantom did not include any activity distribution from outside of the brain. However, our focused multi-pinhole configuration with the selection of pinholes with very small opening angle is designed to reduce the impact of background activity from outside of the brain.
Given an intrinsic detector resolution of 59 µm the depth-of-interaction blurring will be present in detectors with a thickness of 1 mm. However, this blurring can be modeled and incorporated into the system matrix to recover for the resolution loss. The expected range of incident angle with respect to the detector is estimated between 0 and 26°. We showed in a previous study (Shokouhi et al 2004) that including depth-of-interaction into the system matrix can recover the parallax error from a large angle of incidence.
4.4. Future investigations
We are in the process of performing a separate study to investigate further optimization of the pinhole parameters such as their number and diameter based on using ideal-observer analysis for task-specific system assessment. Our preliminary data from these studies (Shokouhi et al 2007c) indicate that the current multi-pinhole configuration has reasonable sensitivity-resolution trade-off for detecting Amyloid beta plaques in mouse brain. These plaques are heterogeneous microstructures with the brain with diameters smaller than 100 µm. One of the main objectives in this study was to show how the shape of the pinhole could change the geometric pinhole perimeter and consequently the geometric PRF and sensitivity. Our theoretical studies assumed accurate pinhole geometry. However, the photographs of the pinholes (figure 2) reveal burrs and geometrical imperfections. This could be a concern in system modeling for image reconstruction of experimentally acquired data. For future experimental studies we will fabricate collimators using methods of more geometric precision, which can be achieved by using more costly techniques such as Tomo Lithographic molding.
Acknowledgment
The authors thank Dr Roberto Accorsi of the Children’s Hospital of Philadelphia for finding the formula cited in Mathworld. This work was supported by NIH/NIBIB R33 EB000776, NIH Grant P41 EB002035, a Career Award at the Scientific Interface (TEP) from the Burrough Wellcome fund and the 2008 postdoctoral molecular imaging scholar programme award.
References
- Accorsi R, Celentano L, Laccetti P, Lanza RC, Marotta M, Mettivier G, Montesi MC, Roberti G, Russo P. High-resolution 125I small animal imaging with a coded aperture and a hybrid pixel detector. IEEE Trans. Nucl. Sci. 2008;55:481–490. [Google Scholar]
- Accorsi R, Metzler SD. Analytic determination of the resolution-equivalent effective diamter of a pinhole collimator. IEEE Trans. Med. Imag. 2004;23:750–763. doi: 10.1109/tmi.2004.826951. [DOI] [PubMed] [Google Scholar]
- Anger H. In: Radioisotope Cameras Instrumentation in Nuclear Medicine. Hine G, editor. vol 1. New York: Academic; 1967. pp. 516–517. [Google Scholar]
- Bal G, Acton PD. Analytic derivation of the point spread function for pinhole collimators. Phys. Med. Biol. 2006;51:4923–4950. doi: 10.1088/0031-9155/51/19/013. [DOI] [PubMed] [Google Scholar]
- Barrett HH, Swindell W. Radiological Imaging—the Theory of Image Formation, Detection, and Processing. vol 2. New York: Academic; 1981. chapter 4. [Google Scholar]
- Beekman FJ, Vastenhouw B, Van Der Linden AJ, Rijk PB, Burbach JP, Smidt MP. U-SPECT-1: a novel system for submillimetre resolution tomography with radiolabelled molecules in mice. J. Nucl. Med. 2005;46:1194–1200. [PubMed] [Google Scholar]
- Cao Z, Bal G, Accorsi R, Acton PD. Optimal number of pinholes in multi-pinhole SPECT for mouse brain imaging—a simulation study. Phys. Med. Biol. 2005;50:4609–4624. doi: 10.1088/0031-9155/50/19/013. [DOI] [PubMed] [Google Scholar]
- de Vree GA, Van Der Have F, Beekman FJ. EMCCD-based photon-counting mini gamma camera with a spatial resolution <100 µm. Nucl. Sci. Symp. Conf. Rec., IEEE. 2004;5:2724–2728. [Google Scholar]
- Fiorini C, Longoni A, Porro M, Perotti F, Lechner P, Struder L. monolithic arrays of silicon drift detectors for medical imaging applications and related CMOS readout electronics. Nucl. Instrum. Methods Phys. Res. 2006;560:148–152. [Google Scholar]
- Furenlid LR, Wilson DW, chen YC, Kim H, Pietraski PJ, Crawford MJ, Barrett HH. FastSPECT II: a second-generation high-resolution dynamic SPECT imager. IEEE Trans. Nucl. Sci. 2004;51:631–635. doi: 10.1109/TNS.2004.830975. [DOI] [PMC free article] [PubMed] [Google Scholar]
- Garibaldi F, et al. Small animal imaging by single photon emission using pinhole and coded aperture collimation. IEEE Trans. Nucl. Sci. 2005;52:573–579. [Google Scholar]
- Ishizu K, et al. Ultra-high resolution SPECT system using four pinhole collimators for small-animal studies. J. Nucl. Med. 1995;36:2282–2287. [PubMed] [Google Scholar]
- Jaszczak RJ, Li J, Wang H, Zalutsky MR, Coleman RE. Pinhole collimation for ultra-high resolution, small-field-of-view SPECT. Phys. Med. Biol. 1994;39:425–437. doi: 10.1088/0031-9155/39/3/010. [DOI] [PubMed] [Google Scholar]
- Jongen C, deBruin K, Beekman F, Booij J. SPECT imaging of D2 dopamine receptors and endogenous dopamine release in mice. Eur J Nucl Med Mol Imaging. 2008;35:1692–1698. doi: 10.1007/s00259-008-0795-0. [DOI] [PubMed] [Google Scholar]
- Kastis GA, et al. Tomographic small-animal imaging using a high-resolution semiconductor camera. IEEE Trans. Nucl. Sci. 2002;49:172–175. doi: 10.1109/TNS.2002.998747. [DOI] [PMC free article] [PubMed] [Google Scholar]
- Lackas C, Schramm NJ, Hoppin JW, Engeland U, Wirrwar A, Halling H. T-SPECT: a novel imaging technique for small animal research. IEEE Trans. Nucl. Sci. 2005;52:181–185. [Google Scholar]
- Mathworld. http://mathworld.wolfram.com/Circle-CircleIntersection.html.
- McElroy DP, MacDonald LR, Beekman FJ, Yuchuan Wang, Patt BE, Iwanczyk JS, Tsui BMW, Hoffman EJ. Performance evaluation of A-SPECT: a high resolution desktop pinhole SPECT system for imaging small animals. IEEE Trans. Nucl. Sci. 2002;49:2139–2147. [Google Scholar]
- Meng LJ, Clinthorne NH, Skinner S, Hay RV, Gross M. Design and feasibility study of a single photon emission microscope system for small animal I-125 imaging. IEEE Trans. Nucl. Sci. 2006;53:1168–1178. doi: 10.1109/TNS.2006.871405. [DOI] [PMC free article] [PubMed] [Google Scholar]
- Metzler SD, Bowsher JE, Greer KL, Jaszczak RJ. Analytic determination of the pinhole collimator’s point-spread function and RMS resolution with penetration. IEEE Trans. Med. Imaging. 2002;21:878–887. doi: 10.1109/tmi.2002.803129. [DOI] [PubMed] [Google Scholar]
- Metzler SD, Bowsher JE, Jaszczak RJ. Geometrical similarities of the Orlov and Tuy sampling criteria and a numerical algorithm for assessing sampling completeness. Nucl. Sci. IEEE Trans. 2003;50:1550–1555. [Google Scholar]
- Metzler SD, Bowsher JE, Smith MF, Jaszczak RJ. Analytic determination of pinhole collimator sensitivity with penetration. IEEE Trans. Med. Imaging. 2001;20:730–741. doi: 10.1109/42.938241. [DOI] [PubMed] [Google Scholar]
- Miller BW, Barber HB, Barrett HH, Wilson DW, Chen L. A low-cost approach to high-resolution, single-photon imaging using columnar scintillators and image intensifiers. IEEE Nucl. Sci. Symp. Conf. Rec. 2006;6:3540–3545. [Google Scholar]
- Mok SP, Wang Y, Tsui BMW. Design of a novel pinhole collimator system for SPECT imaging of small animals with different sizes. IEEE Nucl. Sci. Conf. Rec. 2005;5:2649–2652. [Google Scholar]
- Moore RH, Ohtani H, Khaw BA, Strauss HW. High resolution pinhole sequence imaging of small laboratory animals. Cancer. 1991;32:987. [Google Scholar]
- Ogawa K, Kawade T, Nakamura K, Kubo A, Ichihara T. Ultra high resolution pinhole SPECT for small animal study. IEEE Trans. Nucl. Sci. 1998;45:3122–3126. [Google Scholar]
- Orlov SS. Theory of three dimensional reconstruction. I. Condition for a complete set of projections. Sov. Phys. Crystallogr. 1975;20:312–314. [Google Scholar]
- Peterson TE, Shokouhi S, Furenlid LR, Wilson DW. Multi-pinhole SPECT imaging with silicon strip detectors. IEEE Nucl. Sci. Symp. Conf. Rec. 2005;3:1797–1801. doi: 10.1109/TNS.2009.2012514. [DOI] [PMC free article] [PubMed] [Google Scholar]
- Rentmeester MCM, Van Der Have F, Beekman FJ. Optimizing multi-pinhole SPECT geometries using an analytical model. Phys. Med. Biol. 2007;52:2567–2581. doi: 10.1088/0031-9155/52/9/016. [DOI] [PubMed] [Google Scholar]
- Rogulski MM, Barber HB, Barrett HH, Shoemaker RL, Woolfenden JM. Ultra-high-resolution brain SPECT imaging: simulation results. IEEE Trans. Nucl. Sci. 1993;40:1123–1129. [Google Scholar]
- Song TY, et al. Optimization of pinhole collimator for small-animal SPECT using Monte Carlo simulation. IEEE Trans. Nucl. Sci. 2003;50:327–332. [Google Scholar]
- Shokouhi S, et al. Statistical 3D image reconstruction for the RatCAP PET tomograp using a physically accurate, Monte Carlo based system matrix. Nuclear Sci. Symp. Conf. Record. 2004;6:3901–3905. [Google Scholar]
- Shokouhi S, Fritz MA, McDonald BS, Durko HL, Furenlid LR, Wilson DW, Peterson TE. A Silicon SPECT system for molecular imaging of the mouse brain. Nuclear Sci. Symp. Conf. Record. 2007a;6:2782–2784. doi: 10.1109/NSSMIC.2007.4436717. [DOI] [PMC free article] [PubMed] [Google Scholar]
- Shokouhi S, McDonald BS, Durko HL, Fritz MA, Furenlid LR, Peterson TE. Performance characteristics of thick silicon double sided strip detectors. Nuclear Sci. Symp. Conf. Record. 2007b;6:1656–1660. doi: 10.1109/NSSMIC.2007.4437318. [DOI] [PMC free article] [PubMed] [Google Scholar]
- Shokouhi S, Wilson DW, Pham W, Peterson TE. System evaluation for in vivo imaging of Amyloid beta plaques in mouse brain using statistical decision theory. Nuclear Sci. Symp. Conf. Record. 2007c;6:4528–4530. [Google Scholar]
- Strand SE, et al. Small animal imaging with pinhole single photon emission computed tomography. Cancer. 1994;73:981–984. doi: 10.1002/1097-0142(19940201)73:3+<981::aid-cncr2820731334>3.0.co;2-n. [DOI] [PubMed] [Google Scholar]
- Tuy HK. An inversion formula for cone-beam reconstruction. SIAM J. Appl. Math. 1983;43:546–552. [Google Scholar]
- Wang YEC, Frey Qi Y, Tsui BM, Du Y. Analytic derivation of geometric point response function and angle-dependent geometric detection efficiency for pinhole collimators with keel-edge (channelled) apertures; SNM 51st Annual Meeting; 2004. (abstract # 448) [Google Scholar]
- Weber DA, et al. Pinhole SPECT: an approach to in vivo high resolution SPECT imaging in small laboratory animals. J. Nucl. Med. 1994;32:342–348. [PubMed] [Google Scholar]
- Weisenberger AG, et al. Instrumentation development of a SPECT-CT system to image awake mice. Nucl. Sci. Symp. Conf. Rec., IEEE. 2006;5:3000–3003. [Google Scholar]
- Williams MB, Stolin AV, Kundu BK. Investigation of efficiency and spatial resolution using pinholes with small pinhole angle. IEEE Trans. Nucl. Sci. 2003;50:1562–1568. [Google Scholar]
- Wilson DW, Barrett HH, Clarkson EW. Reconstruction of two- and three-dimensional images from synthetic-collimator data. IEEE Trans. Med. Imaging. 2000;19:412–422. doi: 10.1109/42.870252. [DOI] [PubMed] [Google Scholar]


