Abstract
MRI is becoming an increasingly important tool to assess iron overload disorders, but the complex nature of proton–iron interactions has troubled noninvasive iron quantification. Intersite and intersequence variability as well as methodological inaccuracies have been limiting factors to its widespread clinical use. It is important to understand the underlying proton relaxation mechanisms within the (human) tissue environment to address these differences. In this respect, NMR relaxometry was performed on 10 fresh human liver biopsy specimens taken from patients with transfusion-dependent anemia. T1 (1/R1) inversion recovery, T2 (1/R2) single echo, and multiecho T2 CPMG measurements were performed on a 60-MHz Bruker Minispectrometer. NMR parameters were compared to quantitative iron levels and tissue histology. Relaxivities R1 and R2 both increased linearly with hepatic iron content, with R2 being more sensitive to iron. CPMG data were well described by a chemical-exchange model and predicted effective iron center dimensions consistent with hemosiderin-filled lysosomes. Nonexponential relaxation was evident at short refocusing intervals with R2 and amplitude behavior suggestive of magnetic susceptibility-based compartmentalization rather than anatomic subdivisions. NMR relaxometry of human liver biopsy specimens yields unique insights into the mechanisms of tissue–iron relaxivity.
Keywords: relaxation, iron overload, liver, magnetic susceptibility, mathematical modeling
Iron overload is a serious health problem for patients with transfusion-dependent anemia and inherited disorders of iron adsorption or metabolism (1). Iron accumulates in bone marrow, liver, spleen, kidney, endocrine organs, and the heart with deadly consequences. In transfusion-dependent anemia, iron stores can only be reduced by stringent iron chelation therapy. To monitor chelation efficacy, hepatic iron concentration is used as a surrogate for total iron stores (2). Currently, liver biopsy remains the most available and clinically accepted standard for hepatic iron measurement; however, it is expensive, invasive (0.5% hemorrhage risk), and painful (3). Liver biopsy is also prone to sampling variation due to uneven hepatic iron concentration and distribution (15–40% coefficient of variation) (4,5). Moreover, liver biopsy provides only indirect information regarding iron loads in other organs. A noninvasive technique for quantifying iron content in the liver and other organs would be an important new clinical tool for management of severe iron overload (6).
MRI is a logical choice for noninvasive iron quantitation because paramagnetic iron compounds produce magnetic inhomogeneities that shorten MRI relaxation times: T1 (1/R1),T2 (1/R2), and T2*. While feasibility was first demonstrated by Stark et al. (7,8), relaxivity–iron relationships still vary among investigators in complicated ways. Recent studies have shown good intermachine and interstudy reproducibility for individual pulse sequences (9,10). However, iron calibration appears to vary with acquisition method (single spin-echo, multiple spin-echo, or spectroscopic sequence (11–13)) as well as relaxation model (monoexponential, biexponential, and nonexponential (14,15)). The variability seen across these factors remains unresolved. Although calibration phantoms can be optimized for any single MRI parameter (R2 or R2*), they do not jointly describe R1 or proton mobility properties. As a result, any pulse sequence modification must currently be revalidated in a patient population, an expensive, tedious, and time-consuming task. In order to calibrate and standardize in vivo methods, it is important to understand the complex interaction of stored iron particles and water protons within the tissue of interest. Several theoretical approaches to this problem have been previously published (14–16) but physical validation has been limited(17–19).
To test these theoretical models, we performed NMR relaxometry analysis in human liver biopsy specimens and compared the relaxation times with histochemically obtained hepatic iron content (HIC) and distribution. Use of an NMR relaxometer offers shorter echo time and narrower echo spacing, improved field uniformity, and better signal-to-noise ratio. It also allows high-quality CPMG analysis at multiple interecho spacings (τ), providing insight into relative proton mobility compared with iron particle size. Specifically, we hypothesized that the “effective” iron particle size, derived from T2-τ behavior, would increase with total iron concentration.
METHODS
Subject Recruitment
All patients at the Childrens Hospital of Los Angeles undergoing clinically indicated liver biopsy for iron overload were approached for participation in this study. Informed consent was obtained on a protocol approved by the Childrens Hospital of Los Angeles Committee on Clinical Investigation. Ten patients were enrolled from 06/2002 to 04/2004.
NMR Data Acquisition and Quantitative Iron Assessment
All liver biopsy specimens were obtained from the right lobe of the liver under ultrasound guidance. Liver samples were collected using an 18-gauge cutting liver bioptome. Two specimens (for each patient), with an average sample wet weight of 7.1 mg, were placed in a plastic sample container and transported to pathology. One specimen was obtained from the pathology technician within 10 min after extraction and placed in a custom-milled airtight Teflon holder. The Teflon holder was attached to a 1/8 Teflon rod and positioned in an 8-mm glass NMR tube. The holder was also sealed with Teflon tape over plastic wrap. T1 inversion recovery (IR), T2 single echo (SE), and multiecho T2 CPMG measurements were performed on a 60-MHz Bruker Minispectrometer (Bruker Optics, Inc.). T1 was measured with 2-s recycle time and 10 inversion times arranged logarithmically up to 2 s. Single echo T2 was calculated using Hahn spin echo with 10 echo times logarithmically distributed between 2 and 60 ms (TR = 2 s, 4 excitations, phase cycling). Multiecho CPMG T2 measurements were performed at 12 different interecho spacings τ = 0.1, 0.2, 0.3, 0.4, 0.5, 0.6, 1, 2, 4, 5, 6, and 10 ms (8 excitations each). The number of points acquired was adjusted to keep a constant signal duration of 120 ms. All samples were maintained at 37°C within the spectrometer bore.
Following NMR analysis, the sample was allowed to desiccate completely and transferred to Mayo Medical Laboratory (Metals Laboratory, Rochester, NY, USA) for quantitative iron analysis.
Histologic Processing and Analysis
The second liver biopsy core was fixed in 10% formalin, paraffin-embedded, and sectioned for histologic analysis. Sections were stained with hematoxylin and eosin as well as Prussian blue iron stains. In five patients, a small section was processed for electron microscopy. Sample was immediately fixed with 2% glutaraldehyde in 0.1 M sodium cacodylate buffer (pH 7.4). Tissue was rinsed, postfixed with 2% OsO4 for 1 h, rinsed again, dehydrated through graded ethanol solutions, and treated with a mixture of ethanol and propylene oxide. After Epon blocks were made from these samples, semi-thin sections were reviewed for fine structural examination. Ultrathin sections of the liver samples were then cut, mounted on collodion one-hole grids, stained with uranyl acetate and lead citrate, and examined with a Philips CM 12 transmission electron microscope. Each tissue sample was of approximately 1.07 mm2 area and 1 µm thickness.
Electron microscopy (EM) images were obtained from five liver tissue samples with diagnosed hepatic iron concentrations ranging from 1.4 to 57.8 mg iron/g dry liver tissue. Twenty snapshots, with 9000× magnification, were acquired from each tissue section in a uniform grid-like fashion using a systematic–random sampling scheme (17). According to this scheme, the first snapshot is taken at random (spatially) within the tissue section and then successive snapshots are obtained systematically with a fixed distance between them. The procedure is efficient and provides a theoretically unbiased estimate of expected object number by sampling a known fraction of overall population. The distance between adjacent snapshots was greater than 100 µm, significantly larger than hepatocyte dimensions, ensuring relative statistical independence between them. The hemosiderin rich lysosomes were then manually segmented using Metamorph software (Universal Imaging, Downington, PA, USA). An equivalent radius was calculated for each traced object by using a circular equivalent to the traced cross-sectional area. A cumulative histogram from 20 snapshots was generated for each of the five samples.
Data Analysis
For each sample, T1-IR and T2-SE relaxation data were fit to a simple monoexponential (ME) model. A variable offset term was also used in the models to correct for digitizer offset, noise bias, and very long T2 species such as blood, plasma, connective tissue, and saline. Linear regression was performed between computed T1 and T2 values and HIC. For CPMG sequences, monoexponential T2-τ behavior was fit to the chemical-exchange model (CE). Signal decay curves were also fit to biexponential (BE) and non-exponential (NE) models for all interecho intervals. The effect of HIC on CE, BE, and NE model parameters was determined by scatter plots and linear regression.
Chemical Exchange Model
The two-site CE model describing T2 relaxation (14) is given by
| [1a] |
where Fa, Fb = proton fraction at each site, Δωb = relative difference in angular Larmor frequency between sites, τex = reflects residence time of protons at the sites, τ = echo spacing used in the CPMG sequence. In short, the CE model describes the relaxation process by dividing the diffusion space into two magnetically distinct environments: strongly dephasing near the magnetic spheres and weakly dephasing in remote regions.
Equation [1a] can be rewritten as
| [1b] |
where K is a constant representing a collective effect of two-site proton population and frequency gradient. CPMG T2 values, obtained by fitting the signal to a ME model, along with corresponding τ, were used to find an optimal solution (K and τex) for Eq. [1b]. A least-squares fitting algorithm based on the interior-reflective Newton method was employed for minimization (18,19).
For spherical iron particles distributed in a homogenous medium, an equivalence has been drawn between the CE model and standard diffusion theory (14); τex is shown analogous to diffusion time τd, which is the time required for a water molecule to diffuse past a particle. By equating the T2 relaxation behavior according to these two models over both long and short echo limits,
| [2] |
Since τd = reff 2/D, where reff = effective particle radius and D = diffusion coefficient, the effective particle radius can derived from the estimated τex and the diffusion coefficient. Since diffusion measurements are difficult in iron-loaded tissues and were not possible on our NMR relaxometer, an apparent water diffusion coefficient of normal liver was used (0.76 µm2/ms, Yamada et al. (20)).
Nonexponential Model
Earlier studies have observed large deviations from mono-exponential signal decay when CPMG sequences are employed (11,13,21) at high iron loads and higher field strengths. This phenomenon has been attributed to the large local inhomogeneities created by the nonuniformly distributed iron. The effect has also been seen in normal liver administered with contrast agents such as superparamagnetic iron oxide particles (22,23). Biexponential and nonnegative least-square T2 spectra have both been used to describe compound relaxation curves observed at high iron loads.
Alternatively, Jensen and Chandra (15) modeled the signal decay curves from superimposed strongly dephasing magnetic dipoles, representing them as the composite of a simple monoexponential term and an anomalous nonexponential factor. Based on this theory, all our CPMG signal decay curves (at every τ) were fit to the NE model, which is given by,
| [3] |
where t = time, S0 = initial signal intensity, a = nonexponential decay factor reflecting the typical distance between iron clusters. The solution involved optimization of three variables viz S0, R2, and a. Again, a least-squares fitting algorithm based on the interior-reflective Newton method was employed for minimization (18,19). For the particular case of liver with hereditary hemochromatosis, the factor a has been shown to be
| [4] |
where C = concentration of nonuniformly distributed iron clusters (mass of iron per mass of wet liver tissue), B0 = magnitude of applied magnetic field, L = average distance between centers of adjacent objects in a given medium defined by (24),
| [5] |
where V0 = average volume of objects, f = fill fraction of objects in given medium, L1 = average size of objects.
RESULTS
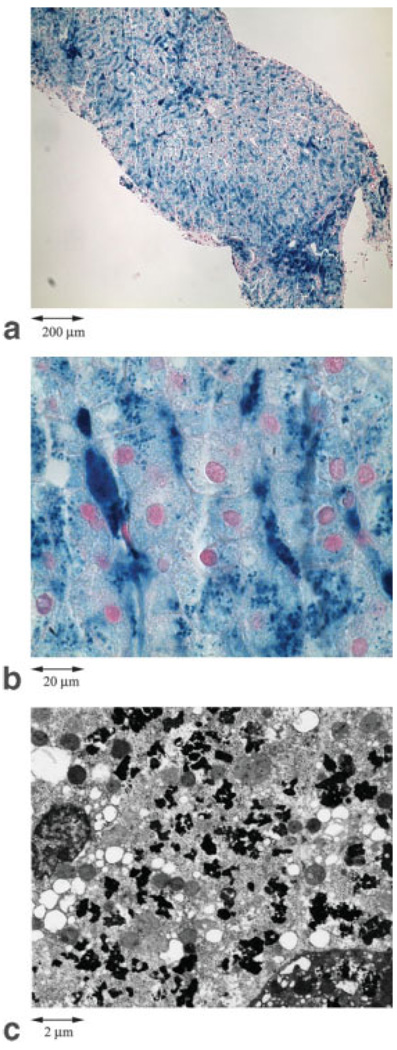
Iron deposits were inhomogeneous over distances spanning three orders of magnitude. Figures 1a and b show light microscopy images (100× and 1000× magnification, respectively) obtained from representative liver sample with 35.4 mg iron/g dry tissue. At lowest power, fluctuations on the scale of hundreds of microns are evident, representing heavier deposits near the central veins of the portal triads. Higher magnification (Fig. 1, middle) demonstrates heavy deposits in sinusoidal (Kupffer) cells producing magnetic inhomogeneities on the scale of 5–30 µm. Figure 1c shows a section of the same sample using electron microscopy (9000× magnification), revealing marked heterogeneity on the order of 0.1–2.0 µm produced by hemosiderin granules and their associated “grouping” by lysosomal boundaries.
FIG. 1.
(a) and (b) Light microscopy images from a representative liver biopsy sample (35.4 mg iron /g dry tissue) at 100× and 1000× magnification, respectively. (c) The electron microscopy image of the same sample (9000× magnification). The various “fractal” scales of iron deposition and distribution, which can effectively influence a diffusing water proton in accordance to the imaging experiment, are demonstrated.
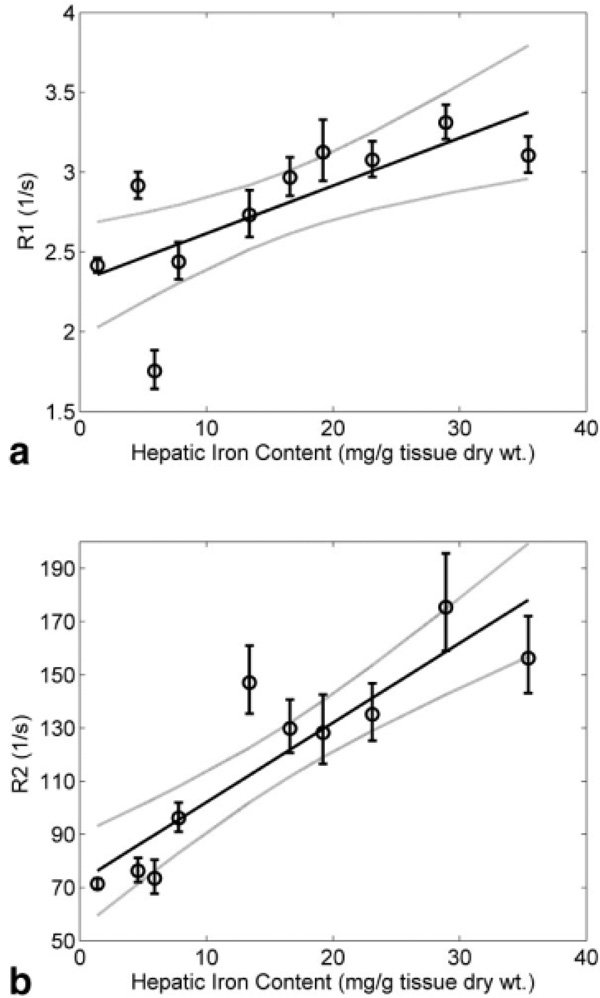
Figure 2 demonstrates NMR inversion recovery R1 and single spin echo R2 measurements as a function of HIC. R2 and R1 both increased linearly with HIC, having relaxivites of 2.99 and 0.029 (s−1. mg iron−1 · g dry tissue), respectively. R2 was more strongly associated with HIC (r = 0.89, P < 0.0005 for R2 versus r = 0.71, P < 0.02 for R1) and had greater sensitivity to iron (260% increase for R2 versus 140% increase for R1). The R2/R1 ratio increased from 24 in normal liver to over 55 for HIC of 35 mg/g, suggesting a magnetic susceptibility-based R2 increase.
FIG. 2.
(a) R1 (inversion recovery) and (b) R2 (single spin echo) dependence on hepatic iron content. Plots demonstrate linear rise of both relaxations with iron load; solid lines indicate linear fits (R1: r = 0.71, P < 0.02 and R2: r = 0.89, P < 0.0005). The vertical bars denote standard deviation and the dotted lines are 95% confidence intervals for the regression.
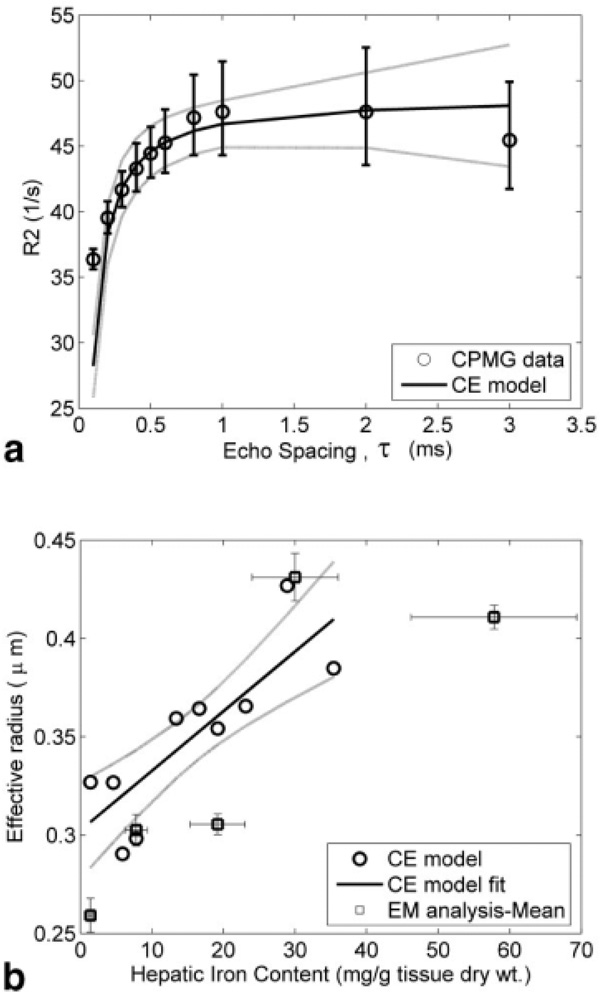
Plots of R2 versus τ were sigmoidal and were well described (χ2 = 2.86, P = 0.98) by the CE model (Eq. [1a], Fig. 3a). However, systematic error was evident, with the CE model predicting a more abrupt transition in the R2-τ curve. Figure 3b demonstrates effective object radius reff (Eq. [2]), calculated from the R2-τ curves (Fig. 3a), as a function of HIC. At each τ, R2 was calculated using an ME model. The observed τex and reff increased linearly as a function of HIC (r = 0.83, P < 0.003); reff ranged from 0.28 to 0.42 µm over an iron concentration range of 1.4–35.4 mg/g liver tissue (dry wt). The mean radii for varying iron concentrations, computed using EM analysis (discussed below), have been overlaid to indicate behavior similar to that predicted by the CE model. We were unable to conduct NMR experiments on the tissue sample with 57.8 mg iron/g dry tissue (no CE model prediction); this sample was included in the EM analysis as it represented one extreme end of measured hepatic iron concentration.
FIG. 3.
Results of applying the chemical exchange (CE) model to CPMG data from liver sample. (a) R2 as a function of interecho spacing for a representative liver biopsy sample with the CE model fit. (b) Effective particle radius as predicted by the CE model for a range of hepatic iron contents; the mean radii computed from EM analysis have been superimposed for comparison. The vertical bars denote standard deviation and the dotted lines are 95% confidence intervals for the regression.
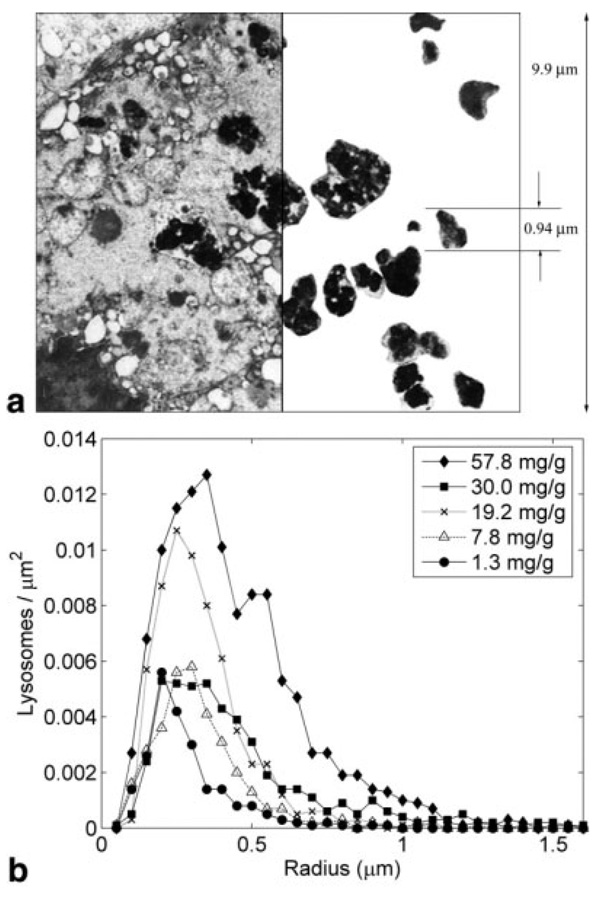
The consistency of the CE model with anatomic iron distribution was assessed by EM analysis. Figure 4a demonstrates a representative EM illustrating hepatic iron deposition in one heavily loaded iron patient. The sample field of view was 13.2 µm as indicated and the measured iron concentration in this particular liver sample was 19.2 mg iron/g dry tissue. For simplistic representation, Figure 4 has been divided into two halves. The left half shows the true liver EM, with the dark regions indicating iron-rich sites, while the right half shows the iron-rich organelles, called siderosomes, after manual segmentation of boundaries. The histogram of the “equivalent” siderosome radii, calculated for five patients (20 EM snapshots each), is shown in Fig. 4b for different iron concentrations. Overall, siderosomes ranged in size from 0.1 to 1.4 µm with object count peaks between 0.2 and 0.5 µm. Progressive iron loading increased both the number and size of the siderosomes. For the given range of HIC, the CE model predicted an effective object radius in the range of 0.28–0.46 µm (see Fig. 2b), which agreed well with the EM analysis.
FIG. 4.
(a) The left half indicates electron micrograph of a section of representative liver biopsy sample. The hemosiderin deposits (dark areas) are irregular and beaded and fill the lysosomes. The right half shows the manually traced lysosome regions containing hyperdense granules. This particular sample contained a high iron concentration, 19.2 mg iron/g dry tissue (b) Histograms of equivalent radius of hemosiderin-rich lysosomes for hepatic iron concentrations ranging between 1.4 and 57.8 mg iron/g dry tissue.
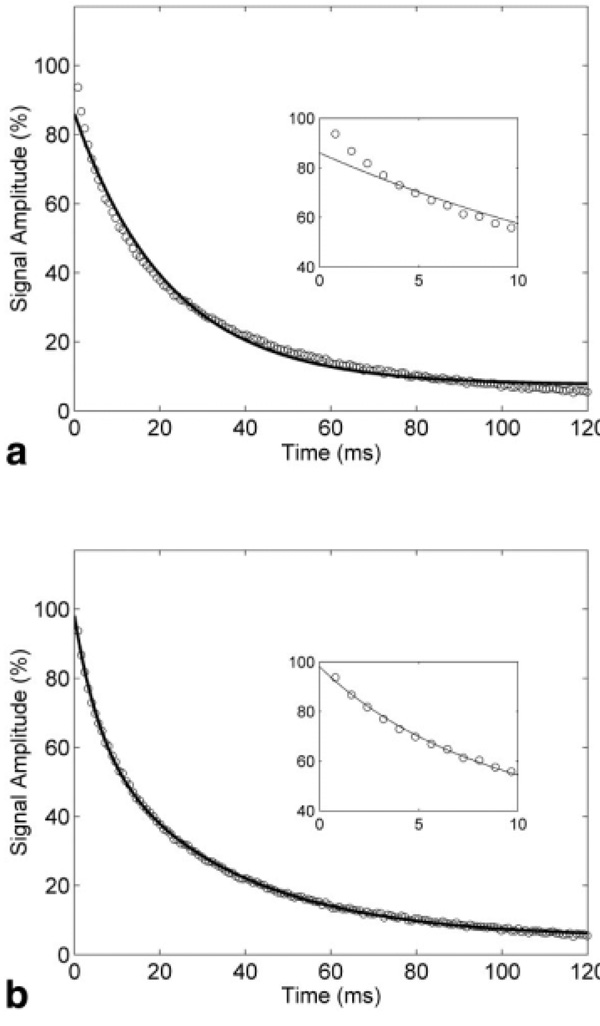
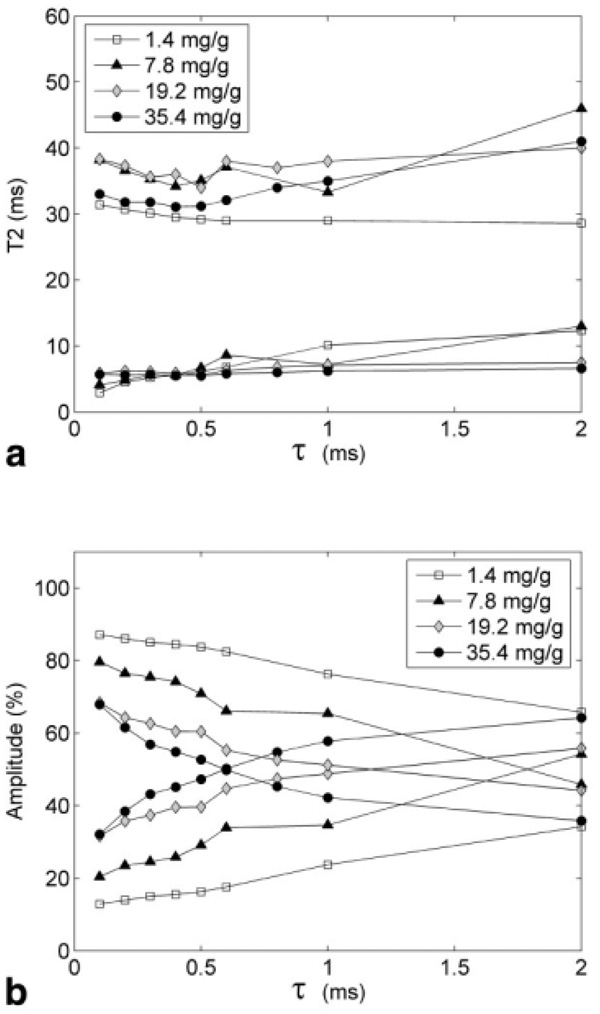
Figures 5a and b shows ME and BE models fit to representative signal acquired at τ = 0.4 ms. We can observe the inability of the ME model to accurately fit the rapid initial signal decay (shown in inset plot) compared to the BE model. This behavior was consistently observed for small values of τ, while at longer τ the curves became fairly monoexponential. This agrees with nonexponential or multiexponential signal decay characteristics observed in earlier studies (11,13,15,21). Although the BE model fit the data very well, the resulting short and long T2 values did not change systematically with HIC (Fig. 6a). Instead, the calculated proton populations (amplitudes) of the short and long T2 “pools” shifted with echo spacing (Fig. 6b). The “fast” species component (low amplitude), corresponding to protons within the “inner sphere,” i.e., close to the siderosomes, increased at higher τ, suggesting a dynamic inner sphere radius while the “slowly” decaying T2 protons component (high amplitude) decreased.
FIG. 5.
Signal decay curves for a typical CPMG experiment of liver specimen with τ = 0.4 ms. The inset shows the initial portion of the decay curve (0–10 ms time interval). The solid curves denote (a) monoexponential model fit and (b) biexponential model fit. The initial rapid decay component is apparent, which is not accounted for by the monoexponential model.
FIG. 6.
Biexponential behavior of CPMG signal decay curves across various iron loads. (a) Variation of long and short T2 components with τ. The relaxation is relatively independent of iron and weakly related to τ. (b) Variation of amplitudes of long (decaying curves) and short (rising curves) T2 components with τ. Higher iron load and larger τ increases the contribution from short T2 species. Also, population inversion occurs at a shorter τ with increase in iron load.
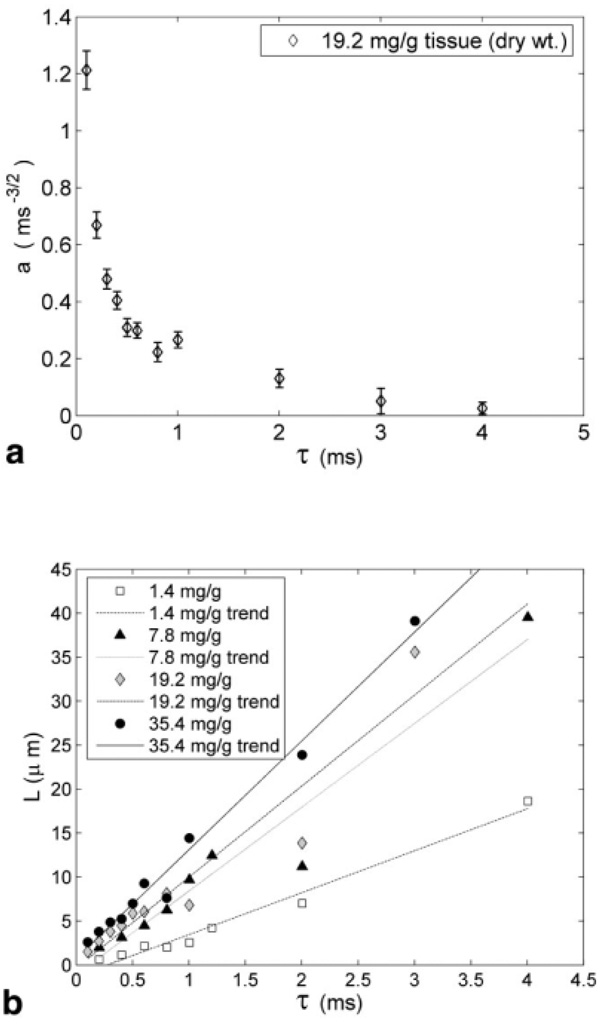
Signal decay curves were well fit by the NE model as well (not shown). However, as shown in Fig. 7a (representative data: 19.2 mg iron/g dry liver tissue), the iron spacing parameter “a” decreased rapidly with τ. The parameter “a” is reciprocally related to the typical distance between the iron clusters, L (Eq. [4]). Figure 7b demonstrates that L rises with τ for all levels of hepatic iron with the slope increasing with HIC.
FIG. 7.
Results of the nonexponential model applied to CPMG data. (a) Variation of parameter “a”, reflecting spacing between iron clusters, with τ for a representative liver specimen. (b) This plot demonstrates an increase of the spacing between iron centers L (derived from “a”) with iron load as well as with τ. The vertical bars denote 95% confidence bounds in estimation of the model parameter “a.”
DISCUSSION
MRI is gaining greater acceptance as an alternative to biopsy for quantitating hepatic iron concentration (9,25,26). Gandon et al. (26) employed a signal-intensity ratio approach (liver to muscle, L/M) using gradient-recalled-echo (GRE) sequence and reported a correlation coefficient of 0.89 (GRE-T2) between L/M and HIC; the study included 108 human patients with suspected hemochromatosis. St. Pierre et al. (9) performed single spin-echo experiments on 105 human subjects and found a curvilinear relationship between R2 and HIC with a correlation coefficient of 0.98. This technique subsequently received FDA approval for clinical liver iron estimation. Unfortunately, by using a “black-box” approach, i.e., a calibration curve between MRI signal and iron is derived from patients having simultaneous liver biopsy and MRI exam, one is forced to recalibrate in patients for any pulse sequence modifications. This is tedious, time-consuming, and expensive. Furthermore, a black-box approach is much more difficult for tissues such as the heart, brain, pituitary, and pancreas. While black-box techniques may be sufficient for clinical liver iron measurements, improved understanding of the MRI physics is important. First, it will help explain differences in iron-mediated liver relaxivity observed by different investigators (12,27) and in different species (8,13,21). Iron-mediated transverse relaxation (R2 and R2*) appears to be heavily dominated by diffusional effects (28,29), which in turn are often weighted differently among different R2 measurement sequences such as single spin echo, multiple spin-echo, and spectroscopic R2 techniques (12,30,31). Second, this knowledge will improve quantitation of iron-mediated relaxivity in tissues where biopsy is not feasible such as the heart, pancreas, and pituitary. In short, liver represents an excellent “model tissue” to study the biophysics of iron–proton interactions because it is accessible for anatomic and functional studies.
These data represent the first NMR relaxometry analysis of fresh iron-overloaded human liver tissue. This approach eliminates sampling variability since iron content is assessed from the same specimen from which quantitation is performed. NMR relaxometers also offer superior T1, single echo T2, and multiecho T2 measurements because echo times are an order of magnitude shorter than for clinical scanners. We documented a linear increase in R1 and R2 with HIC; an R1 increase with iron overload has been shown in rodent models of iron overload (8) but has never been reported in humans or primates. The presence of detectable longitudinal relaxation indicates that a portion of the hepatic iron pool is available for spin–lattice mechanisms. Using an estimated wet to dry weight ratio of 3.8 (32), the observed liver R1 relaxivity was approximately 25% of that for either free or liposomal-ferritin analyzed using the same instrument (33). R2 relaxivity dominated with R2/R1 ratios in excess of 50 at high iron concentrations. The dominance of transverse relaxivity probably arises from the “cloistered” nature of hemosiderin. Lysosomal hemosiderin behaves like paramagnetic beads, producing greater susceptibility-induced T2 decay than freely dispersed ferritin (33).
CPMG experiments serve as a good tool to probe into the susceptibility effects within a given medium. Performing CPMG acquisitions at multiple interecho spacings provides a mechanism to interrogate the interactions between diffusing water protons and iron centers. Several theories have been proposed to explain these CPMG relaxation mechanisms in magnetic milieu (14–16). The simplest of these is the chemical exchange model, which divides the magnetic environment into strongly and weakly dephasing regions characterized by an exchange time (τex) between them (14). Although a very crude representation, the chemical exchange model surprisingly yields a good approximation to the R2 versus τ behavior. The deviation is higher under very low and very high iron loads. The degree of curvature of the experimental data is systematically less than that predicted by the model; this likely reflects limitations of quantizing continuous behavior into only two states. Alternatively, the deviation may result because liver iron centers are not uniformly sized, but represent a distribution of iron sizes (Fig. 4b). Signal superposition might “blunt” the abrupt transition predicted by the CE model. Unfortunately, it is not possible to test this hypothesis in our data because we do not have estimates of the CE scaling coefficient “K” outside of the size interval [0.28–0.46], while observed lysosomal size spans a much broader range.
Despite its limitations, the CE model predicts an effective iron scale, which is roughly the size of hepatic siderosomes (Fig. 3b and Fig. 4b). The peaks of the histograms indicate the physical dominance of iron particulates in the range of 0.2–0.5 µm over all cases of iron concentrations, consistent with predications by the CE model. Moreover, the effective radius provided by the model also increased modestly with increasing total hepatic iron concentration. The histograms also show that prevalence of larger objects increases with iron concentration, indicating lysosomes tend to grow. The present data clearly suggest that ironscale fluctuations produced by the lysosomes are on a reasonable spatial scale to explain the R2-τ behavior observed in human iron overloaded liver. It also explains the success of our prior work with 0.4-µm synthetic liposomes to approximate some aspects of iron overloaded liver (33). Although both greater (>10 µm) and smaller scale (<0.1 µm) susceptibility/magnetic field variations are present, our preliminary anatomic and functional data support characterizing interactions in the intermediate range, consisting of particles from 0.1 to 10 µm.
The two-stage crude CE representation is based on T2 values obtained using a monoexponential model. As demonstrated in Fig. 5, the signal decay curves represent at least two distinct magnetic environments. Biexponential relaxation at high iron concentrations and field strength has been described by multiple investigators (11,13). Bulte et al. (13) studied liver samples from marmosets with spontaneous hepatic hemosiderosis, using a CPMG sequence with τ = 1 ms for a range of magnetic fields (0.05–1.5 T). They attributed the two-component relaxation to integrity of histologic architecture; fast component from intracellular protons, and slow component from intercellular water. The relative population of the two pools was 70%/30% at τ = 1 ms; however, variation in these populations with interecho spacing was not studied.
If the fast and slow component pool populations were determined by fixed anatomic boundaries, one would expect that changes in interecho spacing might affect the T2 from each pool but not the relative occupancy. That is, the relative mixture of fast and slow components should be independent of τ. In fact, we observe the opposite behavior. Relative population of the rapidly decaying component increased with echo-time and with iron content compared with the slowly decaying component. The T2’s of the slow components were essentially independent of τ and iron concentration. In fact, the T2 of the fast component paradoxically rose with τ; this phenomenon was also noted by Bulte et al. (13). Thomson et al. (11), using a multiecho spectroscopy T2 sequence, demonstrated that an increasing fast component amplitude was iron sensitive while the fast T2 value was not. Similarly, Liu et al. (21) demonstrated two dominant T2 peaks involved in CPMG signal decay curves from iron overloaded mouse liver. The position of the T2 peaks did not vary much with iron, but the relative populations of the two pools shifted toward each other with the contribution from the fast-decay component dominating with increase in iron load, similar to that observed in the present study.
Taken together, these data suggest that signal decay curves can be described by inner-sphere and outer-sphere relaxation, but that the “boundary” between these regions depends upon the iron load, interecho spacing, and proton mobility, consistent with the partial-refocusing model advanced by Gillis et al. (16). That is, the division between inner-sphere and outer-sphere behavior is not a static distance produced by physical compartmentalization, but instead increases with longer refocusing interval (τ), decreased proton mobility (D), increased particle size (reff), and increased strength of te magnetic inhomogeneity.
Although a conceptually useful framework, the partial refocusing model still constitutes a two-state approximation to a continuously varying magnetic landscape. Jensen and Chandra’s nonexponential model (15) represents a low-order series expansion to a more general description of iron particle sizes and distributions. Prior application of this model to the data of Bulte et al. (13) and Thomsen et al. (11) demonstrated that effective interparticle size and spacing (L) varied with HIC and with echo spacing. We observed similar dependencies of these parameters with HIC and τ. This implies that the perceived magnetic disturbances are keenly sensitive to the expected diffusion lengths between refocusing pulses. Iron is distributed on multiple scales (Fig. 1), ranging from the tens of nanometers to millimeters. Larger but more sparsely distributed magnetic fluctuations have an increasing influence at longer τ, while contributions from smaller iron deposits are motionally averaged. At shorter τ, large-scale magnetic fluctuations contribute little because of static-refocusing. In short, the combination of multiscale, almost fractal, magnetic field disturbance (Fig. 1) with decreased relaxivity at both extremes of iron scale (produced by motional averaging and static refocusing) creates an effective iron scale that rises with refocusing interval and with tissue iron content.
Individually, the chemical exchange (14), nonexponential (15), and partial refocusing models (16) are incomplete descriptions of observed relaxation behaviors. However, taken together these models provide insight into the fundamental interactions of water protons and iron. This knowledge is a necessary starting point to develop calibration curves for tissues whose direct biopsy validation is impossible or impractical. These data will also be instrumental in designing synthetic phantoms for external iron calibration and may help resolve disparities between different MRI estimates of tissue iron (intersequence and intermachine calibration). Multiecho iron estimation techniques have been used to detect both liver and cardiac iron; these techniques would be anticipated to yield significantly different calibrations than those derived from single echo T2 measurements (34–37). This is particularly relevant for cardiac T2 measurements, which would otherwise be well suited to fast spin echo techniques for breath hold acquisitions. Although single echo techniques are less tuned to iron distribution than CPMG acquisitions, scale sensitivity remains implicit. Increase in effective iron scale with increasing iron load may partially explain the loss of relaxivity observed at extremes of iron loading (37). Further characterization of the variation of anatomic and functional iron scale with iron overload will be necessary to answer this question.
Limitations
Our observed single spin-echo R2 values (in vitro), in the low iron range, are higher (~70 s−1) than that reported in previous in vivo liver tissue studies (9,12). This could be attributed to (1) tissue trauma as a result of extraction using a surgical needle, (2) tissue desiccation resulting from time interval between extraction and conducting NMR experiment, (3) nonlinear relationship between R2 and HIC (9). Moreover, we did observe that the T2 value drops by 10–20% for the same tissue sample if experiments are delayed by approximately 1.5 h, although systematic studies supporting this were not performed. Hence, the method cannot by itself be used for validation of in vivo observations; however, it does provide insight into inner interactions of tissue iron and protons.
Accurate volumetric assessment requires multiple sections at different anatomic levels. While this is relatively straightforward in routine histology, it is financially and temporally impractical for electron microscopy. In a relatively isotropic tissue like the liver, psuedo-random sampling from a single large two-dimensional field of view is a practical alternative. We chose 20 snapshots over a single tissue section since this provided a balance among cost, manual labor for object tracing, and obtaining sufficient number of object counts for histogram construction. Use of two-dimensional techniques introduces a bias toward objects based on their size, complexity, and orientation with respect to section; larger objects have a higher probability of being sampled. We also approximated the lysosomes as spheres in three dimensions (3D) and their equivalent radius was computed by equating their areas to circles in two dimensions (2D). For a random section through a space with 3D objects, the number of profiles per unit area (Na) is not equal to number of objects per unit volume (Nv). Various correction factors like Abercrombie correction can be applied to transform Na to Nv using section thickness and mean object radius (17). The corrections can introduce a bias themselves if one does not have a reliable estimate of the mean object radius. Estimating the mean object size may be especially troublesome when object sizes are irregular and varying. We also did not attempt any complex histogram transformations (2D to 3D estimates) as these also rely on underlying assumptions, which may not be completely true (equivalence to spheres). While we acknowledge the inherent bias in our methodology, the methods are adequate to obtain initial estimates of object size/distribution and to observe changes of these parameters in response to varying iron-load conditions. None of the complex transformations would change the fundamental conclusions of this article.
ACKNOWLEDGMENTS
The authors acknowledge Susan Carson, Debbie Harris, and Cathleen Enriquez for recruiting patients, Rita Alvarez for assistance with sample collection, and Minerva Mongeotti for her help with the electron microscopy.
Grant Sponsor: General Clinical Research Center (National Institutes of Health; Grant Number: RR00043-43; Grant Sponsor: Department of Pediatrics at Childrens Hospital of Los Angeles; Grant Sponsor: National Heart Lung and Blood Institute of the National Institutes of Health; Grant number: 1 R01 HL75592-01A1.
REFERENCES
- 1.Gordeuk VR, Bacon BR, Brittenham GM. Iron overload: causes and consequences. Annu Rev Nutr. 1987;7:485–508. doi: 10.1146/annurev.nu.07.070187.002413. [DOI] [PubMed] [Google Scholar]
- 2.Olivieri NF, Brittenham GM. Iron-chelating therapy and the treatment of thalassemia. Blood. 1997;89:739–761. [PubMed] [Google Scholar]
- 3.Janes CH, Lindor KD. Outcome of patients hospitalized for complications after outpatient liver biopsy. Ann Intern Med. 1993;118:96–98. doi: 10.7326/0003-4819-118-2-199301150-00003. [DOI] [PubMed] [Google Scholar]
- 4.Ambu R, Crisponi G, Sciot R, Van Eyken P, Parodo G, Iannelli S, Marongiu F, Silvagni R, Nurchi V, Costa V, et al. Uneven hepatic iron and phosphorus distribution in beta-thalassemia. J Hepatol. 1995;23:544–549. doi: 10.1016/0168-8278(95)80060-3. [DOI] [PubMed] [Google Scholar]
- 5.Villeneuve JP, Bilodeau M, Lepage R, Cote J, Lefebvre M. Variability in hepatic iron concentration measurement from needle-biopsy specimens. J Hepatol. 1996;25:172–177. doi: 10.1016/s0168-8278(96)80070-5. [DOI] [PubMed] [Google Scholar]
- 6.Brittenham GM, Badman DG. Noninvasive measurement of iron: report of an NIDDK workshop. Blood. 2003;101:15–19. doi: 10.1182/blood-2002-06-1723. [DOI] [PubMed] [Google Scholar]
- 7.Stark DD, Moss AA, Goldberg HI. Nuclear magnetic resonance of the liver, spleen, and pancreas. Cardiovasc Intervent Radiol. 1986;8:329–341. doi: 10.1007/BF02552370. [DOI] [PubMed] [Google Scholar]
- 8.Stark DD, Moseley ME, Bacon BR, Moss AA, Goldberg HI, Bass NM, James TL. Magnetic resonance imaging and spectroscopy of hepatic iron overload. Radiology. 1985;154:137–142. doi: 10.1148/radiology.154.1.3964933. [DOI] [PubMed] [Google Scholar]
- 9.St Pierre TG, Clark PR, Chua-anusorn W, Fleming AJ, Jeffrey GP, Olynyk JK, Pootrakul P, Robins E, Lindeman R. Noninvasive measurement and imaging of liver iron concentrations using proton magnetic resonance. Blood. 2005;105:855–861. doi: 10.1182/blood-2004-01-0177. [DOI] [PubMed] [Google Scholar]
- 10.Westwood MA, Anderson LJ, Firmin DN, Gatehouse PD, Lorenz CH, Wonke B, Pennell DJ. Interscanner reproducibility of cardiovascular magnetic resonance T2* measurements of tissue iron in thalassemia. J Magn Reson Imaging. 2003;18:616–620. doi: 10.1002/jmri.10396. [DOI] [PubMed] [Google Scholar]
- 11.Thomsen C, Wiggers P, Ring-Larsen H, Christiansen E, Dalhoj J, Henriksen O, Christoffersen P. Identification of patients with hereditary haemochromatosis by magnetic resonance imaging and spectroscopic relaxation time measurements. Magn Reson Imaging. 1992;10:867–879. doi: 10.1016/0730-725x(92)90440-b. [DOI] [PubMed] [Google Scholar]
- 12.Wang ZJ, Haselgrove JC, Martin MB, Hubbard AM, Li S, Loomes K, Moore JR, Zhao H, Cohen AR. Evaluation of iron overload by single voxel MRS measurement of liver T2. J Magn Reson Imaging. 2002;15:395–400. doi: 10.1002/jmri.10080. [DOI] [PubMed] [Google Scholar]
- 13.Bulte JW, Miller GF, Vymazal J, Brooks RA, Frank JA. Hepatic hemosiderosis in non-human primates: quantification of liver iron using different field strengths. Magn Reson Med. 1997;37:530–536. doi: 10.1002/mrm.1910370409. [DOI] [PubMed] [Google Scholar]
- 14.Brooks RA, Moiny F, Gillis P. On T2-shortening by weakly magnetized particles: the chemical exchange model. Magn Reson Med. 2001;45:1014–1020. doi: 10.1002/mrm.1135. [DOI] [PubMed] [Google Scholar]
- 15.Jensen JH, Chandra R. Theory of nonexponential NMR signal decay in liver with iron overload or superparamagnetic iron oxide particles. Magn Reson Med. 2002;47:1131–1138. doi: 10.1002/mrm.10170. [DOI] [PubMed] [Google Scholar]
- 16.Gillis P, Moiny F, Brooks RA. On T(2)-shortening by strongly magnetized spheres: a partial refocusing model. Magn Reson Med. 2002;47:257–263. doi: 10.1002/mrm.10059. [DOI] [PubMed] [Google Scholar]
- 17.Mouton P. Principles and practices of unbiased stereology: An introduction for bioscientists. Baltimore: Johns Hopkins University Press; 2002. [Google Scholar]
- 18.Coleman TF, Li YY. On the convergence of reflective newton methods for large-scale nonlinear minimization subject to bounds. Math Program. 1994;67:189–224. [Google Scholar]
- 19.Coleman TF, Li YY. An interior trust region approach for nonlinear minimization subject to bounds. Siam J Optimiz. 1996;6:418–445. [Google Scholar]
- 20.Yamada I, Aung W, Himeno Y, Nakagawa T, Shibuya H. Diffusion coefficients in abdominal organs and hepatic lesions: evaluation with intravoxel incoherent motion echo-planar MR imaging. Radiology. 1999;210:617–623. doi: 10.1148/radiology.210.3.r99fe17617. [DOI] [PubMed] [Google Scholar]
- 21.Liu P, Henkelman M, Joshi J, Hardy P, Butany J, Iwanochko M, Clauberg M, Dhar M, Mai D, Waien S, Olivieri N. Quantification of cardiac and tissue iron by nuclear magnetic resonance relaxometry in a novel murine thalassemia-cardiac iron overload model. Can J Cardiol. 1996;12:155–164. [PubMed] [Google Scholar]
- 22.Colet JM, Pierart C, Seghi F, Gabric I, Muller RN. Intravascular and intracellular hepatic relaxivities of superparamagnetic particles: an isolated and perfused organ pharmacokinetics study. J Magn Reson. 1998;134:199–205. doi: 10.1006/jmre.1998.1501. [DOI] [PubMed] [Google Scholar]
- 23.Rozenman Y, Zou X, Kantor H. Signal loss induced by superparamagnetic iron oxide particles in NMR spin-echo images: the role of diffusion. Magn Reson Med. 1990;14:14–31. doi: 10.1002/mrm.1910140105. [DOI] [PubMed] [Google Scholar]
- 24.Jensen JH, Chandra R. Strong field behavior of the NMR signal from magnetically heterogeneous tissues. Magn Reson Med. 2000;43:226–236. doi: 10.1002/(sici)1522-2594(200002)43:2<226::aid-mrm9>3.0.co;2-p. [DOI] [PubMed] [Google Scholar]
- 25.Anderson LJ, Holden S, Davis B, Prescott E, Charrier CC, Bunce NH, Firmin DN, Wonke B, Porter J, Walker JM, Pennell DJ. Cardiovascular T2-star (T2*) magnetic resonance for the early diagnosis of myocardial iron overload. Eur Heart J. 2001;22:2171–2179. doi: 10.1053/euhj.2001.2822. [DOI] [PubMed] [Google Scholar]
- 26.Gandon Y, Olivie D, Guyader D, Aube C, Oberti F, Sebille V, Deugnier Y. Non-invasive assessment of hepatic iron stores by MRI. Lancet. 2004;363:357–362. doi: 10.1016/S0140-6736(04)15436-6. [DOI] [PubMed] [Google Scholar]
- 27.St Pierre TG, Clark PR, Chua-Anusorn W, Fleming AJ, Jeffrey GP, Olynyk JK, Pootrakul P, Robins E, Lindeman R. Non-invasive measurement and imaging of liver iron concentrations using proton magnetic resonance. Blood. 2005;105:855–861. doi: 10.1182/blood-2004-01-0177. [DOI] [PubMed] [Google Scholar]
- 28.Majumdar S, Zoghbi S, Pope CF, Gore JC. Quantitation of MR relaxation effects of iron oxide particles in liver and spleen. Radiology. 1988;169:653–658. doi: 10.1148/radiology.169.3.3186986. [DOI] [PubMed] [Google Scholar]
- 29.Majumdar S, Zoghbi S, Pope CF, Gore JC. A quantitative study of relaxation rate enhancement produced by iron oxide particles in polyacrylamide gels and tissue. Magn Reson Med. 1989;9:185–202. doi: 10.1002/mrm.1910090205. [DOI] [PubMed] [Google Scholar]
- 30.Majumdar S, Gore JC. Effects of selective pulses on the measurement of T2 and apparent diffusion in multiecho MRI. Magn Reson Med. 1987;4:120–128. doi: 10.1002/mrm.1910040204. [DOI] [PubMed] [Google Scholar]
- 31.Majumdar S, Zoghbi SS, Gore JC. The influence of pulse sequence on the relaxation effects of superparamagnetic iron oxide contrast agents. Magn Reson Med. 1989;10:289–301. doi: 10.1002/mrm.1910100302. [DOI] [PubMed] [Google Scholar]
- 32.Brittenham GM, Farrell DE, Harris JW, Feldman ES, Danish EH, Muir WA, Tripp JH, Bellon EM. Magnetic-susceptibility measurement of human iron stores. N Engl J Med. 1982;307:1671–1675. doi: 10.1056/NEJM198212303072703. [DOI] [PubMed] [Google Scholar]
- 33.Wood JC, Fassler JD, Meade T. Mimicking liver iron overload using liposomal ferritin preparations. Magn Reson Med. 2004;51:607–611. doi: 10.1002/mrm.10735. [DOI] [PMC free article] [PubMed] [Google Scholar]
- 34.Mavrogeni SI, Gotsis ED, Markussis V, Tsekos N, Politis C, Vretou E, Kermastinos D. T2 relaxation time study of iron overload in b-thalassemia. Magma. 1998;6:7–12. doi: 10.1007/BF02662506. [DOI] [PubMed] [Google Scholar]
- 35.Papakonstantinou O, Kostaridou S, Maris T, Gouliamos A, Premetis E, Kouloulias V, Nakopoulou L, Kattamis C. Quantification of liver iron overload by T2 quantitative magnetic resonance imaging in thalassemia: impact of chronic hepatitis C on measurements. J Pediatr Hematol Oncol. 1999;21:142–148. doi: 10.1097/00043426-199903000-00011. [DOI] [PubMed] [Google Scholar]
- 36.Voskaridou E, Douskou M, Terpos E, Papassotiriou I, Stamoulakatou A, Ourailidis A, Loutradi A, Loukopoulos D. Magnetic resonance imaging in the evaluation of iron overload in patients with beta thalassaemia and sickle cell disease. Br J Haematol. 2004;126:736–742. doi: 10.1111/j.1365-2141.2004.05104.x. [DOI] [PubMed] [Google Scholar]
- 37.Thomsen C. Quantitative magnetic resonance methods for in vivo investigation of the human liver and spleen. Technical aspects and preliminary clinical results. Acta Radiol Suppl. 1996;401:1–34. [PubMed] [Google Scholar]


