

Abstract
Close monitoring of liver iron content is necessary to prevent iron overload in transfusion-dependent anemias. Liver biopsy remains the gold standard; however, MRI potentially offers a noninvasive alternative. Iron metabolism and storage is complicated and tissue/disease-specific. This report demonstrates that iron distribution may be more important than iron speciation with respect to MRI signal changes. Simple synthetic analogs of hepatic lysosomes were constructed from noncovalent attachment of horse-spleen ferritin to 0.4 μm diameter phospholipid liposomes suspended in agarose. Graded iron loading was achieved by varying ferritin burden per liposome as well as liposomal volume fraction. T1 and T2 relaxation times were measured on a 60 MHz NMR spectrometer and compared to simple ferritin-gel combinations. Liposomal-ferritin had 6-fold stronger T2 relaxivity than unaggregated ferritin but identical T1 relaxivity. Liposomal-ferritin T2 relaxivity also more closely matched published results from hemosiderotic marmoset liver, suggesting a potential role as an iron-calibration phantom.
Keywords: iron overload, MRI, liver, hemochromatosis, thalassemia, T2, T1, relaxometry, ferritin, microspheres
Iron overload is a serious health problem for patients with transfusion-dependent anemia and inherited disorders of iron metabolism (1). Hepatic iron measured annually or biannually is used as a surrogate for total iron balance to guide chelation therapy (2). Currently, liver biopsy is the only routinely available method for hepatic iron measurement. It is invasive and provides only indirect information regarding other organ systems. A noninvasive technique for quantifying iron content in the liver and other organs would greatly enhance care of iron overload patients.
MRI is a promising tool in this regard because it is sensitive, readily available, and provides information regarding iron content in many organs (3–5). However, inconsistent results from different imaging centers, the inability to quantify higher body iron loads, and methodological inaccuracies have limited clinical use of MRI for iron quantitation (6). There is consensus that an external phantom mimicking iron-laden liver might ameliorate intermachine and intersequence differences through generation of standard calibration curves (6). In addition, a phantom would facilitate MR sequence development and validation. Currently, new MR strategies for iron quantitation must be evaluated on patients undergoing liver biopsy; this process is expensive and can only be performed at institutions having a large iron-overload population base. A phantom would greatly shorten the “design cycle” by allowing parameters such as voxel size, repetition time, flip angle, and echo time to be optimized without the need for living subjects.
Phantom development has been complicated by the complexity and variability of liver iron storage; simple iron compounds have failed to mimic in vivo relaxivities (7). Preferential iron storage is observed in the reticuloendothelial system initially, with progressive hepatocyte storage as total body iron burden increases. At low iron burdens, iron is predominantly bound to ferritin, either as free molecules or small clusters measuring ~50–70 nm (8,9). Ferritin levels increase with iron loading, as does the iron binding per ferritin molecule (10). Cytosolic-ferritin also exchanges with lysosomal-ferritin. Over time, lysosomal enzymes gradually denature the ferritin molecules, making them insoluble and metabolize the protein component, producing amorphous, electron-dense hemosiderin. Although virtually absent in normal cells, hemosiderin becomes the dominant iron-storage compound with iron overload, forming 80% of total intracellular iron (9,10). Hemosiderin deposits are irregular, amorphous, and much larger than ferritin, reaching up to 500 nm in some cases (8,9). The siderosomes themselves also act as an “iron particle,” ranging in size from 100–2000 nm (8,9). Several ferritin isoforms exist, and there are tissue- and disease-specific variations in their quantities. Hemosiderin is not well characterized and represents multiple ferritin breakdown products. Mössbauer spectroscopy of iron overloaded specimens reveals a variation in mineral speciation of the iron oxide components of hemosiderin, with subtle differences in the hyperfine structure depending on the mechanism of iron deposition and target organ (11).
Despite the numerous forms of iron found within the liver, we postulate that iron spatial distribution rather than iron speciation primarily determines transverse relaxivity of iron-laden liver. Specifically, we hypothesize that 1) compartmentalization of ferritin breakdown products within lysosomes produces the large R2/R1 ratios observed in animal studies (12,13), and 2) this behavior can be modeled by relatively simple phantoms. To test this hypothesis, we describe measurements from synthetic “ferrosomes” consisting of ferritin bound to the surface of liposomes. We compared the R1 and R2 behavior of these compounds to R1 and R2 measured from ferritin-containing gels as well as published values measured from iron overloaded marmoset livers.
MATERIALS AND METHODS
Liposome suspensions were prepared using the cationized liposome synthesis methods proposed by Velev (14). Typically, L-α-phosphatidylcholine (PC; 85 mg) from egg yolk, L-α-phosphatidylcholine dipalmitoyl (DPPC; 15 mg), and cationic surfactant hexadecyltrimethylammonium bromide (HTAB; 27 mg, 35 mol%) are employed. These were dissolved with 2:1 CHCl3/MeOH to ensure homogeneity and dried to a thin film using rotary evaporation or lyophilization. Films were rehydrated and swelled by adding degassed distilled H2O to obtain lipid concentrations of 10–30 mg/mL and hand shaking under an argon atmosphere above the lipid melting point, Tm (41°C). Lipid films were allowed to swell for at least 30 min and subjected to 3–5 freeze–thaw cycles in liquid nitrogen. Liposome sizing was performed using polycarbonate membrane extrusion with at least 13 passes though a 0.4-micron PC membrane (Avanti Polar Lipids, Pelham, AL). Extrusion gave mixtures with uniform size distributions as observed under a 400 power microscope. All liposome mixtures were stored at 4°C under argon when not in use.
A stock solution of horse spleen ferritin (77 mg/mL in buffered saline; Sigma Chemical, St. Louis, MO) was used for mixing with the liposome suspensions. Iron content for this solution was 20.7 mg Fe/ml solution as measured by atomic absorption spectroscopy. Addition of ferritin solutions to the liposomal preparations produced ferritin-liposomal complexes that settled spontaneously and with centrifugation. The amount of unbound-ferritin was assessed through T1 measurements or colorimetric assay of the resulting supernatant. Clear supernatants corresponded to T1 values greater than 3000 ms. Given our observed T1 relaxivity of 0.45 sec−1/(mg(Fe)/g, and assuming T1 of pure water to be 4000 ms, this placed an upper bound of 0.177 mg/g on the total unbound iron when clear supernatant was present. Ferritin-liposome association was complete for ferritin concentrations up to 0.41 mg ferritin per gram of lipid substrate in the aforementioned lipid ratios. Visible saturation was observed for higher ferritin concentrations and confirmed by supernatant T1 values <3000.
Iron concentrations of the suspensions were varied by changing the volume fraction of saturated liposomes. Liposomes were spun lightly (<30 sec) and clear supernatant was decanted to achieve 1.5 times the highest concentrated suspension needed. The concentrated liposome preparation was kept above 45°C and mixed with degassed distilled water to dilute the suspension to 1.5 times the desired final concentration at 187 μL. Agarose (4.5%; 93 μL) prepared with degassed water was added to prepare a gel of the desired final concentration with a total volume of 280 μL. Transfer to NMR sample tubes was performed under argon via a warm, long pipette ensuring that bubbles were not transferred. Samples were cooled immediately in ice to cause rapid gelling, thereby preventing liposomal settling.
Measurements of R1 and R2 relaxation times were made at 40°C using a 60 MHz NMR spectrometer (Bruker 60 MHz Minispec mq series relaxometer). R2 relaxation times were determined using Carr–Purcell–Meiboom–Gill (CPMG) sequence, recycle time 10 sec, eight averages with phase cycling, and 180° degree pulse separation of 1 ms. Mono-exponential fitting was performed to even-echoes over 250 ms acquisition window. R1 relaxation was estimated using inversion recovery techniques, recycle time 10 sec, four averages with phase cycling, and eight inversion times logarithmically spaced over the interval 0–2000 ms. Linear regression between R1 and R2 and iron concentration was performed using standard techniques.
RESULTS
Since ferritin represents the major iron precursor molecule for intracellular iron stores, the relaxivity of ferritin in agarose gel was used as a reference. R2 was linear with agarose concentration from 0.5–4%, with a slope of 12.4 sec−1/(%agarose) and an intercept of −1.95 sec−1, r = 0.996 (not shown). A 1.5% agarose gel was chosen because it was easy to manipulate and yielded a “background” R2 comparable to noniron-overloaded liver (12). Figure 1 demonstrates transverse relaxation, R2, for ferritin in 1.5% agarose gel (filled square symbols). R2 increases approximately linearly with ferritin concentration, with a slope of 4.5 sec−1/(mg(Fe)/g). Ferritin’s relaxivity was relatively weak compared with published animal data; the regression line calculated from iron-overloaded marmoset liver data is shown for comparison, having a slope of 16.9 sec−1/(mg(Fe)/g) and an intercept of 10.6 sec−1 (12).
FIG. 1.
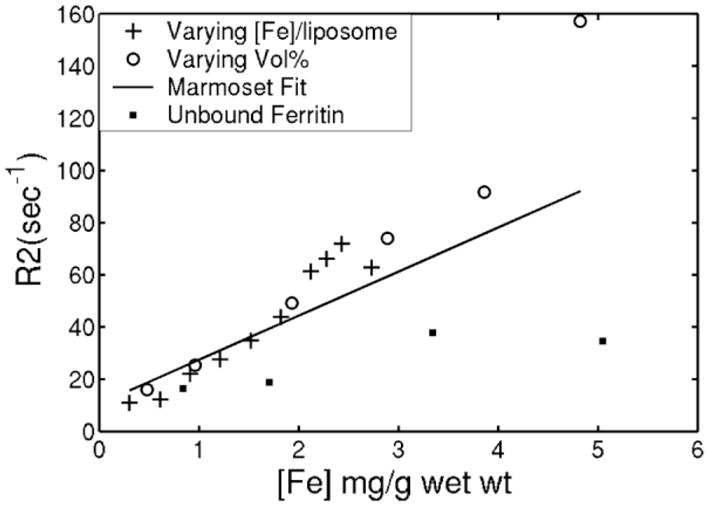
R2 as a function of iron concentration for unbound ferritin dispersion in 1.5% agarose gel (filled square symbols). Linear regression for these data demonstrate a slope of 4.5 sec−1/mg(Fe)/g gel and an R2-intercept of 14.2 sec−1. Dotted line reflects regression line calculated from iron overloaded marmoset liver, having a slope of 16.9 sec−1/(mg(Fe)/g wet wt) and R2-intercept of 10.6 sec−1 (12). Other symbols indicate the relationship between R2 and iron concentration for liposomally bound ferritin dispersion in 1.5% agarose gel. Iron was increased by increasing liposomal iron loading (+ signs) at fixed liposomal volume fraction or by varying liposomal volume fraction with fixed liposomal iron burden (circles). Both mechanisms yield similar, near-linear relationships with slopes of 24–27 sec−1/mg(Fe)/g, nearly 6-fold stronger relaxation than unaggregated ferritin and better agreement with marmoset data.
Figure 1 demonstrates R2 of liposomal-bound ferritin in 1.5 % agarose as a function of total iron concentration. Iron density was varied by increasing ferritin content per liposome (+ signs) or by increasing the number of iron-saturated liposomes (open circles). R2 increased linearly in both cases, with comparable slope. The slope of this relationship was 6-fold steeper than unbound ferritin, proving that aggregation is the dominant determinant of R2 relaxation. Liposomal preparations not having associated ferritin (blank liposomes) produced negligible R2 effects over a wide range of liposome and surfactant concentrations (not shown). Liposomal-ferritin more closely approximated the marmoset data than simple ferritin gels.
Figure 2 compares the R1 values from the samples described in Fig. 1. Unlike transverse relaxivity, the longitudinal relaxivities were identical for free and liposome-bound ferritin preparations. R1 increased linearly with total iron concentration, having a slope of 0.45 sec−1/(mg(Fe)/g). Unbound ferritin gels had R2/R1 ratios that were ~27 at iron concentrations of 1 mg/g, but decreased to 14 at 3 mg/g, significantly lower than observed in animal models (12,13). The liposomal-ferritin preparations, in contrast, exhibited R2/R1 slopes that increased steadily from 21 at low concentration (0.3 mg/g wet wt) to a maximum of 45 (not shown).
FIG. 2.
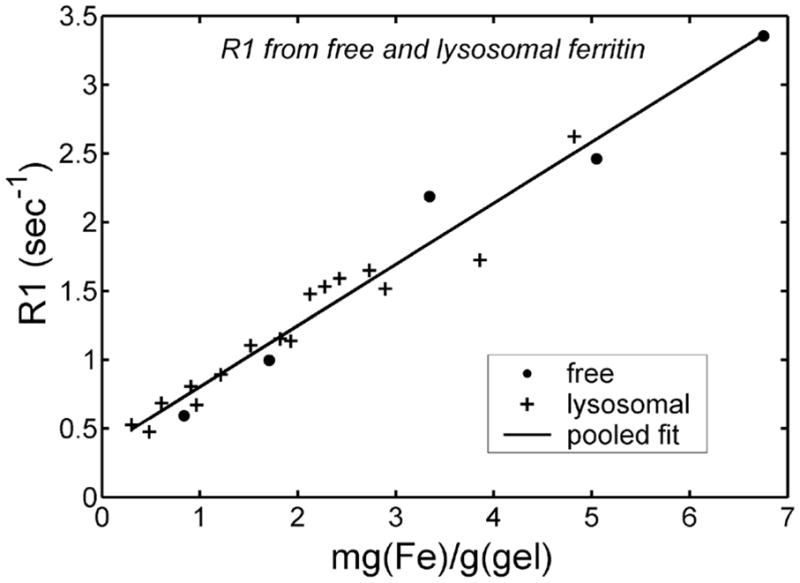
R1 as a function of iron concentration for “free” and liposomal-ferritin dispersions in gel. No significant R1 difference is seen between free and liposomally bound ferritin gels. Pooled regression line is also shown.
The liposome preparations show reasonable reproducibility and stability. A single lipid preparation was used to create two liposome batches, 48 hr apart; the second blank liposome aliquot was stored in a 4°C refrigerator before combination with ferritin. The two curves were nearly identical, with a mean absolute difference of 1.6%. In contrast, greater slope variability was observed between lipid batches, with slopes ranging from 21–27 sec−1/(mg(Fe)/g). Longitudinal stability was demonstrated in two preparations tested 6 months apart, with mean absolute differences of 2.9% and 8.4%.
The measured values of R2 vary significantly with inter-echo spacing. Figure 3 demonstrates this relationship for liposomal-ferritin preparations at six different iron loads. R2 increases steeply with interecho spacing from 0.1–0.5 ms and less sharply from 0.5–2 ms; the strength of this interaction increases with iron concentration. The relationship between R2 and iron concentration was generally linear for iron concentration <4 mg/g wet weight, but the highest iron concentration (4.82 mg Fe/g) yielded a higher R2 value than predicted for a linear relationship (not shown).
FIG. 3.
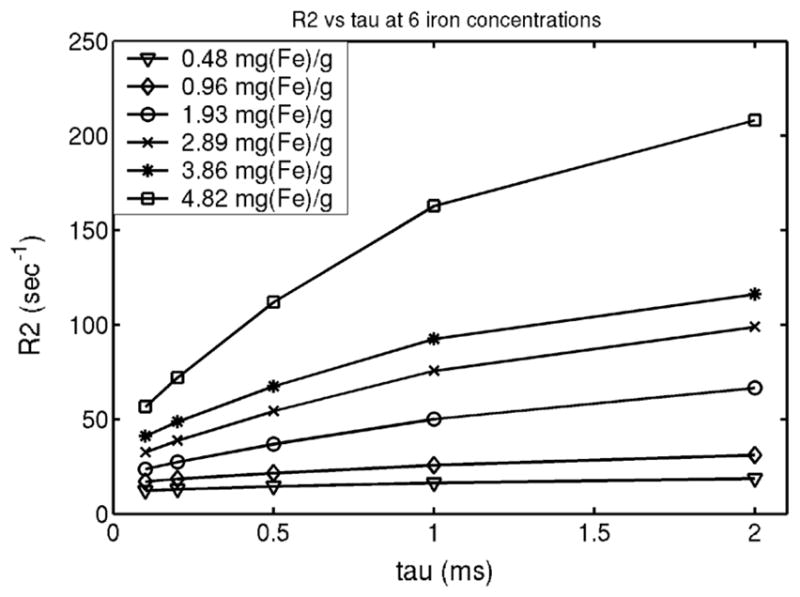
R2 as a function of interecho spacing for six different iron concentrations.
DISCUSSION
The purpose of this work was to determine whether aggregation of ferritin and suspension in polymers could produce R2 and R1 changes comparable to those observed in iron-laden liver (7,12,13). Ferritin dispersions in gel produced weak R2 relaxation. In contrast, liposomal-ferritin had 6-fold stronger R2 relaxivity than unbound ferritin and the R2 relaxivity slope was nearly 50% steeper than that observed for liver iron in animal studies (12). However, in vivo studies represent a weighted contribution from siderosomes and more weakly relaxing iron species such as ferritin and heme proteins; these weaker iron species represent ~20% of the total iron (9,10). Alternatively, the synthetic liposomes may be more efficient R2 relaxation agents than in vivo siderosomes of the same iron concentration. The slope of R2 vs. iron concentration may be influenced by many factors, including: 1) the number of ferritin molecules per liposome, 2) liposome size, 3) secondary structure with the gel (or tissue), and 4) intraliposomal vs. extraliposomal location of the ferritin molecules.
The relationship between R2, the number of ferritin molecules per liposome and liposome size is unknown. If the magnetic field disturbance on the liposome surface, δω is proportional to the number of ferritin molecules per liposome, then a quadratic relationship should be observed between R2 and the iron concentration (15,16). Alternatively if δω is proportional to the number of ferritin molecules per unit liposomal surface area, then R2 should have a linear relationship with iron concentration. Unfortunately, saturation effects limit the range of liposomal iron concentrations that could be studied, making it impossible to conclusively distinguish between these models. In our model, however, changes in R2 relaxivity were similar whether the iron concentration increased by increasing the iron per liposome, or by increasing the number of liposomes (volume fraction).
Liposomal size may also influence transverse relaxivity. Monte Carlo simulations and experimentation demonstrate a parabolic dependence of R2 on length scale of magnetic susceptibility variations (17), with maximal relaxivity when this length scale is comparable to water diffusion distances traveled by water during the proton relaxation time. The 0.4 μm liposomes were chosen because they are within the range of in vivo liposome radii (8). However, size mismatch between our preparation and in vivo iron distribution could account for the slope differences observed in Fig. 1. A more thorough characterization of in vivo and in vitro size distributions are warranted in future studies.
An alternative explanation is that secondary structure within real liver specimens caused by cell boundaries and extracellular matrix may influence transverse relaxivity through larger-scale “aggregation” (12). For example, hepatocytes are siderosome-rich relative to endothelial cells and bile canniliculi. These variations are on the order of 20–40 μm. Spacing between reticuloendothelial cells is ~350–400 μm (18). Larger-scale variations in secondary structure can significantly attenuate R2 relaxivity of iron species (18). The homogeneity of our liposomal-ferritin distribution, relative to in vivo iron distribution, may account for the more powerful R2 relaxivity observed. Finally, the synthetic liposomes are “paramagnetic shells,” while siderosomes are closer to “paramagnetic spheres.” Based on Gauss’s law, the static field disturbance from a paramagnetic spherical shell can be represented by a solid paramagnetic sphere of identical bulk susceptibility. If water exchange across the liposomes is slow relative to water diffusion time, and if proton signal from within the liposomes is small relative to external protons, then spherical shells should not have intrinsically higher transverse relaxivity than solid spheres with the same net iron mass and radius.
The R2 increase with interecho spacing has been well described for paramagnetic species. The asymptotic behavior of Figure 3 suggests an intermediate regime between long echo-spacing and short-echo spacing limits. Interestingly, R2 enhancement with increasing interecho spacing may provide an alternative route to quantitate iron (19). More importantly, a robust iron phantom will need to describe not only single-echo R2 vs. iron relationships but R2 vs. tau behavior as well. Otherwise, multiecho iron estimation techniques may give very different results when compared with single spin echo techniques for the same phantom. Currently, R2 vs. tau behavior is unknown for iron-overloaded liver and is actively being studied in our laboratory. The agarose gels used in these experiments have higher water mobility than human tissue; cross-linked gels may be necessary to match in vivo R2-tau data.
In contrast to R2, ferritin R1 relaxivity was completely unaffected by surface-association with the liposomes. These observations are not surprising, since ferritin is readily accessible to interact with diffusing water molecules. In contrast, when paramagnetic molecules are encapsulated within liposomes, the water exchange across the membrane may limit the longitudinal relaxation (20). It is possible an analogous situation may exist in vivo, because insoluble hemosiderin iron is generally stored within liposomes. Despite the “exaggerated” R1 effect, the iron-induced R1 fluctuations in this study are small compared with intrinsic liver R1 variation. For this reason, R1 methods have been less sensitive than R2 methods for liver iron quantitation (4,7,12,13).
The liposomal preparation techniques were stable and reproducible for any given lipid preparation. Greater variability was observed between lipid preparations prepared on different days, with a 20% maximum variation in observed slopes of R2 against iron concentration. The source of this variation is unclear, but may reflect differences in liposomal size or distribution from batch to batch. Further work is necessary to characterize and eliminate the sources of variation. Alternatively, it is worth examining other mechanisms to aggregate and distribute ferritin in a controlled manner. One possible approach is to covalently link ferritin to polystyrene beads because these preparations can be rigorously sized and are likely to be more stable. These compounds are the focus of ongoing research.
In summary, we have shown that it is feasible to prepare synthetic analogs of iron-laden liver. Future characterization of the effects of particle size, particle distribution, and matrix composition will improve our basic understanding of the effects of tissue iron on MRI measurements. Compound synthesis will be complemented by Monte Carlo simulation to increase the range and detail of the parameter comparisons. Ongoing studies using electron microscopy and NMR relaxometry from human liver biopsy studies will provide the iron distribution and precise relaxometry data necessary to construct a suitable phantom. Ultimately, the goal is to have a sufficiently accurate physical model description that calibration to an external phantom can be performed without the use of liver biopsy. However, even if liver biopsies cannot be eliminated because of intrinsic interpatient heterogeneity of iron distribution, the need for biopsy is likely to decrease with a reliable MR hemosiderosis phantom.
Acknowledgments
Grant sponsors: the Zumberger Foundation and the Department of Pediatrics, Childrens Hospital, Los Angeles.
This work was supported by the Zumberger Foundation and by the Department of Pediatrics, Childrens Hospital, Los Angeles.
References
- 1.Gordeuk VR, Bacon BR, Brittenham GM. Iron overload: causes and consequences. Annu Rev Nutr. 1987;7:485–508. doi: 10.1146/annurev.nu.07.070187.002413. [DOI] [PubMed] [Google Scholar]
- 2.Olivieri NF, Brittenham GM. Iron-chelating therapy and the treatment of thalassemia. Blood. 1997;89:739–761. [PubMed] [Google Scholar]
- 3.Housman JF, Chezmar JL, Nelson RC. Magnetic resonance imaging in hemochromatosis: extrahepatic iron deposition. Gastrointest Radiol. 1989;14:59–60. doi: 10.1007/BF01889156. [DOI] [PubMed] [Google Scholar]
- 4.Liu P, Henkelman M, Joshi J, Hardy P, Butany J, Iwanochko M, Clauberg M, Dhar M, Mai D, Waien S, Olivieri N. Quantification of cardiac and tissue iron by nuclear magnetic resonance relaxometry in a novel murine thalassemia-cardiac iron overload model. Can J Cardiol. 1996;12:155–164. [PubMed] [Google Scholar]
- 5.Anderson LJ, Holden S, Davis B, Prescott E, Charrier CC, Bunce NH, Firmin DN, Wonke B, Porter J, Walker JM, Pennell DJ. Cardiovascular T2-star (T2*) magnetic resonance for the early diagnosis of myocardial iron overload. Eur Heart J. 2001;22:2171–2179. doi: 10.1053/euhj.2001.2822. [DOI] [PubMed] [Google Scholar]
- 6.Brittenham GM, Badman DG. Noninvasive measurement of iron: report of an NIDDK workshop. Blood. 2003;101:15–19. doi: 10.1182/blood-2002-06-1723. [DOI] [PubMed] [Google Scholar]
- 7.Engelhardt R, Langkowski JH, Fischer R, Nielsen P, Kooijman H, Heinrich HC, Bucheler E. Liver iron quantification: studies in aqueous iron solutions, iron overloaded rats and patients with hereditary hemochromatosis. Magn Reson Imag. 1994;12:999–1007. doi: 10.1016/0730-725x(94)91230-t. [DOI] [PubMed] [Google Scholar]
- 8.Iancu TC, Deugnier Y, Halliday JW, Powell LW, Brissot P. Ultrastructural sequences during liver iron overload in genetic hemochromatosis. J Hepatol. 1997;27:628–638. doi: 10.1016/s0168-8278(97)80079-7. [DOI] [PubMed] [Google Scholar]
- 9.Richter GW. Studies of iron overload. Rat liver siderosome ferritin. Lab Invest. 1984;50:26–35. [PubMed] [Google Scholar]
- 10.Zuyderhoudt FM, Sindram JW, Marx JJ, Jorning GG, van Gool J. The amount of ferritin and hemosiderin in the livers of patients with iron-loading diseases. Hepatology. 1983;3:232–235. doi: 10.1002/hep.1840030216. [DOI] [PubMed] [Google Scholar]
- 11.St Pierre TG, Chua-Anusorn W, Webb J, Macey D, Pootrakul P. The form of iron oxide deposits in thalassemic tissues varies between different groups of patients: a comparison between Thai beta-thalassemia/hemoglobin E patients and Australian beta-thalassemia patients. Biochim Biophys Acta. 1998;1407:51–60. doi: 10.1016/s0925-4439(98)00026-x. [DOI] [PubMed] [Google Scholar]
- 12.Bulte JW, Miller GF, Vymazal J, Brooks RA, Frank JA. Hepatic hemosiderosis in non-human primates: quantification of liver iron using different field strengths. Magn Reson Med. 1997;37:530–536. doi: 10.1002/mrm.1910370409. [DOI] [PubMed] [Google Scholar]
- 13.Stark DD, Bass NM, Moss AA, Bacon BR, McKerrow JH, Cann CE, Brito A, Goldberg HI. Nuclear magnetic resonance imaging of experimentally induced liver disease. Radiology. 1983;148:743–751. doi: 10.1148/radiology.148.3.6192464. [DOI] [PubMed] [Google Scholar]
- 14.Velev OD. Assembly of protein structures on liposomes by non-specific and specific interactions. Adv Biophys. 1997;34:139–157. doi: 10.1016/s0065-227x(97)89637-2. [DOI] [PubMed] [Google Scholar]
- 15.Gillis P, Koenig SH. Transverse relaxation of solvent protons induced by magnetized spheres: application to ferritin, erythrocytes, and magnetite. Magn Reson Med. 1987;5:323–345. doi: 10.1002/mrm.1910050404. [DOI] [PubMed] [Google Scholar]
- 16.Brooks RA. T(2)-shortening by strongly magnetized spheres: a chemical exchange model. Magn Reson Med. 2002;47:388–391. doi: 10.1002/mrm.10064. [DOI] [PubMed] [Google Scholar]
- 17.Weisskoff RM, Zuo CS, Boxerman JL, Rosen BR. Microscopic susceptibility variation and transverse relaxation: theory and experiment. Magn Reson Med. 1994;31:601–610. doi: 10.1002/mrm.1910310605. [DOI] [PubMed] [Google Scholar]
- 18.Tanimoto A, Oshio K, Suematsu M, Pouliquen D, Stark DD. Relaxation effects of clustered particles. J Magn Reson Imag. 2001;14:72–77. doi: 10.1002/jmri.1153. [DOI] [PubMed] [Google Scholar]
- 19.Gomori JM, Grossman RI, Drott HR. MR relaxation times and iron content of thalassemic spleens: an in vitro study. AJR Am J Roentgenol. 1988;150:567–569. doi: 10.2214/ajr.150.3.567. [DOI] [PubMed] [Google Scholar]
- 20.Fossheim SL, Fahlvik AK, Klaveness J, Muller RN. Paramagnetic liposomes as MRI contrast agents: influence of liposomal physico-chemical properties on the in vitro relaxivity. Magn Reson Imag. 1999;17:83–89. doi: 10.1016/s0730-725x(98)00141-6. [DOI] [PubMed] [Google Scholar]