Abstract
Age-associated memory impairment (AAMI) occurs in many mammalian species, including humans. In contrast to Alzheimer's disease (AD), in which circuit disruption occurs through neuron death, AAMI is due to circuit and synapse disruption in the absence of significant neuron loss and thus may be more amenable to prevention or treatment. We have investigated the effects of aging on pyramidal neurons and synapse density in layer III of area 46 in dorsolateral prefrontal cortex of young and aged, male and female rhesus monkeys (Macaca mulatta) that were tested for cognitive status through the delayed non-matching-to-sample (DNMS) and delayed response tasks. Cognitive tests revealed an age-related decrement in both acquisition and performance on DNMS. Our morphometric analyses revealed both an age-related loss of spines (33%, p < 0.05) on pyramidal cells and decreased density of axospinous synapses (32%, p < 0.01) in layer III of area 46. In addition, there was an age-related shift in the distribution of spine types reflecting a selective vulnerability of small, thin spines, thought to be particularly plastic and linked to learning. While both synapse density and the overall spine size average of an animal were predictive of number of trials required for acquisition of DNMS (i.e., learning the task), the strongest correlate of behavior was found to be the head volume of thin spines, with no correlation between behavior and mushroom spine size or density. No synaptic index correlated with memory performance once the task was learned.
Introduction
The dorsolateral prefrontal cortex (dlPFC) of nonhuman primates is highly vulnerable to aging. This vulnerability is reflected in both cognitive decline (Gallagher and Rapp, 1997; Moss et al., 1999) and structural alterations in Brodmann area 46, such as spine loss (Duan et al., 2003), loss of subcortical white matter (Peters and Sethares, 2002; Peters and Rosene, 2003), and synapse loss (Peters et al., 1998b, 2008). Unlike Alzheimer's disease (AD) in humans, in which extensive neuron loss occurs in dlPFC (Morrison and Hof, 1997; Bussière et al., 2003), these alterations occur in the absence of significant neuron loss in dlPFC of aged rhesus monkey (Peters et al., 1998a). Nonetheless, certain alterations correlate with the degree of cognitive decline in individual monkeys (Makris et al., 2007; Peters et al., 2008).
Our recent analyses of the interactive effects of estrogen treatment and aging in area 46 of ovariectomized female rhesus monkeys have highlighted the selective vulnerability of a particular class of spines. We demonstrated that the thin spines with small spine heads on layer III pyramidal neurons are particularly vulnerable to aging, and this same class of spines/synapses is restored by estrogen treatment (Hao et al., 2007), as is cognitive performance (Rapp et al., 2003; Hao et al., 2007). In vivo imaging studies in rodent neocortex have demonstrated that small spines are NMDA receptor (NMDAR) dominated, highly motile, and capable of expanding and stabilizing or retracting, whereas large spines are highly stable and AMPAR dominated (Matsuzaki et al., 2001; Kasai et al., 2003; Zuo et al., 2005; Holtmaat et al., 2006; Bourne and Harris, 2007). These observations lead to the hypothesis that small spines are required for learning new information, whereas the large stable spines mediate stable circuits linked to memory (Kasai et al., 2003; Bourne and Harris, 2007; Kasai et al., 2010). We have hypothesized that this conceptual framework may be particularly relevant to area 46 of rhesus monkey (Hao et al., 2007). The dlPFC plays a dominant role in goal-directed behavior (Goldman-Rakic, 2002; Fuster, 2008) and mediates both learning “the rules of the game” and dynamically updating those rules as contingencies are altered (Miller et al., 2002). Such complex functions are likely to require dynamic shifts in synaptic inputs dependent on extensive availability, turnover, and potential stabilization of the small, plastic spines. We have hypothesized that the age-related loss of such spines results in the loss of plasticity essential for optimal function of dlPFC.
The current study was designed to test this hypothesis in gonad-intact young and aged rhesus monkeys with no hormone manipulations. By performing an unbiased classification of large numbers of spines based on previously published criteria (Sorra and Harris, 2000), the spines were separated into thin and mushroom types. Though both synapse number and overall spine size were predictive of one particular domain of cognitive performance, acquisition of delayed non-matching-to-sample (DNMS), the correlation was driven solely by the subclass of thin spines.
Materials and Methods
Animals.
All experiments were conducted in compliance with the National Institutes of Health Guidelines for the Care and Use of Experimental Animals approved by the Institutional Animal Care and Use Committee at the University of California–Davis and Mount Sinai School of Medicine.
Six young adult (age range, 9–14 years old; mean, 10.8 ± 0.8 years old; 4 females, 2 males) and nine aged (age range, 22–35 years old; mean, 30.2 ± 1.5 years old, 7 females, 2 males) rhesus monkeys (Macaca mulatta) were used in the behavioral phase of this study and electron microscopic analyses, and a subset of nine (4 aged, 5 young) were used in the morphometric analyses of filled neurons (see below). Behavioral testing extended over ∼2 years.
Delayed response test.
The delayed response (DR) testing was equivalent to the approach used in our previous studies (Rapp et al., 2003; Hao et al., 2007). Subjects watched from behind a transparent screen while one of the wells of the apparatus was baited with a food reward, and both wells were then covered. During initial training, the screen was raised immediately, allowing monkeys to displace the cover and retrieve the reward if the correct location was chosen. Testing continued until animals met a criterion of 90% correct or better across nine consecutive blocks of 10 trials. For the next phase of testing, a 1 s retention interval was imposed between baiting the well and the opportunity to respond. Delays were implemented by lowering an opaque screen such that the monkey could no longer see the reward wells. Training with a 1 s delay continued until the monkey reached criterion (≥90% correct over 90 trials), and the demands on memory were then made progressively more difficult by imposing successively longer retention intervals of 5, 10, 15, 30, and 60 s. Each delay was tested for a total of 90 trials [30 trials/daily session; intertrial interval = 20 s].
DNMS test.
DNMS testing was conducted as described in detail previously (Rapp and Amaral, 1991; Rapp et al., 2003). Briefly, a sample object was placed over the baited central well of the test tray and after a response, the opaque barrier was lowered to impose a predesignated retention interval. The same item was then presented simultaneously with a novel object that covered the food reward. Objects were drawn from a large enough pool such that the paired object was novel on every trial. During the acquisition phase, a 10 s retention interval was used until the monkeys learned the nonmatching rule to a criterion of 90% correct or better (across 100 trials, 20 trials/d, intertrial interval = 30 s throughout testing). Once the monkeys reached criterion, DNMS performance was measured by increasing the demand on recognition memory with successively longer delays of 15, 30, 60, and 120 s (100 trials total at each delay, 20 trials/d) and 600 s (50 trials total, 5 trials/d).
Perfusion and tissue preparation.
Rhesus monkeys were perfused transcardially in groups of two or three as they completed their behavioral assessments. If all behavioral data had been acquired but perfusion was not able to be scheduled immediately, monkeys continued mock training up until the day before perfusion to avoid testing-induced variability. All animals were deeply anesthetized with ketamine hydrochloride (25 mg/kg) and pentobarbital (20–35 mg/kg, i.v.), intubated, and mechanically ventilated. The chest was opened to expose the heart and 1.5 ml of 0.5% sodium nitrate was injected into the left ventricle to facilitate vasodilation. The descending aorta was clamped immediately following intubation, and the monkeys were perfused transcardially with cold 1% paraformaldehyde in 0.1 m phosphate buffer (PB; pH 7.2) for 2 min, followed by 4% paraformaldehyde in 0.1 m PB at 250 ml/min for 10 min, after which the flow rate was reduced to 100 ml/min for 50 min.
After perfusion, the brain was removed from the skull and dissected into standardized blocks, taking care to include the entire region surrounding the principal sulcus (Brodmann's area 46) in the frontal block. The frontal block was postfixed for 6 h in 4% paraformaldehyde with 0.125% gluteraldehyde in PB and then cut serially on a Vibratome. Every 1.3 mm of tissue was divided into one 400-μm-thick section, flanked by 200 μm sections on each side, with the remainder cut into 50 μm sections, with the same sequence repeated throughout the frontal block. Thereby, a series of 400-μm-thick sections within area 46 were collected for intracellular injection of Lucifer yellow (LY; Invitrogen), while a systematic random set of 200 μm sections were embedded for electron microscopy (EM), and the 50 μm sections were stored at −20° for light microscopic immunohistochemistry. Since the precise position of the first slab is random, this results in a systematic random series of at least eight sections throughout area 46 available for cell loading. Multiple sections are used to obtain the total number of cells, such that the sampled neurons represent a random selection throughout area 46.
Quantitative analyses of spine density and spine morphology.
Nine of the 15 monkeys had undergone optimal perfusion and could be used for cell filling. Intracellular injection of layer III pyramidal cells with LY and quantitative analysis was performed according to methods previously described (Hao et al., 2007). Printed datasets of dendritic tree maps were used to allow identification of dendritic segments chosen in a systematic-random fashion for spine analysis, as described in our previous studies (Hao et al., 2006, 2007). A clear acetate sheet, containing a series of scaled concentric rings 60 μm apart was placed over the working maps of neuronal reconstructions, with the cell soma at the center. Points of intersection between dendritic branches and the circles were used to identify those segments to be used for high-magnification microscopic spine analysis. Consequently, although the somata of the sampled cells were always located in layer III, the dendritic segments chosen for analysis were located in layers I through III, with occasional basal dendrites extending into layer V. Confocal z-stacks of identified intersections were captured on a Zeiss LSM 410. Each designated segment (25–50 μm in length) was located in the microscope field, and confocal stacks of 100–300 digital images separated by a z-step of 0.1 μm were captured using a Plan-Apochromat 100×/1.4 NA Zeiss oil-immersion objective (Fig. 1A). LY was excited with an Ar/Kr laser at 488 nm (attenuation set at 10). All confocal stacks included at least 1 μm above and below the identified dendritic segment. Settings for pinhole size, aperture gain, and offset were optimized initially and then held constant throughout the study to ensure that all images were digitized under the same illumination conditions at a resolution of 256 × 256 pixels. An average of 12 high-magnification z-stacks were captured per neuron (total 39 neurons). The confocal stacks were deconvolved with AutoDeblur (Media Cybernetics) (Fig. 1B) and imported to NeuronStudio for three-dimensional (3D) spine density and spine size analysis (Rodriguez et al., 2008) (Fig. 1C). All spine measurements (total 21,000 spines) were performed in 3D from the z-stacks. The density was calculated by dividing the total number of spines present by the dendritic length of the segment. The automated measures of spine volume, spine head diameter, and spine length were then imported into Matlab for classification of spines into thin and mushroom types based on categories previously established from serial section EM reconstruction of dendritic segments (Sorra and Harris, 2000) (Fig. 1D). A spine was labeled thin if its head was <0.6 μm in diameter and had a maximum length that was at least twice as big as the head diameter. A spine was classified as mushroom if its head diameter exceeded 0.6 μm. The remainder of spines were classified as “other.” This group presumably contained primarily stubby spines. However, because stubby spines are classified based on the absence of a neck (Sorra and Harris, 2000) and because no data were available for this index, no further analysis was performed on this group of spines. All spines included in this study had a clear head, though in some instances the head swelling was more evident from an increase in fluorescence than an increase in diameter (see Figs. 6E, 8B, inset). Thus it is unlikely that filopodia [long and thin protrusions without spine heads (Grutzendler et al., 2002)] contributed to the spine density and size measurements.
Figure 1.
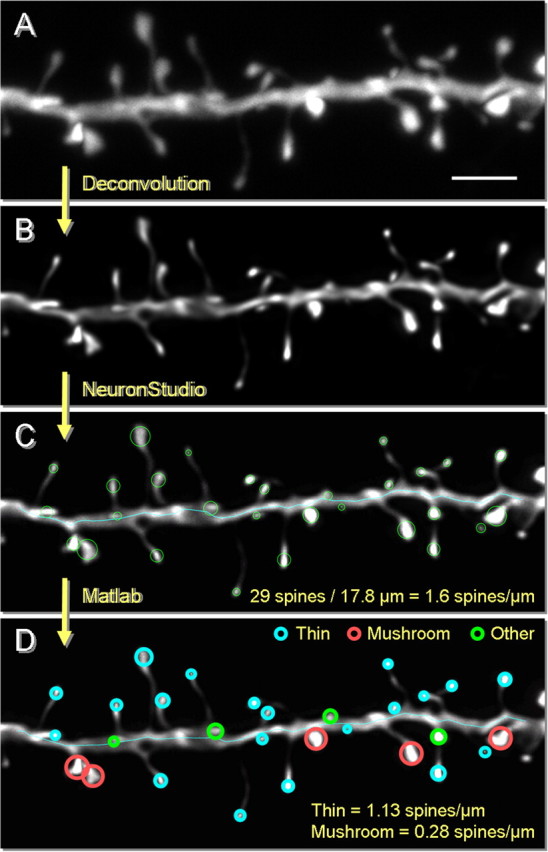
Dendritic segment analysis for spine quantification. A, Projection of a raw confocal z-stack of an imaged dendrite. B, Dendritic segment after deconvolution. The image is deblurred by accounting for the point spread function in our system. Note that the spines no longer appear fuzzy, and fine morphological details are now evident. C, Automated analysis using NeuronStudio. 3D spine size measurements including head diameter, head volume, and maximum distance from the dendrite are extracted, along with dendritic length. D, Spine indices are imported into Matlab. Spines are classified based on size: a thin spine is smaller than 0.6 μm in diameter and has a maximum length at least twice the diameter; a mushroom spine is >0.6 μm in diameter; the remainder of spines are classified as “other.” Scale bar, 2 μm.
Figure 6.
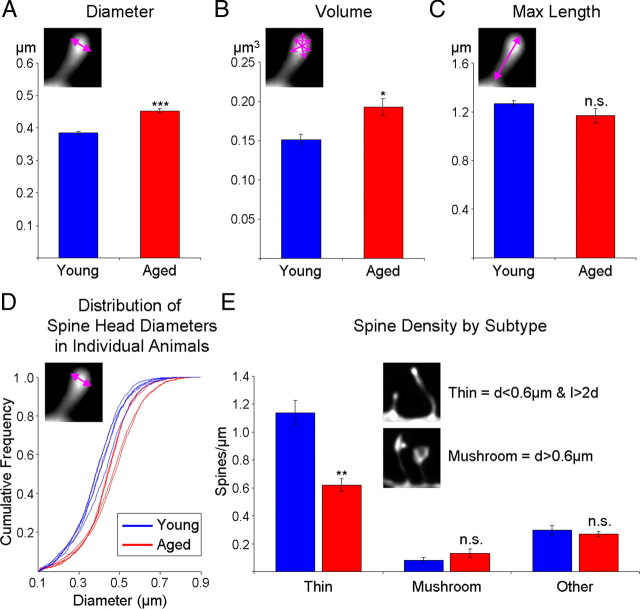
Average spine head diameter (d) and volume is significantly increased in aging, which is attributable to a selective loss of thin spines. All statistics were performed based on one aggregate (i.e., average) measure per animal. A, Mean spine head diameter is significantly greater in aged monkeys. B, Mean spine head volume is significantly greater in aged monkeys. C, There is no age-related difference in the average spine maximum distance from the parent dendrite, a measure that approximates the length of the spine (l). D, The cumulative frequency plot of each spine head diameter from individual animals shows that for small spines (∼0.3–0.4 μm diameter) the group data are highly unified. E, Densities of subtypes of spines based on an unbiased classifier show that there is a selective loss of thin spines in aging. *p < 0.05, **p < 0.01, ***p < 0.001; n.s., no significance.
Figure 8.
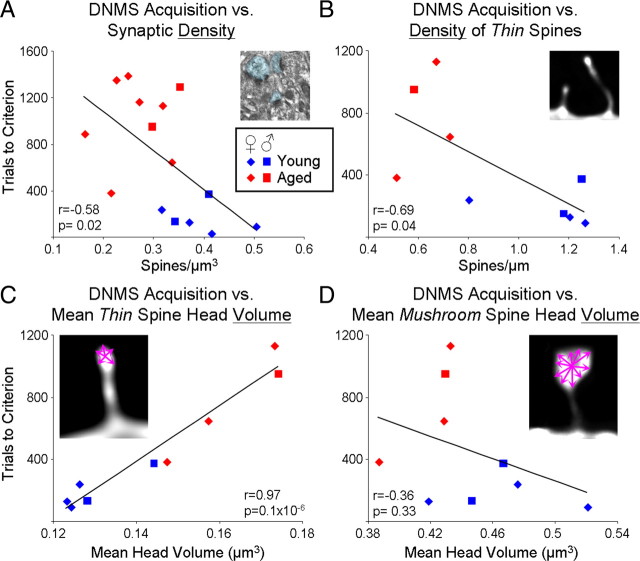
DNMS acquisition significantly correlates with synaptic indices, in particular thin spine head volume. A, The scatter plot of DNMS acquisition (trials required to reach 90% accuracy with a 10 s delay) versus EM synaptic density shows a moderate though significant inverse correlation, meaning that higher synaptic density is predictive of faster learning. B, This inverse correlation is somewhat strengthened when the density of only thin spines is used on the subset of animals for which spine density analysis was performed (r = −0.58 in A and r = −0.69 in B; p < 0.05 for both). C, DNMS acquisition correlates most strongly with the mean volume of thin spines, where bigger volumes are predictive of slower learning. D, In contrast, no correlation is seen between learning of the DNMS task and mean mushroom head volume. r, Pearson correlation coefficient.
Disector analysis of synapse density.
One-hundred-micrometer-thick sections chosen in a systematic random fashion and containing area 46 that had been postfixed with cold 4% paraformaldehyde and 0.125% glutaraldehyde in PBS were embedded with Lowicryl Resin (Electron Microscopy Sciences). Consecutive ultrathin sections (90 nm thick) from layer III of area 46 were cut and mounted on formvar carbon-coated copper slot grids (Electron Microscopy Sciences). Since the tissue sections were sampled in a systematic-random fashion, two consecutive ultrathin sections could be arbitrarily selected from the ultrathin sections and analyzed in an unbiased manner. The ultrathin sections were viewed on a JEOL 1200EX electron microscope. To constitute physical disector pairs, the corresponding tissue areas from the two consecutive ultrathin sections were captured using the Advantage CCD camera (Advanced Microscopy Techniques).
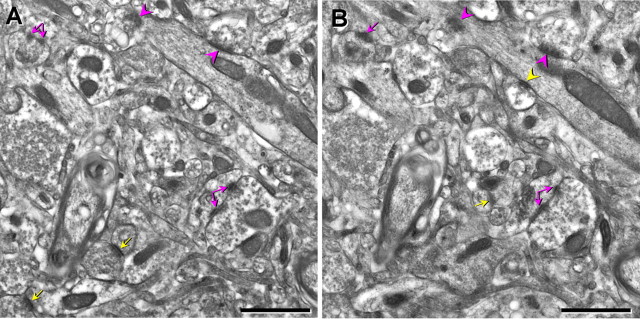
The captured disector images were viewed using the IGL trace program (Harris Laboratory, Boston University). Axospinous and axodendritic synapses in area 46 were designated and counted with different markers by using the physical disector (Fig. 2), as previously described (Sterio, 1984, de Groot and Bierman, 1986; Tigges et al., 1996; Adams et al., 2001). In short, only those axospinous or axodendritic synapse profiles contained in the reference image but not in the corresponding look-up image were counted, and the synapse profiles that appeared in both images were not counted. To increase sampling efficiency, the reference image and look-up image were reversed. The size of the disector area used was 80 μm2 and the average section thickness was 90 nm. Therefore, the height of the disector was 180 nm, because the synapses were obtained by counting both ways. The volume of each disector pair was the area of the counting area multiplied by the height of the disector, which was 14.4 μm3 in the present study. On average, 20 disector pairs from each monkey were analyzed, generating a total volume of 288 μm3. Approximately 100 synapses per monkey were counted. The criteria for inclusion as an axospinous synapse included the presence of synaptic vesicles in the presynaptic terminal and a distinct asymmetric postsynaptic density separated by a clear synaptic cleft. The synapse density was calculated as the total number of counted synapses divided by the total volume of the disectors used.
Figure 2.
Electron micrographs illustrating the disector method for synapse density. For synapse density measurements, two serial sections were used. A, B, One section was considered the reference (A) and the other the look-up (B). Only asymmetric axospinous (yellow arrows) or axodendritic (yellow arrowheads) synapses that are present in the reference but not the look-up were counted and divided by the micrograph area and section thickness. This procedure was repeated by switching the reference and the look-up. Synapses present in both the reference and the look-up are marked with purple arrows (axospinous) and arrowheads (axodendritic). Split arrows indicate perforated synapses. Scale bars, 1 μm.
Estimation of volume of area 46 with the Cavalieri method.
A systematic random series of 50 μm sections was taken from the same prefrontal cortex used for electron microscopic analysis and provided for volume estimate. The interval between the sampled sections was 1.3 mm. The sampled sections were stained with the Nissl stain, and area 46 was outlined and measured using Stereo Investigator software (MicroBrightField) in each Nissl-stained PFC section. The volume of area 46 was estimated with the Cavalieri principle.
Statistical analysis.
Differences in performance on DR and DNMS were assessed using a repeated-measures ANOVA. Statistical analyses were performed using ANOVA to assess possible differences in the various morphometric parameters between groups. The values are shown as means ± SEM, calculated based on one aggregate (i.e., average) per animal. Observed power was calculated in all ANOVA to confirm that the sample size was sufficient to support the data. Pearson correlations were used to determine the relationships between morphological indices and acquisition and performance on DNMS and DR. The statistical significance level was set at p < 0.05.
Results
Behavioral characterization
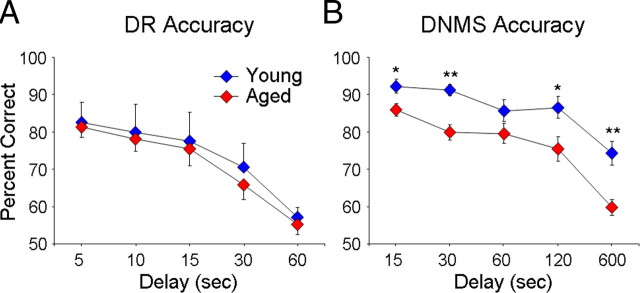
The results of DR testing in this group of monkeys were atypical in that there was an overall lack of age effect, contrary to previous reports (Rapp and Amaral, 1989; Bachevalier et al., 1991). All monkeys, regardless of age or sex, learned the DR procedure with a 0 and 1 s delay at comparable rates (two-way ANOVA, p > 0.1), demonstrating that all groups were motivated to learn and were capable of high levels of accuracy. After DR acquisition, young adult and aged monkeys showed no significant differences in accuracy when successively longer retention intervals were imposed (Fig. 3A); however, males (2 young, 2 aged) had significantly higher scores compared to females (4 young, 7 aged) (repeated-measures ANOVA; age effect, p > 0.7; sex effect, F(1,13) = 6.31, p = 0.03, observed power = 0.63).
Figure 3.
Cognitive performance on DNMS but not DR is impaired in aged monkeys. A, Aged monkeys perform similarly to young monkeys in the DR task. B, Aged monkeys performed worse in DNMS recognition on four of the five delay intervals tested. *p < 0.05, **p < 0.01.
The results of DNMS testing, on the other hand, were similar to previous studies (Rapp et al., 2003; Shamy et al., 2006b), demonstrating that aged monkeys required significantly more trials than young animals to learn the DNMS test initially with a 10 s delay (174 ± 50 trials for young, 1030 ± 113 trials for aged, age effect: F(1,13) = 25.16, p = 0.0004, observed power = 0.995). Once the monkeys reached the learning criteria (90% correct at delay of 10 s), the memory demands of the DNMS task were increased by imposing successively longer delays, where aged monkeys performed significantly worse compared to the young (Fig. 3B) (repeated-measures ANOVA; main age effect; F(1,13) = 13.25, p = 0.004, observed power = 0.91). Aged monkeys displayed impaired recognition compared to young adult monkeys at 15, 30, 120, and 600 s delays (Fig. 2B) (15 s, F(1,13) = 6.39, p = 0.03; 30 s, F(1,13) = 15.03, p = 0.002; 120 s, F(1,13) = 5.61, p = 0.03; 600 s, F(1,13) = 15.33, p = 0.002).
Effects of aging on spine/synapse density and volume of area 46
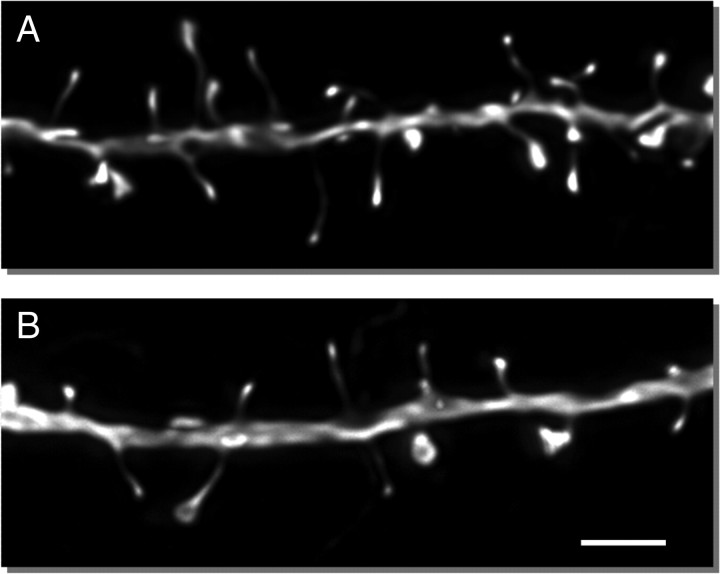
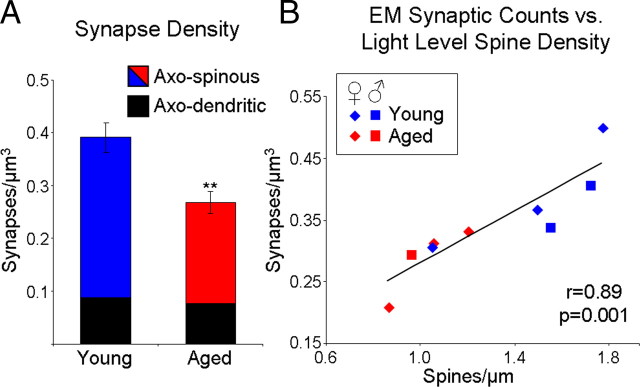
Microinjection of individual cells for morphometric analysis was focused on layer III pyramidal cells because they constitute the main corticocortical circuit (as opposed to layer V cells, which are the main cortical output to multiple subcortical sites and therefore very heterogeneous with respect to their targets) (Jones, 1984). Furthermore, although layer II cells also provide corticocortical interactions, layer III neurons have been found to be the most vulnerable cell population in Alzheimer's disease, pointing to their vulnerability to aging and relevance to cognitive decline (Morrison and Hof, 1997). The morphometric analyses of LY-filled neurons (Fig. 1) revealed an age-related loss of spines in layer III pyramidal neurons (32.9% decrease from 1.52 ± 0.13/μm in young to 1.02 ± 0.07/μm in aged group, F(1,7) = 9.97, p = 0.02, observed power = 0.77). Figure 4, A and B, shows representative dendrites from the young and aged groups, respectively, indicating that this remarkable difference is readily visible by eye. The decrease was consistent across all branch orders of both apical and basal dendrites and at all distances examined. To confirm the relevance of spine density to synaptic density, quantitative electron microscopic (EM) analysis (Fig. 2) was performed on the same cohort of monkeys. Consistent with the light-level data, EM analysis demonstrated an age-related loss of synapses (31.6%, F(1,7) = 13.29, p = 0.003, observed power = 0.92) in the aged group (0.27 ± 0.02/μm3) as compared to the young monkeys (0.39 ± 0.03/μm3) (Fig. 5A). This change in synaptic density is mainly driven by the loss of axospinous synapses (36.6% decrease from 0.30 ± 0.03/μm3 to 0.19 ± 0.02/μm3, p < 0.01). For the nine animals for which both types of analyses were performed, EM density was highly correlated with spine density assessed from LY-filled cells (Pearson correlation, r = 0.89, p = 0.001) (Fig. 5B), further supporting the premise that changes in dendritic spines are indicative of changes in synaptic indices. In contrast to the spine and synapse density, stereologic analyses demonstrated that there was no age-related alteration in the volume of area 46 (117.8 ± 8.4 mm3 in young and 123.1 ± 8.4 mm3 in aged group, p > 0.05).
Figure 4.
Spine density of layer III pyramidal neurons in area 46 of dlPFC is significantly lower in aged monkeys. A, Representative projected z-stack of a dendrite from a young animal. B, Representative projected z-stack of a dendrite from an aged animal. Scale bar, 2 μm.
Figure 5.
Synapse density in area 46 of dlPFC is significantly lower in aged monkeys and strongly correlates with spine density. A, Quantitative 3D EM counts of synapses from six young and nine aged monkeys. B, Scatter plot of EM synaptic counts versus confocal spine counts for the nine animals for which both types of analyses were performed shows that the two methods produce highly consistent results. r, Pearson correlation coefficient; **p < 0.01.
Effects of aging on dendritic spine morphology
Changes in dendritic spine morphology were first assessed by looking at aggregate morphological measurements per individual animal. Aged animals had significantly bigger mean spine head diameters (17.5% increase from 385 ± 5 nm to 453 ± 7 nm, F(1,7) = 72.31, p = 0.6 × 10⁻⁶, observed power = 1.00) (Fig. 6A) and mean spine head volumes (27.1% increase from 152 ± 6 nm3 to 193 ± 11 nm3, F(1,7) = 11.97, p = 0.01, observed power = 0.84) (Fig. 6B). Although there was a trend toward shorter lengths in the aged group, this difference did not reach statistical significance (p > 0.1). To examine in greater detail this difference in size, we plotted the cumulative distribution of the spine head diameters for each individual animal. As can be seen in Figure 6D, the distributions from animals in the two groups are virtually completely non-overlapping, with each animal segregating in accordance to its age group.
In addition, the greatest separation in the cumulative frequency is readily observed visually among the smaller spines, primarily in the 0.3–0.4 μm ranges. This feature of the cumulative distribution led us to hypothesize that only a subset of spines is susceptible to aging-related loss. To test this, we adapted previously published criteria for spine classification (Sorra and Harris, 2000) and defined a thin spine as one with a head diameter <0.6 μm and a maximum length that is at least twice the head diameter; a spine was classified as mushroom if its head diameter was >0.6 μm. The remainder of spines was left unclassified and labeled as “other” (see Materials and Methods). Based on this classification, the prevalence of thin spines was 75 ± 1.6% in the young group and 61 ± 0.9% in the aged group (data not shown), which is consistent with previous reports from serial section EM (Sorra and Harris, 2000). The mean spine density per unit dendritic length was then calculated for each subclass of spines. Figure 6E shows that the overall loss of spines seen in Figure 4 is primarily due to a selective loss of thin spines (45.6% decrease from 1.14 ± 0.09/μm to 0.62 ± 0.05/μm, F(1,7) = 23.83, p = 0.002, observed power = 0.99), with no statistically significant difference in mushroom or other spines (p > 0.2).
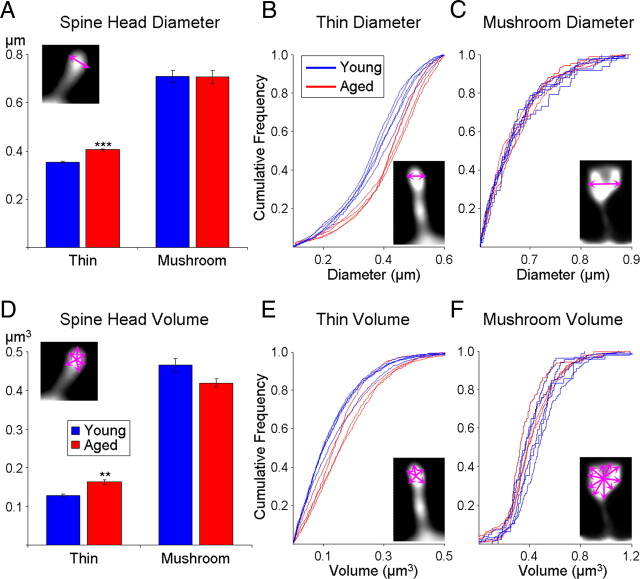
Are the thin spines that remain with aging congruent with thin spines found in young monkeys? To investigate this question, average morphometric indices for each subtype of spine were calculated for each animal. Interestingly, we found that thin spines from aged animals have significantly larger mean head diameters (14.1% increase from 354 ± 5 nm to 405 ± 2 nm, F(1,7) = 79.33, p = 0.5 × 10⁻⁶, observed power = 1.00) (Fig. 7A) and mean head volumes (26.2% increase from 129 ± 4 nm3 to 163 ± 7 nm3, F(1,7) = 21.91, p = 0.002, observed power = 0.98) (Fig. 7D). In contrast, mushroom spines remain unchanged in terms of both mean head diameter and mean head volume (p > 0.05). As can be seen in Figure 7, B and E, the main shift in size is primarily in the 50% smallest thin spines; this implies that not only are thin spines lost in aging, but that it is the smallest of the thin spines that are the most vulnerable. The cumulative distribution of the head diameter and volume of mushroom spines (Fig. 7C,F) clearly demonstrate the lack of an aging-induced change in this subclass of spines. The average length of spines was unaffected by age for both thin and mushroom spines (p > 0.05, data not shown).
Figure 7.
The spine head diameter and volume of thin but not mushroom spines are increased in aging. A, Mean spine head diameter of thin spines is significantly increased in aging with no change to mushroom spine diameter. B, C, Cumulative frequency plots of individual spines show that animals segregate based on age for thin spine head diameter (B) but completely overlap for mushroom head diameter (C). D, Mean spine head volume of thin spines is significantly increased in aging with no change to mushroom spine volume. E, F, Visual inspection of the cumulative frequency plots of individual spines indicates that animals segregate based on age for thin spine head volume (E) but overlap for mushroom head volume (F). **p < 0.01, ***p < 0.001.
Correlations between cognitive performance and synaptic parameters
Synapse density in layer III of area 46 showed a significant inverse correlation (Pearson correlation, r = −0.58, p = 0.02) (Fig. 8A) with DNMS acquisition (i.e., number of trials to reach criterion), demonstrating that a high density of axospinous synapses in layer III of area 46 facilitated learning the DNMS task. For the subset of animals for which LY-filled cells were analyzed, the correlation between DNMS acquisition and spine density did not reach significance overall (Pearson correlation, r = −0.60, p = 0.09) (supplemental Table 1, available at www.jneurosci.org as supplemental material). However, when the correlation was run for the density of thin spines alone, a similar inverse correlation was found as with synaptic density (Pearson correlation, r = −0.69, p = 0.04) (Fig. 8B). In contrast, the density of mushroom spines was unrelated to cognitive performance (Pearson correlation, r = 0.58, p = 0.10) (supplemental Table 1, available at www.jneurosci.org as supplemental material).
Most importantly, the strongest correlations were found when morphometric indices of thin spines were run against DNMS trials to criterion. As can be seen in Figure 8C, the spine head volume of thin spines was 97% correlated with learning (Pearson correlation, p = 0.1 × 10⁻⁶). This correlation is clearly not driven merely by group differences, since significant correlations can be observed within the individual groups as well (Pearson correlation, r = 0.89, p = 0.04 in young, r = 0.97, p = 0.03 in aged). A similar correlation was seen for thin spine head diameter (Pearson correlation, r = 0.86, p = 0.003) (supplemental Table 1, available at www.jneurosci.org as supplemental material). In stark contrast, mushroom spine morphology was not predictive of DNMS acquisition, neither in terms of head volume (Pearson correlation, r = −0.37, p = 0.33) (Fig. 8D) nor in terms of head diameter (Pearson correlation, r = −0.34, p = 0.37) (supplemental Table 1, available at www.jneurosci.org as supplemental material).
Following learning of the DNMS task, there was no significant correlation between any synaptic measure and DNMS performance (supplemental Table 1, available at www.jneurosci.org as supplemental material). Furthermore, DR acquisition and performance were not correlated with any synaptic index (see supplemental material, available at www.jneurosci.org). Taken together, this suggests that the learning component of DNMS is particularly tightly linked to the prevalence of very small axospinous synapses in layer III of area 46.
Discussion
Age-related structural changes
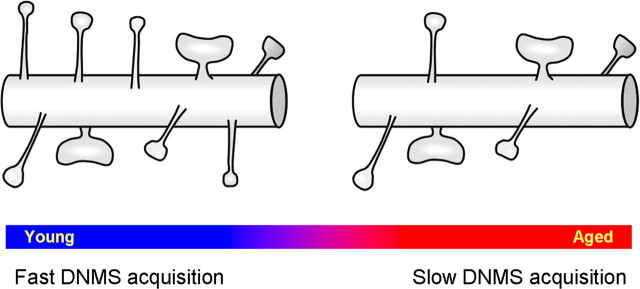
There are four important findings that we present here (Fig. 9): First, there is a substantial aging-induced loss of spines in layer III pyramidal neurons from monkey dlPFC area 46, and this loss was highly consistent between our two methods (33% spine loss in LY-filled cells and 32% synapse loss with EM). The magnitude of the synaptic depletion with aging is consistent with a previous report (Peters et al., 2008), which found a 30% loss of asymmetric synapses in layer II/III of area 46 of monkey. Second, the loss of spines is specific to spines previously referred to in the literature as “thin.” These small spines are highly motile and plastic and have been hypothesized to comprise a specialized subpopulation, distinguished by its capacity for expansion in relation to new learning (Kasai et al., 2003; Bourne and Harris, 2007; Kasai et al., 2010). Third, the thin spines that remain in aging are larger than the thin spines found in young animals. Fourth, the focal novel finding presented here is that the most important structural correlate with cognitive function is the average volume of thin spines (r = 0.97, p = 1 × 10⁻⁵), which is far more predictive of function than overall axospinous synapse density (r = −0.58, p = 0.02), or the actual density of thin spines (r = −0.69, p = 0.04). This directly supports the notion that spine size has emerged as a key morphologic index linked to functional attributes of the synapse as well as potential for synaptic plasticity in the context of learning (Kasai et al., 2003; Bourne and Harris, 2007; Hao et al., 2007).
Figure 9.
Summary of age-related synaptic changes in layer III of area 46 of monkey PFC. There is a marked reduction of thin spines (46%, p = 0.002) in the brains of aged as compared to young subjects. In particular, it is the smallest of thin spines that are lost, the spines presumed to be the most plastic in response to learning (Kasai et al., 2003; Bourne and Harris, 2007). The decline in DNMS acquisition with age occurs in tandem with the synaptic changes and is particularly highly correlated with mean thin spine volume. In contrast, no age-related change in either density or morphology of mushroom spine has been observed.
Alternative interpretations
This study has the limitation of being a snapshot of age-related changes in spine structure. Thus, although we have shown an indisputable change in the distribution of spine size and an overall increase in mean spine diameter and volume with aging, the events underlying these changes remain unknown.
The discrepancy in the size of thin spines could indicate a difference in turnover rates between young and aged animals. Live imaging has shown that spine turnover rates in rodents decline with age (Yang et al., 2009). If aged monkeys have a diminished capacity to generate new spines, the thin spine assembly at any one time point would have a much older average age and therefore be on average bigger, a proposition that is supported quantitatively by two-photon time-lapse imaging in cultured hippocampal pyramidal cells (Yasumatsu et al., 2008).
It is also conceivable that the lack of change in mushroom spine density and size is a result of a loss of large spines with a concomitant increase in the size of thin spines. This would be consistent with the observed increase in mean size of thin spines.
Methodological considerations
“Matters of size” are at the forefront of current neurobiological thinking, as pointed out by the title of a recent review by Kopec and Malinow (2006). To investigate the effects of aging on different subpopulations of spines, we developed a method of classification that both allows for high throughput, as well as results in entirely unbiased data. NeuronStudio was used for automated unbiased quantification of spine size and density (Rodriguez et al., 2006, 2008). This enabled us to analyze >20,000 spines, a sample size that would not be feasible for manual measurements. Spines were then classified based on parameters adapted from Sorra and Harris (2000): a spine was deemed thin if its head diameter was <0.6 μm and its total length was at least twice its head diameter; a spine that had a head >0.6 μm in diameter was classified as mushroom. Using this classification, we found the percentage of thin spines to vary between 59% and 80% in our animals, with an average of 75 ± 1.6% in the young group and 61 ± 0.9% in the aged group. These data are in agreement with a report from the Harris laboratory, stating that ∼65% of spines are thin in both the hippocampus and prefrontal cortex of rats (Bourne and Harris, 2007). In addition, in a serial section EM study, the mean volume of the head of thin spines in the rat adult CA1 was estimated to be 0.03 μm3 (Harris et al., 1992). Because the heads of small spines are approximately spherical, we can use the formula for the volume of a sphere to derive that the average diameter in that study was 0.386 μm. Remarkably, the average head diameter in our study was 0.385 μm in young and 0.452 μm in aged. [Note that 3D images were first deconvolved to compensate for the point-spread function (PSF).] In contrast, the average volume of thin spines in our young monkeys was 0.15 μm3, a fivefold difference from the EM data mentioned above. This is an unfortunate, though expected, consequence of the oval-shaped PSF in confocal microscopy (Coling and Kachar, 2001), giving rise to a Z-plane “smear” that cannot fully be resolved by deconvolution. Nonetheless, because all dendrites are imaged and processed identically, the relative difference between animals and groups should hold true with other imaging methods such as EM.
Cognitive demands for DNMS and DR
Surprisingly, DR acquisition and performance did not differ between the young and aged monkeys in this cohort. However, the lack of an effect was due to a few poor-performing young monkeys rather than no age-induced decline in performance, since aged monkeys scored similarly to previous results (O'Donnell et al., 1999). No correlation between DR acquisition/performance and synaptic measures was found in this cohort (supplemental Table 1, available at www.jneurosci.org as supplemental material).
Conversely, both the number of trials required to reach criterion for acquisition and recognition following a delay in DNMS were impaired in the aged monkeys. However, the only behavioral measure that correlated with synaptic indices in layer III of area 46 was acquisition of the DNMS task (supplemental Table 1, available at www.jneurosci.org as supplemental material). A growing body of work now suggests that the two phases of the DNMS task tap into two different memory systems, with DNMS acquisition mostly dependent on the dlPFC and subsequent DNMS performance more reliant on the medial temporal lobe. For example, learning (Zola et al., 2000; Zola and Squire, 2001) or relearning (Murray and Mishkin, 1998) the DNMS task is often intact in young monkeys with experimentally induced lesions in the medial temporal lobe (although see Beason-Held et al., 1999) even though DNMS performance is predictably impaired [for review, see Zola and Squire (2001) and Baxter and Murray (2001)]. Furthermore, action potential firing rates of layer II/III neurons in area 46 of aged monkeys are significantly related to DNMS acquisition (Chang et al., 2005), and there is a correlation between DNMS acquisition and volume of the PFC (Shamy et al., 2006a).
Furthermore, the degree of age-related impairment of DNMS acquisition far exceeds the degree of impairment in subsequent performance on the task. This behavioral divergence, along with the correlation between prefrontal cortical synaptic indices and acquisition but not subsequent performance, gives rise to an intriguing hypothesis: the prefrontal cortex and hippocampus age differently. This difference might simply be related to the rate of decline in the two brain areas, or might be triggered by a complex interplay between environment and biological age.
Synaptic basis for cognitive aging: the good news
The data presented here begin to refine the vulnerable class of synapses in area 46 that contributes to age-related cognitive decline, and provide further support for our hypothesis that the small highly plastic class of spines is particularly important for optimal performance on cognitive tasks mediated by dlPFC. However, there is a class of spine that is not vulnerable to aging: the mushroom spine. Although the precise nature of the events underlying this stability remain unknown (see “Alternative interpretations” above), our data show that neither density nor any morphological parameter analyzed varied significantly between the mushroom spines found in aged versus young monkeys. Recently, there has been an increased interest in the field of aging of evaluating the question of how the brain maintains expertise (such as playing piano or chess) throughout life despite its pronounced decline in the ability to learn new things (Kramer et al., 2004; Horton et al., 2008). A variety of hypotheses have been proposed, such as preservation of innate superior abilities, development of compensatory skills, and selective maintenance through sustained practice (Horton et al., 2008). To our knowledge, this report is the first to show that the number and mean size of mushroom spines are unchanged by aging. These large spines are known to be highly stable, contain strong synapses (Harris and Stevens, 1989; Takumi et al., 1999), and have been proposed to be the locus of long-term memories (Kasai et al., 2003). We would therefore propose the following new hypothesis for aging-related maintenance of prefrontal-dependent expertise: selective synaptic preservation of “memory” spines.
The bad news may be that we can't make an old dog learn new tricks. The good news, however, is that we can age gracefully by emphasizing learning in our youth.
Footnotes
This work was supported by National Institute on Aging (NIA) Grants AG 006647 (J.H.M.), AG 010606 (J.H.M., P.R.R.), and AG 016765 (J.H.M., P.R.R.), National Research Service Award Training Grant 1F30MH083402 (D.D.), and the Intramural Research Program of the NIA. We thank Ljiljana Minwalla and Mary Roberts for expert technical assistance.
References
- Adams MM, Shah RA, Janssen WG, Morrison JH. Different modes of hippocampal plasticity in response to estrogen in young and aged female rats. Proc Natl Acad Sci U S A. 2001;98:8071–8076. doi: 10.1073/pnas.141215898. [DOI] [PMC free article] [PubMed] [Google Scholar]
- Bachevalier J, Landis LS, Walker LC, Brickson M, Mishkin M, Price DL, Cork LC. Aged monkeys exhibit behavioral deficits indicative of widespread cerebral dysfunction. Neurobiol Aging. 1991;12:99–111. doi: 10.1016/0197-4580(91)90048-o. [DOI] [PubMed] [Google Scholar]
- Baxter MG, Murray EA. Opposite relationship of hippocampal and rhinal cortex damage to delayed nonmatching-to-sample deficits in monkeys. Hippocampus. 2001;11:61–71. doi: 10.1002/1098-1063(2001)11:1<61::AID-HIPO1021>3.0.CO;2-Z. [DOI] [PubMed] [Google Scholar]
- Beason-Held LL, Rosene DL, Killiany RJ, Moss MB. Hippocampal formation lesions produce memory impairment in the rhesus monkey. Hippocampus. 1999;9:562–574. doi: 10.1002/(SICI)1098-1063(1999)9:5<562::AID-HIPO10>3.0.CO;2-X. [DOI] [PubMed] [Google Scholar]
- Bourne J, Harris KM. Do thin spines learn to be mushroom spines that remember? Curr Opin Neurobiol. 2007;17:381–386. doi: 10.1016/j.conb.2007.04.009. [DOI] [PubMed] [Google Scholar]
- Bussière T, Gold G, Kövari E, Giannakopoulos P, Bouras C, Perl DP, Morrison JH, Hof PR. Stereologic analysis of neurofibrillary tangle formation in prefrontal cortex area 9 in aging and Alzheimer's disease. Neuroscience. 2003;117:577–592. doi: 10.1016/s0306-4522(02)00942-9. [DOI] [PubMed] [Google Scholar]
- Chang YM, Rosene DL, Killiany RJ, Mangiamele LA, Luebke JI. Increased action potential firing rates of layer 2/3 pyramidal cells in the prefrontal cortex are significantly related to cognitive performance in aged monkeys. Cereb Cortex. 2005;15:409–418. doi: 10.1093/cercor/bhh144. [DOI] [PubMed] [Google Scholar]
- Coling D, Kachar B. Theory and application of fluorescence microscopy. Curr Protoc Neurosci. 2001;50:2.1.1–2.1.14. doi: 10.1002/0471142301.ns0201s00. [DOI] [PubMed] [Google Scholar]
- de Groot DM, Bierman EP. A critical evaluation of methods for estimating the numerical density of synapses. J Neurosci Methods. 1986;18:79–101. doi: 10.1016/0165-0270(86)90113-5. [DOI] [PubMed] [Google Scholar]
- Duan H, Wearne SL, Rocher AB, Macedo A, Morrison JH, Hof PR. Age-related dendritic and spine changes in corticocortically projecting neurons in macaque monkeys. Cereb Cortex. 2003;13:950–961. doi: 10.1093/cercor/13.9.950. [DOI] [PubMed] [Google Scholar]
- Fuster JM. The prefrontal cortex. San Diego: Elsevier; 2008. [Google Scholar]
- Gallagher M, Rapp PR. The use of animal models to study the effects of aging on cognition. Annu Rev Psychol. 1997;48:339–370. doi: 10.1146/annurev.psych.48.1.339. [DOI] [PubMed] [Google Scholar]
- Goldman-Rakic PS. The “psychic cell” of Ramón y Cajal. Prog Brain Res. 2002;136:427–434. doi: 10.1016/s0079-6123(02)36035-7. [DOI] [PubMed] [Google Scholar]
- Grutzendler J, Kasthuri N, Gan WB. Long-term dendritic spine stability in the adult cortex. Nature. 2002;420:812–816. doi: 10.1038/nature01276. [DOI] [PubMed] [Google Scholar]
- Hao J, Rapp PR, Leffler AE, Leffler SR, Janssen WG, Lou W, McKay H, Roberts JA, Wearne SL, Hof PR, Morrison JH. Estrogen alters spine number and morphology in prefrontal cortex of aged female rhesus monkeys. J Neurosci. 2006;26:2571–2578. doi: 10.1523/JNEUROSCI.3440-05.2006. [DOI] [PMC free article] [PubMed] [Google Scholar]
- Hao J, Rapp PR, Janssen WG, Lou W, Lasley BL, Hof PR, Morrison JH. Interactive effects of age and estrogen on cognition and pyramidal neurons in monkey prefrontal cortex. Proc Natl Acad Sci U S A. 2007;104:11465–11470. doi: 10.1073/pnas.0704757104. [DOI] [PMC free article] [PubMed] [Google Scholar]
- Harris KM, Stevens JK. Dendritic spines of CA 1 pyramidal cells in the rat hippocampus: serial electron microscopy with reference to their biophysical characteristics. J Neurosci. 1989;9:2982–2997. doi: 10.1523/JNEUROSCI.09-08-02982.1989. [DOI] [PMC free article] [PubMed] [Google Scholar]
- Harris KM, Jensen FE, Tsao B. Three-dimensional structure of dendritic spines and synapses in rat hippocampus (CA1) at postnatal day 15 and adult ages: implications for the maturation of synaptic physiology and long-term potentiation. J Neurosci. 1992;12:2685–2705. doi: 10.1523/JNEUROSCI.12-07-02685.1992. [DOI] [PMC free article] [PubMed] [Google Scholar]
- Holtmaat A, Wilbrecht L, Knott GW, Welker E, Svoboda K. Experience-dependent and cell-type-specific spine growth in the neocortex. Nature. 2006;441:979–983. doi: 10.1038/nature04783. [DOI] [PubMed] [Google Scholar]
- Horton S, Baker J, Schorer J. Expertise and aging: maintaining skills through the lifespan. Eur Rev Aging Phys Act. 2008;5:89–96. [Google Scholar]
- Jones EG. Laminar distribution of cortical efferent cells. In: Peters A, Jones EG, editors. Cerebral cortex, Vol 1, Cellular components of the cerebral cortex. New York: Plenum; 1984. pp. 521–553. [Google Scholar]
- Kasai H, Matsuzaki M, Noguchi J, Yasumatsu N, Nakahara H. Structure-stability-function relationships of dendritic spines. Trends Neurosci. 2003;26:360–368. doi: 10.1016/S0166-2236(03)00162-0. [DOI] [PubMed] [Google Scholar]
- Kasai H, Fukuda M, Watanabe S, Hayashi-Takagi A, Noguchi J. Structural dynamics of dendritic spines in memory and cognition. Trends Neurosci. 2010;33:121–129. doi: 10.1016/j.tins.2010.01.001. [DOI] [PubMed] [Google Scholar]
- Kopec C, Malinow R. Neuroscience. Matters of size. Science. 2006;314:1554–1555. doi: 10.1126/science.1137595. [DOI] [PubMed] [Google Scholar]
- Kramer AF, Bherer L, Colcombe SJ, Dong W, Greenough WT. Environmental influences on cognitive and brain plasticity during aging. J Gerontol A Biol Sci Med Sci. 2004;59:M940–57. doi: 10.1093/gerona/59.9.m940. [DOI] [PubMed] [Google Scholar]
- Makris N, Papadimitriou GM, van der Kouwe A, Kennedy DN, Hodge SM, Dale AM, Benner T, Wald LL, Wu O, Tuch DS, Caviness VS, Moore TL, Killiany RJ, Moss MB, Rosene DL. Frontal connections and cognitive changes in normal aging rhesus monkeys: A DTI study. Neurobiol Aging. 2007;28:1556–1567. doi: 10.1016/j.neurobiolaging.2006.07.005. [DOI] [PubMed] [Google Scholar]
- Matsuzaki M, Ellis-Davies GC, Nemoto T, Miyashita Y, Iino M, Kasai H. Dendritic spine geometry is critical for AMPA receptor expression in hippocampal CA1 pyramidal neurons. Nat Neurosci. 2001;4:1086–1092. doi: 10.1038/nn736. [DOI] [PMC free article] [PubMed] [Google Scholar]
- Miller EK, Freedman DJ, Wallis JD. The prefrontal cortex: categories, concepts and cognition. Philos Trans R Soc Lond B Biol Sci. 2002;357:1123–1136. doi: 10.1098/rstb.2002.1099. [DOI] [PMC free article] [PubMed] [Google Scholar]
- Morrison JH, Hof PR. Life and death of neurons in the aging brain. Science. 1997;278:412–419. doi: 10.1126/science.278.5337.412. [DOI] [PubMed] [Google Scholar]
- Moss MB, Killiany RJ, Herndon JG. Age-related cognitive decline in rhesus monkey. In: Peters A, Morrison JH, editors. Cerebral cortex, neurodegenerative and age-related changes in structure and function of cerebral cortex. New York: Kluwer Academic/Plenum; 1999. pp. 21–48. [Google Scholar]
- Murray EA, Mishkin M. Object recognition and location memory in monkeys with excitotoxic lesions of the amygdala and hippocampus. J Neurosci. 1998;18:6568–6582. doi: 10.1523/JNEUROSCI.18-16-06568.1998. [DOI] [PMC free article] [PubMed] [Google Scholar]
- O'Donnell KA, Rapp PR, Hof PR. Preservation of prefrontal cortical volume in behaviorally characterized aged macaque monkeys. Exp Neurol. 1999;160:300–310. doi: 10.1006/exnr.1999.7192. [DOI] [PubMed] [Google Scholar]
- Peters A, Rosene DL. In aging, is it gray or white? J Comp Neurol. 2003;462:139–143. doi: 10.1002/cne.10715. [DOI] [PubMed] [Google Scholar]
- Peters A, Sethares C. Aging and the myelinated fibers in prefrontal cortex and corpus callosum of the monkey. J Comp Neurol. 2002;442:277–291. doi: 10.1002/cne.10099. [DOI] [PubMed] [Google Scholar]
- Peters A, Morrison JH, Rosene DL, Hyman BT. Feature article: are neurons lost from the primate cerebral cortex during normal aging? Cereb Cortex. 1998a;8:295–300. doi: 10.1093/cercor/8.4.295. [DOI] [PubMed] [Google Scholar]
- Peters A, Sethares C, Moss MB. The effects of aging on layer 1 in area 46 of prefrontal cortex in the rhesus monkey. Cereb Cortex. 1998b;8:671–684. doi: 10.1093/cercor/8.8.671. [DOI] [PubMed] [Google Scholar]
- Peters A, Sethares C, Luebke JI. Synapses are lost during aging in the primate prefrontal cortex. Neuroscience. 2008;152:970–981. doi: 10.1016/j.neuroscience.2007.07.014. [DOI] [PMC free article] [PubMed] [Google Scholar]
- Rapp PR, Amaral DG. Evidence for task-dependent memory dysfunction in the aged monkey. J Neurosci. 1989;9:3568–3576. doi: 10.1523/JNEUROSCI.09-10-03568.1989. [DOI] [PMC free article] [PubMed] [Google Scholar]
- Rapp PR, Amaral DG. Recognition memory deficits in a subpopulation of aged monkeys resemble the effects of medial temporal lobe damage. Neurobiol Aging. 1991;12:481–486. doi: 10.1016/0197-4580(91)90077-w. [DOI] [PubMed] [Google Scholar]
- Rapp PR, Morrison JH, Roberts JA. Cyclic estrogen replacement improves cognitive function in aged ovariectomized rhesus monkeys. J Neurosci. 2003;23:5708–5714. doi: 10.1523/JNEUROSCI.23-13-05708.2003. [DOI] [PMC free article] [PubMed] [Google Scholar]
- Rodriguez A, Ehlenberger DB, Hof PR, Wearne SL. Rayburst sampling, an algorithm for automated three-dimensional shape analysis from laser scanning microscopy images. Nat Protoc. 2006;1:2152–2161. doi: 10.1038/nprot.2006.313. [DOI] [PubMed] [Google Scholar]
- Rodriguez A, Ehlenberger DB, Dickstein DL, Hof PR, Wearne SL. Automated three-dimensional detection and shape classification of dendritic spines from fluorescence microscopy images. PLoS One. 2008;3:e1997. doi: 10.1371/journal.pone.0001997. [DOI] [PMC free article] [PubMed] [Google Scholar]
- Shamy JL, Barnes CA, Amaral DG, Buonocore MH, Hof PR, Rapp PR. Regional volumetric correlates of spatiotemporal and recognition memory impairment in aged rhesus monkeys. Soc Neurosci Abstr. 2006a;32:371–15. [Google Scholar]
- Shamy JL, Buonocore MH, Makaron LM, Amaral DG, Barnes CA, Rapp PR. Hippocampal volume is preserved and fails to predict recognition memory impairment in aged rhesus monkeys (Macaca mulatta) Neurobiol Aging. 2006b;27:1405–1415. doi: 10.1016/j.neurobiolaging.2005.07.019. [DOI] [PubMed] [Google Scholar]
- Sorra KE, Harris KM. Overview on the structure, composition, function, development, and plasticity of hippocampal dendritic spines. Hippocampus. 2000;10:501–511. doi: 10.1002/1098-1063(2000)10:5<501::AID-HIPO1>3.0.CO;2-T. [DOI] [PubMed] [Google Scholar]
- Sterio DC. The unbiased estimation of number and sizes of arbitrary particles using the disector. J Microsc. 1984;134:127–136. doi: 10.1111/j.1365-2818.1984.tb02501.x. [DOI] [PubMed] [Google Scholar]
- Takumi Y, Ramírez-León V, Laake P, Rinvik E, Ottersen OP. Different modes of expression of AMPA and NMDA receptors in hippocampal synapses. Nat Neurosci. 1999;2:618–624. doi: 10.1038/10172. [DOI] [PubMed] [Google Scholar]
- Tigges J, Herndon JG, Rosene DL. Preservation into old age of synaptic number and size in the supragranular layer of the dentate gyrus in rhesus monkeys. Acta Anat (Basel) 1996;157:63–72. doi: 10.1159/000147867. [DOI] [PubMed] [Google Scholar]
- Yang G, Pan F, Gan WB. Stably maintained dendritic spines are associated with lifelong memories. Nature. 2009;462:920–924. doi: 10.1038/nature08577. [DOI] [PMC free article] [PubMed] [Google Scholar]
- Yasumatsu N, Matsuzaki M, Miyazaki T, Noguchi J, Kasai H. Principles of long-term dynamics of dendritic spines. J Neurosci. 2008;28:13592–13608. doi: 10.1523/JNEUROSCI.0603-08.2008. [DOI] [PMC free article] [PubMed] [Google Scholar]
- Zola SM, Squire LR. Relationship between magnitude of damage to the hippocampus and impaired recognition memory in monkeys. Hippocampus. 2001;11:92–98. doi: 10.1002/hipo.1027. [DOI] [PubMed] [Google Scholar]
- Zola SM, Squire LR, Teng E, Stefanacci L, Buffalo EA, Clark RE. Impaired recognition memory in monkeys after damage limited to the hippocampal region. J Neurosci. 2000;20:451–463. doi: 10.1523/JNEUROSCI.20-01-00451.2000. [DOI] [PMC free article] [PubMed] [Google Scholar]
- Zuo Y, Lin A, Chang P, Gan WB. Development of long-term dendritic spine stability in diverse regions of cerebral cortex. Neuron. 2005;46:181–189. doi: 10.1016/j.neuron.2005.04.001. [DOI] [PubMed] [Google Scholar]


