

Abstract
Background and objectives: The discovery of fibroblast growth factor-23 (FGF-23) and the elucidation of its function as a phosphaturic and 1,25(OH)2VitD counter-regulatory hormone provides a new conceptual framework for the understanding of the pathogenesis of secondary hyperparathyroidism. This study aims to elucidate the complex associations between FGF-23, parathyroid hormone (PTH), 1,25(OH)2D, and phosphate in patients with early-stage chronic kidney disease (CKD) and to provide clinical evidence in favor of the new phosphate-centric paradigm for the pathogenesis of secondary hyperparathyroidism.
Design, setting, participants, & measurements: Serum biointact PTH and FGF-23, 25(OH)D, 1,25(OH)2D, calcium, phosphate, 24-hour urine excretion of phosphate and calcium, and urinary fractional excretion of phosphate were determined in a cross-sectional study including 125 patients with CKD stages 1 to 3.
Results: Serum phosphate levels showed an inverse association with estimated GFR (eGFR), but were within the normal range in all but one patient. FGF-23 and PTH were inversely associated with eGFR, even in the subgroup of patients with CKD stages 1 and 2. High FGF-23 levels were significantly more prevalent than high PTH levels. The urinary fractional excretion of phosphate was highest in patients with both a high serum FGF-23 and PTH level. Increased FGF-23 and phosphate and decreased 25(OH)D were independently associated with decreased 1,25(OH)2D.
Conclusions: Our data are in favor of the new paradigm for the pathogenesis of secondary hyperparathyroidism according to which a reduced phosphate excretion capacity is the principal abnormality that initiates secondary hyperparathyroidism.
The complexity of phosphate metabolism in chronic kidney disease (CKD) is well-recognized (1). Recent clinical studies demonstrate a high fractional renal phosphate excretion despite the presence of normophosphatemia in early CKD (2–4). The increased renal phosphate excretion is driven, at least partly, by parathyroid hormone (PTH) and fibroblast growth factor-23 (FGF-23) (3,5–7).
The discovery of FGF-23 and the elucidation of its function as a phosphaturic (8) and 1,25(OH)2VitD counter-regulatory hormone (3,8,9) provides a new conceptual framework for the understanding of the pathogenesis of secondary hyperparathyroidism (sHPT) (10). According to this new paradigm for the pathogenesis of sHPT, a primary decrease in renal phosphate excretion due to the loss of functioning kidney mass leads to increased FGF-23 secretion from bone; increased FGF-23 levels act on the kidney to inhibit phosphate reabsorption and to suppress 1,25(OH)2VitD levels. Phosphate homeostasis is restored by the effects of both decreased 1,25(OH)2VitD levels, which diminish gastrointestinal phosphate absorption, and increased FGF-23 levels, which boost renal phosphate excretion. As in the traditional paradigm, low 1,25(OH)2VitD levels lead to increased PTH production (either directly or indirectly via diminished gastrointestinal calcium absorption), but this event occurs later. Clinical studies in favor of this new paradigm are scant and, moreover, limited either by small sample size (3,7,11) or incomplete data set (e.g., lack of vitamin D levels and/or urinary indices) (2,4,12).
The present cross-sectional study aims to elucidate the complex associations between FGF-23, PTH, 1,25(OH)2VitD, and phosphate in patients with early CKD (GFR >30 ml/min per 1.73 m2) and to provide clinical evidence in favor of the new phosphate-centric paradigm for the pathogenesis of sHPT.
Materials and Methods
Study Population
We performed a cross-sectional observational study in 125 stable patients with CKD stages 1 to 3. Patients were recruited from the outpatient clinic at the Department of Nephrology, University Hospitals Leuven, Leuven, Belgium, in the frame of an ongoing epidemiologic trial (clinical trials registry NCT00441623). None of the patients were renal transplant recipients. The study adhered to the principles of the Declaration of Helsinki and was approved by the ethical committee of the Catholic University of Leuven. All patients provided informed consent.
Procedures, Assays, and Calculations
Serum samples (nonfasting) and 24-hour (24h)-urine samples were collected during a routine follow-up outpatient visit. Serum full-length FGF-23 levels were determined with a sandwich enzyme-linked immunosorbent assay (13). Serum 1,25(OH)2VitD (calcitriol) and 25(OH)VitD (calcidiol) levels were measured using a RIA (14,15). Serum full-length PTH levels were determined by an immunoradiometric assay (IRMA), as described elsewhere (16). Serum creatinine, calcium (Ca), phosphate (Phos), albumin, and urinary creatinine, calcium, and phosphate were measured using standard assays. Measured serum Ca levels were adjusted to albumin levels (Cac) (17).
The estimated GFR (eGFR) was calculated using the Cockcroft and Gault equation and normalized for body surface area. Data from a recent large European study show reasonable accuracy of the Cockcroft-Gault formula: approximately 70% of the GFR estimations were within ±30% of the renal inuline clearance (18). The 24h-fractional renal excretion of phosphate (24h-FEPhos) was calculated as follows:
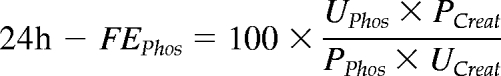 |
where U and P are the urinary and plasma concentration of phosphate and creatinine, respectively. The 24h-fractional excretion of Ca was calculated similarly.
Statistical Analysis
Parametric and nonparametric parameters are expressed as mean ± SD and median (interquartile range), respectively. To clarify the relationship between kidney function and parameters of mineral metabolism in patients with early CKD, we addressed kidney function both as a continuous and categorical variable. Differences between groups were analyzed using nonparametric one-way ANOVA, followed by post hoc correction for multiple comparisons (Kruskal-Wallis) and χ2 test, as appropriate. Correlations between eGFR and parameters of mineral metabolism were studied by Spearmans’ test. Linear regression analyses were used to examine the associations between demographics and parameters of mineral metabolism and renal function. Nonparametric distributed analytes, including FGF-23, PTH, and calcitriol, were ln-transformed to achieve normality for the regression analyses. The SAS version 9.1 (SAS Institute, Cary, NC) software program was used for the statistical analysis. Two-sided P < 0.05 was considered statistically significant.
Results
Patient Characteristics
Demographics and maintenance mineral metabolism therapy are summarized in Table 1. Primary renal disease was diabetes (3.2%), glomerulonephritis/vasculitis (45.6%), interstitial nephritis (4%), cystic/hereditary/congenital (12.8%), miscellaneous (3.2%), and unknown or missing (31.2%). Patients with CKD stage 3 (n = 63) were older and treated more frequently with active vitamin D as compared with patients with CKD stages 1 to 2 (n = 62).
Table 1.
Demographics and relevant therapy
| All | CKD1 (n = 19) | CKD2 (n = 43) | CKD3 (n = 62) | P | |
|---|---|---|---|---|---|
| Demographics | |||||
| Age, year | 55.9 ± 13.8 | 44.7 ± 11.9a | 51.7 ± 12.9a | 62.0 ± 11.8a | <0.0001 |
| Gender, men, % | 64 | 68 | 61 | 65 | 0.8 |
| Height, cm | 171.1 ± 9.5 | 174.6 ± 10.4 | 171.9 ± 8.3 | 169.5 ± 8.9 | 0.23 |
| Weight, kg | 81.2 ± 17.9 | 83.2 ± 14.3 | 83.1 ± 18.0 | 79.4 ± 18.8 | 0.32 |
| Mineral metabolism therapy | |||||
| Phosphate binder, % | 9.6 | 0.0 | 7.0 | 14.3 | 0.14 |
| Cholecalciferol, % | 8.8 | 10.5 | 7.0 | 9.5 | 0.9 |
| Calcitriol or 1-α-calcidiol, % | 2.4 | 0 | 0 | 4.8 | 0.2 |
| Bisphosphonates, % | 4.8 | 5.3 | 0 | 7.9 | 0.2 |
| Bicarbonate supplements, % | 8.0 | 0 | 0 | 15.9 | 0.005 |
| Calcium supplements, % | 9.6 | 15.8 | 4.7 | 11.1 | 0.3 |
| Immunosuppressive therapy | |||||
| Antimetabolite, % | 4.8 | 5.3 | 4.7 | 4.8 | 0.99 |
| Calcineurin inhibitor, % | 4.0 | 0 | 4.7 | 4.8 | 0.6 |
| Corticosteroids, % | 11.2 | 21.1 | 9.3 | 9.5 | 0.3 |
CKD, chronic kidney disease.
Parameters with the same suffix differ significantly.
Biochemistry
Relevant biochemistry data are summarized in Table 2. The mean estimated GFR was 56.9 ± 20.8 ml/min per 1.73 m2. The mean serum phosphate level was 3.2 ± 0.6 mg/dl. Serum phosphate levels were below the upper normal limit in all but 1 patient.
Table 2.
Biochemistry
| Normal | All(n = 125) | CKD1(n = 19) | CKD2(n = 43) | CKD3(n = 63) | P | |
|---|---|---|---|---|---|---|
| Ca, mg/dl | 8.4 to 10.3 | 9.2 ± 0.4 | 9.0 ± 0.4a,b | 9.3 ± 0.5a | 9.3 ± 0.3b | 0.03 |
| Cac, mg/dl | 8.4 to 10.3 | 9.2 ± 0.4 | 9.0 ± 0.4a,b | 9.3 ± 0.4a | 9.3 ± 0.3b | 0.02 |
| Cac <8.4 mg/dl, % | 1.6 | 5.3 | 0 | 1.6 | 0.32 | |
| Alb, g/L | 44.3 ± 3.6 | 44.2 ± 4.1 | 45.0 ± 4.5 | 45.1 ± 2.6 | 0.67 | |
| Phos, mg/dl | 2.3 to 4.7 | 3.2 ± 0.6 | 3.0 ± 0.5 | 3.1 ± 0.6 | 3.3 ± 0.6 | 0.09 |
| Phos >4.7 mg/dl, % | 0.8 | 0.0 | 0.0 | 1.6 | 0.61 | |
| Creat, mg/dl | 0.51 to 0.95 | 1.44 ± 0.54 | 0.93 ± 0.23 | 1.21 ± 0.32 | 1.76 ± 0.53 | <0.0001 |
| Total bicarbonate | 25.1 ± 2.7 | 25.6 ± 2.3 | 25.5 ± 2.4 | 24.7 ± 2.8 | 0.16 | |
| PTH, ng/L | ≤40 | 17.2 (5.9 to 24.5) | 3.8 (1.5 to 20.1)a | 14.4 (3.4 to 23.2)a | 20.6 (11.8 to 33.4)a | <0.0001 |
| PTH >40 ng/L, % | 9.7 | 0.0 | 2.3 | 17.7 | 0.01 | |
| FGF-23, pg/ml | ≤50 | 58.5 (43.4 to 79.9) | 47.1 (38.8 to 54.6)a | 50.8 (41.0 to 69.0)b | 70.8 (54.0 to 101.8)a,b | 0.0001 |
| FGF-23 >50 pg/ml, % | 60.8 | 36.8 | 48.8 | 76.2 | 0.001 | |
| Calcidiol, ng/ml | 7 to 60 | 26.9 (17.5 to 35.9) | 26.9 (17.1 to 34.8) | 21.0 (16.0 to 41.7) | 27.6 (20.2 to 34.0) | 0.73 |
| Suff (≥30)/Insuff (10 to 30)/Def (<10), % | 36/60/4 | 32/63/5 | 40/53/7 | 35/63/2 | 0.61 | |
| Calcitriol, pg/ml | 20 to 80 | 44.5 (35.4 to 53.3) | 51.2 (39.5 to 64.8)a | 47.7 (35.4 to 56.2)a | 38.4 (33.1 to 50.8)a | 0.02 |
| Calcitriol <20 pg/ml, % | 2.4 | 0.0 | 2.3 | 3.2 | 0.73 | |
| Alkaline phosphatases, IU/L | ≤270 | 181.2 ± 53.6 | 159.7 ± 37.5 | 168.7 ± 42.8 | 193.3 ± 60.2 | 0.07 |
| eGFR, ml/min per 1.73 m2 | 56.9 ± 20.8 | 91.5 ± 14.2a | 65.1 ± 9.0a | 41.0 ± 8.9a | <0.0001 | |
| Creat clearance, ml/min per 1.73 m2 | 60.9 ± 31.1 | 97.1 ± 36.8a | 65.8 ± 23.3a | 43.0 ± 17.2a | <0.0001 | |
| Phosphaturia, mg/d | ≈diet | 830 ± 318 | 914 ± 332a | 942 ± 327b | 731 ± 279a,b | 0.003 |
| Calciuria, mg/d | ≈diet | 73 ± 82 | 138 ± 134a | 80 ± 73a | 49 ± 49a | 0.002 |
| Proteinuria, g/d | 0.21 (0.11 to 0.60) | 0.24 (0.09 to 0.89) | 0.18 (0.11 to 0.54) | 0.23 (0.12 to 0.68) | 0.80 | |
| nPCR, g/kg per day | 0.97 ± 0.36 | 1.3 ± 0.50 | 1.02 ± 0.36 | 0.88 ± 0.30 | 0.08 | |
| 24h-FEPhos, % | 30.9 ± 13.6 | 21.2 ± 7.5a,b | 30.4 ± 14.0a | 34.1 ± 13.6b | 0.0006 | |
| 24h-FECa, % | 0.83 ± 0.83 | 0.96 ± 0.89 | 0.79 ± 0.85 | 0.83 ± 0.80 | 0.64 |
24h-FECa, 24h-fractional renal excretion of calcium; 24h-FEPhos, 24h-fractional renal excretion of phosphate; Cac, albumin-corrected calcium; CKD, chronic kidney disease; eGFR, estimated GFR; FGF-23, fibroblast growth factor-23; PTH, parathyroid hormone.
Parameters with the same suffix differ significantly.
The median PTH level in the whole cohort was 17.2 (5.9 to 24.5) ng/L, which is comparable to what has been reported previously in 94 healthy individuals (age 38 ± 8, 57 men), i.e., 19.8 ± 7.8 ng/L (range 3 to 40 ng/L) (16). Hyperparathyroidism, defined by a PTH level >40 ng/L, was observed in only 9.7% of the patients.
The median FGF-23 level in the whole cohort was 58.5 (43.4 to 79.9) pg/ml. Hyperphosphatoninism, defined by a FGF-23 level >50 ng/ml, was present in 60.8% of the patients enrolled in this study. Hyperphosphatoninism was significantly more prevalent than hyperparathyroidism, both in patients with CKD stages 1 to 2 and in patients with CKD stage 3.
The median calcitriol and calcidiol level amounted to 44.5 (35.4 to 53.3) and 26.9 (17.5 to 35.9) ng/ml, respectively. Blood samplings were performed equally distributed over the winter and summer season. The latitude of Belgium is 50°50′N of the equator.
Significant differences were observed between patients with CKD stages 1 to 2 and CKD stage 3 for most parameters of mineral metabolism (Table 2). Serum phosphate, PTH, FGF-23, and alkaline phosphatases levels were significantly higher, whereas serum calcitriol levels were significantly lower in patients with CKD stage 3. A significant inverse correlation was observed between serum phosphate, FGF-23, and PTH levels and eGFR (Figure 1, A through C). Serum calcitriol levels, conversely, showed a significantly direct association with eGFR (Figure 1D). Finally, a significant inverse association was observed between the fractional renal excretion of phosphate and eGFR (Figure 2A).
Figure 1.

Phosphate (A), PTH (B), FGF-23 (C), and calcitriol (D) levels according to eGFR. Dashed line denotes the upper normal limit.
Figure 2.

Fractional excretion of phosphate according to eGFR (A) and categorized according to serum FGF-23 and PTH level (high denotes >40 ng/L for PTH and >50 pg/ml for FGF-23) (B).
For PTH and FGF-23, an inverse correlation with eGFR was observed both in patients with CKD stages 1 and 2 and in patients with CKD stage 3, whereas for serum phosphate, this inverse correlation was observed in patients with CKD stage 3 only (subgroup analysis; data not shown).
Regression Analysis
Table 3 summarizes the results of the regression analysis.
Table 3.
Univariate and multivariate regression analysis
| Independent Variables | LnFGF |
LnCalcitriol |
LnPTH |
24h-FEPhos |
||||||||
|---|---|---|---|---|---|---|---|---|---|---|---|---|
| β | P | R2 | β | P | R2 | β | P | R2 | β | P | R2 | |
| Univariate models | ||||||||||||
| Age | 0.01 | 0.003 | 0.07 | −0.01 | 0.009 | 0.05 | 0.04 | <0.0001 | 0.16 | 0.23 | 0.01 | 0.05 |
| LnPTH | 0.1 | 0.005 | 0.06 | −0.04 | 0.06 | 0.03 | — | — | — | 4.7 | <0.0001 | 0.26 |
| LnFGF-23 | — | — | — | −0.26 | <0.0001 | 0.17 | 0.67 | 0.005 | 0.06 | 5.9 | 0.006 | 0.06 |
| LnCalcitriol | −0.65 | <0.0001 | 0.17 | — | — | — | −0.7 | 0.06 | 0.03 | −5.4 | 0.12 | 0.02 |
| LnCalcidiol | −0.13 | 0.17 | 0.02 | 0.2 | 0.001 | 0.08 | −0.5 | 0.05 | 0.03 | −1.4 | 0.56 | 0.003 |
| Phosphate | −0.16 | 0.06 | 0.03 | −0.23 | <0.0001 | 0.13 | −0.27 | 0.24 | 0.01 | — | — | |
| Cac | −0.03 | 0.82 | 0.0 | −0.18 | 0.06 | 0.03 | −0.03 | 0.92 | 0.0 | — | — | |
| AP | 0.003 | 0.0005 | 0.09 | 0.002 | 0.003 | 0.07 | 0.009 | 0.004 | 0.10 | — | — | |
| eGFR | −0.01 | <0.0001 | 0.16 | 0.005 | 0.001 | 0.08 | 0.04 | <0.0001 | 0.22 | −0.26 | <0.0001 | 0.16 |
| Total bicarbonate | — | — | — | — | — | — | — | — | — | −0.73 | 0.12 | 0.02 |
| 24h-phosphaturia | 0.0001 | 0.52 | 0.004 | — | — | — | 0.0007 | 0.10 | 0.02 | — | — | — |
| Multivariate models | 0.26 | 0.31 | 0.33 | 0.30 | ||||||||
| LnPTH | — | — | — | — | — | — | 3.7 | <0.0001 | ||||
| LnFGF | — | — | −0.22 | <0.0001 | — | — | — | — | ||||
| LnCalcitriol | −0.51 | 0.0001 | — | — | — | — | ||||||
| LnCalcidiol | — | — | 0.16 | 0.004 | −0.58 | 0.009 | — | — | ||||
| Phosphate | — | — | −0.18 | 0.0004 | — | — | — | — | ||||
| eGFR | −0.01 | 0.0003 | — | — | −0.04 | <0.0001 | −0.15 | 0.01 | ||||
| 24h-phosphaturia | — | — | 0.001 | 0.001 | ||||||||
Parameters included in the multivariate model: all parameters univariately associated at P ≤ 0.2, after excluding colinearity. AP, alkaline phosphatases; Cac, albumin-corrected calcium; CKD, chronic kidney disease; eGFR, estimated GFR; FGF-23, fibroblast growth factor-23; PTH, parathyroid hormone.
Regulators of serum levels of FGF-23.
In univariate analysis, increased serum alkaline phosphatases, PTH, and age and decreased serum calcitriol and eGFR were each significantly associated with increased serum FGF-23; calcitriol was the strongest univariate predictor. In the multivariate model, decreased eGFR and calcitriol were found to be independently associated with increased serum FGF-23. These variables explain 26% of the variation of FGF-23 (P < 0.0001).
Regulators of serum levels of calcitriol.
In univariate analysis, decreased serum FGF-23 and phosphate and increased serum calcidiol, eGFR, and age were all significantly associated with increased serum calcitriol; FGF-23 was the strongest univariate predictor. In multivariate analysis, increased calcidiol and decreased phosphate and FGF-23 were observed to be independently associated with increased serum calcitriol. These variables explain 31% of the variation in calcitriol (P < 0.0001).
Regulators of serum levels of PTH.
In univariate analysis, increased age, increased serum alkaline phosphatase and FGF-23, and decreased serum calcidiol and eGFR were all significantly associated with increased PTH; eGFR was the strongest univariate predictor. In the multivariate analysis decreased eGFR and calcidiol were observed to be independently associated with increased PTH. These variables explain 26% of the variation of PTH (P < 0.0001).
Regulators of 24h-FEPhos.
In univariate analysis, increased age, serum FGF-23, and PTH and decreased eGFR were all significantly associated with increased 24h-FEPhos; PTH was the strongest univariate predictor. In the multivariate analysis, decreased eGFR and increased PTH were observed to be independently associated with increased 24h-FEPhos. These variables explain 30% of the variation of 24h-FEPhos (P < 0.0001).
Figure 2B shows the 24h-FEPhos in patients dichotomized according to the serum level of FGF-23 (cutoff 50 pg/ml) and PTH (cutoff 40 ng/L). There were no patients presenting with low FGF-23 and high PTH levels. Significant differences in 24h-FEPhos were observed among the remaining subgroups (overall ANOVA P = 0008). Serum phosphate levels and 24h-phosphaturia were similar across strata (data not shown).
Discussion
The most important finding of this cross-sectional study in 125 patients with CKD stages 1 to 3 is that serum phosphate levels were inversely associated with eGFR in early CKD despite the recruitment of compensatory mechanisms in which FGF-23 seems to play a central role.
The inverse association between serum phosphate levels and eGFR was statistically significant among patients with eGFR below 60 ml/min per 1.73 m2 only. This relationship between kidney function and serum phosphate is in agreement with observations made in recent large-scale epidemiologic studies (19,20). It should however be of note that the rise in serum phosphate levels occurred almost exclusively within the normal range.
Serum phosphate levels were increased in patients with early CKD despite compensatory increments in renal phosphate excretion. Our data confirm and extend data from previous studies showing that an increased renal phosphate excretion in patients with CKD is driven, at least partly, by PTH and FGF-23 (3,5–7). Both hormones were inversely associated with eGFR. Contrary to others (11), we observed this inverse relationship already in patients with CKD stages 1 to 2. FGF-23 levels in patients with CKD stages 1 to 2 were significantly higher than those observed in 20 healthy individuals (48.4 [30.6 to 61] versus 31.7 [27.1 to 39.2] ng/L, P < 0.0001). It should be of note that FGF-23 levels above the upper normal limit were observed in 61% of the patients, as opposed to 10% for PTH. Although the design of our study precludes formal conclusions concerning temporal relationships, our data support the hypothesis that elevations of FGF-23 precede elevations of PTH.
The prevalence of hyperparathyroidism observed in the present cohort is substantially lower than that reported previously in patients with comparable kidney function (4,21). This discrepancy may be explained by differences in case mix (e.g., race) and PTH assay (22,23). Contrary to others, we measured whole PTH and thereby avoided bias caused by accumulation of PTH fragments (23).
PTH and FGF-23 promote renal phosphate wasting through internalization of the sodium phosphate cotransporter IIa and IIc from the proximal tubular apical membrane (6). In agreement with data recently obtained in renal transplant recipients (24), the fractional renal phosphate excretion was highest in those patients with both a high FGF-23 and PTH level, which suggests that both hormones act synergistically to induce renal phosphate wasting (Figure 2B).
As opposed to PTH, we failed to find an independent effect of FGF-23 on the fractional excretion of phosphate. This intriguing observation contrasts with data reported by Gutierrez et al. (3). It should however be of note that we assessed the 24h-fractional excretion of phosphate, which much more than the fasting fractional excretion of phosphate reflects the actual dietary phosphate exposure. The failure to find an independent association between the 24h-fractional excretion of phosphate and FGF-23 may thus be explained by the fact that FGF-23 as opposed to PTH is not an acute regulator of dietary phosphorus handling (25,26).
The variables assessed in this study moreover explain only 30% of the variation of the FEPhos. The effect of other variables such as Klotho and magnesium (27) remains to be explored. Recent evidence points to the existence of a gut-renal signaling axis by which intestinal phosphate rapidly modulates renal phosphate reabsorption independently of PTH and FGF-23 (28). The effect of (early) CKD on this gut-renal axis remains to be studied.
Besides an increased urinary phosphate excretion, an impaired gastrointestinal phosphate absorption may help to maintain phosphate homeostasis in early CKD. We observed a significant direct association between serum calcitriol and eGFR. Acknowledging that calcitriol stimulates sodium phosphate cotransport across the intestinal wall (29–31), it may be hypothesized that the gastrointestinal absorption of phosphate is already impaired in early CKD. However, this hypothesis remains to be tested by formal (although complex) balance studies in humans.
Low substrate availability and high serum levels of phosphate and FGF-23 were found to be independently associated with low serum concentrations of calcitriol. These clinical associations confirm earlier experimental and animal data (8,32). In addition to its direct inhibition of the renal 1-α-hydroxylase (CYP27B1), FGF-23 increases the degradation of 1,25(OH)2D by the 24-hydroxylase (CYP24A1) (8). Finally, FGF-23 also acts directly on the parathyroid gland to suppress PTH secretion (33), which abolishes PTH-mediated stimulation of CYP27B1, and further suppresses production of 1,25(OH)2D. This mechanism may become obsolete in advanced CKD because of downregulation of the Klotho-FGFR1c receptor complex (34).
Low calcitriol levels also compromise intestinal calcium absorption, especially when dietary calcium intake is low (35–37). Low calcitriol levels may thus contribute to the hypocalciuria, observed in this study and in previous studies examining patients with mild-to-moderate renal insufficiency (2).
The complexity of sHPT physiopathology is well recognized. Our data are in favor of the hypothesis that the FGF-23–bone–kidney axis might be the effector of a “phosphate trade-off” that compensates for the limited renal phosphate excretion caused by the reduced nephron mass (10). In this view, reduced renal phosphate excretion leads to increased FGF-23 secretion from the bone. Increased FGF-23 levels act on the kidney to inhibit phosphate reabsorption and to suppress calcitriol levels. Low calcitriol levels impair intestinal phosphate and calcium absorption. Inadequate calcium absorption prompts adaptive responses by the parathyroid glands to maintain blood ionized calcium concentrations (38). FGF-23 thus adds a new dimension to the well-known 25-year-old trade-off theory, according to which hyperparathyroidism is the price to pay for preventing hyperphosphatemia and hypocalcemia (39).
There has been considerable interest recently in the relationship between increasing serum phosphate levels and adverse outcomes. Many epidemiologic studies have pointed to the association between hyperphosphatemia and increased risk of all-cause and cardiovascular death in CKD patients, independent of calcium and PTH levels (40,41). Recent data demonstrated that higher levels of serum phosphate are associated with adverse outcomes even in the absence of kidney disease and/or hyperphosphatemia (20,42–44). The mechanisms subtending the risk associated with serum phosphate are unclear. Investigators have suggested that phosphate may increase cardiovascular risk through promoting vascular calcification (45,46) or peripheral arterial stiffness (47). Others suggest that higher serum phosphate levels exert their putative toxic effect indirectly by increasing circulating FGF-23 and PTH levels (48,49) or suppressing calcitriol levels (50). In this study, low calcitriol levels were the only parameter found to be significantly and independently associated with high serum phosphate levels (R2 0.13, P < 0.0001). Low calcitriol levels are hypothesized to decrease cardiac contractility and to contribute to arteriosclerosis and endothelial dysfunction (51,52). In addition, clinical and experimental data indicate that high serum phosphate levels and phosphate loading may accelerate the progression of CKD (12,53,54).
We acknowledge several limitations of this study. First, the cross-sectional design limited our ability to examine longitudinal changes in FGF-23, vitamin D, PTH, and mineral levels in individual patients over time as renal disease progressed; thus, we cannot infer causality or the direction of the associations that we identified. Our observation that disturbances of mineral metabolism occur very early in the course of CKD should encourage investigators to enroll patients with CKD stages 1 to 2 in the yet-to-be-performed prospective study. A second limitation is the lack of information on the exact time lag between the last food intake and the blood sampling. This limitation introduced the possibility that dietary variability influenced the results. According to recent data from NHANES, the effect of fasting is limited when the serum phosphate is measured in the morning, as we did in this study (55). A major strength of our study is the availability of an extensive mineral metabolism data set (including urinary indices) in a relatively large cohort of early CKD patients. In addition, we measured both PTH and FGF-23 by full-length assays and thereby avoided any bias caused by the variable retention of inactive C-terminal fragments (13,56).
Conclusions
In conclusion, our data indicate that the rise of serum phosphate levels in progressive CKD is attenuated but not prevented by homeostatic compensatory mechanisms in which FGF-23 plays a central role. Furthermore, our data are in favor of the new paradigm for the pathogenesis of secondary hyperparathyroidism according to which a reduced phosphate excretion capacity is the principal abnormality that initiates this complication. A clinical implication of our study is that measures to restrict phosphate loading (diet and phosphate binder therapy) should be considered at an earlier stage than is currently practiced (57).
Disclosures
None.
Acknowledgments
Part of this work has been presented at the American Society of Nephrology, Renal Week, San Diego, October 27 through November 1, 2009.
Footnotes
Published online ahead of print. Publication date available at www.cjasn.org.
References
- 1.Nemere I: The ins and outs of phosphate homeostasis. Kidney Int 72: 140–142, 2007 [DOI] [PubMed] [Google Scholar]
- 2.Craver L, Marco MP, Martinez I, Rue M, Borras M, Martin ML, Sarro F, Valdivielso JM, Fernandez E: Mineral metabolism parameters throughout chronic kidney disease stages 1–5—achievement of K/DOQI target ranges. Nephrol Dial Transplant 22: 1171–1176, 2007 [DOI] [PubMed] [Google Scholar]
- 3.Gutierrez O, Isakova T, Rhee E, Shah A, Holmes J, Collerone G, Juppner H, Wolf M: Fibroblast growth factor-23 mitigates hyperphosphatemia but accentuates calcitriol deficiency in chronic kidney disease. J Am Soc Nephrol 16: 2205–2215, 2005 [DOI] [PubMed] [Google Scholar]
- 4.Levin A, Bakris GL, Molitch M, Smulders M, Tian J, Williams LA, Andress DL: Prevalence of abnormal serum vitamin D, PTH, calcium, and phosphorus in patients with chronic kidney disease: Results of the study to evaluate early kidney disease. Kidney Int 71: 31–38, 2007 [DOI] [PubMed] [Google Scholar]
- 5.Berndt T, Kumar R: Phosphatonins and the regulation of phosphate homeostasis. Annu Rev Physiol 69: 341–359, 2007 [DOI] [PubMed] [Google Scholar]
- 6.Liu S, Quarles LD: How fibroblast growth factor 23 works. J Am Soc Nephrol 18: 1637–1674, 2007 [DOI] [PubMed] [Google Scholar]
- 7.Shigematsu T, Kazama J, Yamamashita T, Fukumoto S, Hosova T, Gejyo FFM: Possible involvement of circulating fibroblast growth factor 23 in the development of secondary hyperparathyroidism associated with renal insufficiency. Am J Kidney Dis 44: 250–256, 2004 [DOI] [PubMed] [Google Scholar]
- 8.Shimada T, Hasegawa H, Yamazaki Y, Muto T, Hino R, Takeuchi Y, Fujita T, Nakahara K, Fukumoto S, Yamashita T: FGF-23 is a potent regulator of vitamin D metabolism and phosphate homeostasis. Bone Miner Res 19: 429–435, 2004 [DOI] [PubMed] [Google Scholar]
- 9.Liu S, Tang W, Zhou J, Stubbs J, Luo Q, Pi M, Quarles L: Fibroblast growth factor 23 is a counter-regulatory phosphaturic hormone for vitamin D. J Am Soc Nephrol 17: 1305–1315, 2006 [DOI] [PubMed] [Google Scholar]
- 10.Wetmore JB, Quarles LD: Calcimimetics or vitamin D analogs for suppressing parathyroid hormone in end-stage renal disease: Time for a paradigm shift? Nat Clin Pract Nephrol 5: 24–33, 2009 [DOI] [PMC free article] [PubMed] [Google Scholar]
- 11.Westerberg PA, Linde T, Wikstrom B, Ljunggren O, Stridsberg M, Larsson TE: Regulation of fibroblast growth factor-23 in chronic kidney disease. Nephrol Dial Transplant 22: 3202–3207, 2007 [DOI] [PubMed] [Google Scholar]
- 12.Fliser D, Kollerits B, Neyer U, Ankerst DP, Lhotta K, Lingenhel A, Ritz E, Kronenberg F: Fibroblast growth factor 23 (FGF23) predicts progression of chronic kidney disease: The mild to moderate kidney disease (MMKD) study. J Am Soc Nephrol 18: 2601–2608, 2007 [DOI] [PubMed] [Google Scholar]
- 13.Ito N, Fukumoto S, Takeuchi Y, Yasuda T, Hasegawa Y, Takemoto F, Tajima T, Dobashi K, Yamazaki Y, Yamashita T, Fujita T: Comparison of two assays for fibroblast growth factor (FGF)-23. J Bone Miner Metab 23: 435–440, 2005 [DOI] [PubMed] [Google Scholar]
- 14.Bouillon R, Van Herck E, Jans I, Tan BK, Van Baelen H, De Moor P: Two direct (nonchromatographic) assays for 25-hydroxyvitamin D. Clin Chem 30: 1731–1736, 1984 [PubMed] [Google Scholar]
- 15.Bouillon R, De Moor P, Baggiolini EG, Uskokovic MR: A radioimmunoassay for 1,25-dihydroxycholecalciferol. Clin Chem 26: 562–567, 1980 [PubMed] [Google Scholar]
- 16.Bouillon R, Coopmans W, Degroote DE, Radoux D, Eliard PH: Immunoradiometric assay of parathyrin with polyclonal and monoclonal region-specific antibodies. Clin Chem 36: 271–276, 1990 [PubMed] [Google Scholar]
- 17.National Kidney Foundation: K/DOQI clinical practice guidelines for bone metabolism and disease in chronic kidney disease. Am J Kidney Dis 42: S1–S201, 2003 [PubMed] [Google Scholar]
- 18.Botev R, Mallie JP, Couchoud C, Schuck O, Fauvel JP, Wetzels JFM, Lee N, De Santo NG, Cirillo M: Estimating glomerular filtration rate: Cockcroft-Gault and modification of diet in renal disease formulas compared to renal inulin clearance. Clin J Am Soc Nephrol 4: 899–906, 2009 [DOI] [PMC free article] [PubMed] [Google Scholar]
- 19.Hsu Cy, Chertow GM: Elevations of serum phosphorus and potassium in mild to moderate chronic renal insufficiency. Nephrol Dial Transplant 17: 1419–1425, 2002 [DOI] [PubMed] [Google Scholar]
- 20.Tonelli M, Sacks F, Pfeffer M, Gao Z, Curhan G, for the Cholesterol And Recurrent Events (CARE) Trial Investigators: Relation between serum phosphate level and cardiovascular event rate in people with coronary disease. Circulation 112: 2627–2633, 2005 [DOI] [PubMed] [Google Scholar]
- 21.Moranne O, Froissart M, Rossert J, Gauci C, Boffa JJ, Haymann JP, M'rad MB, Jacquot C, Houillier P, Stengel B, Fouqueray B, the NephroTest Study Group: Timing of onset of CKD-related metabolic complications. J Am Soc Nephrol 20: 164–171, 2009 [DOI] [PMC free article] [PubMed] [Google Scholar]
- 22.Gupta A, Kallenbach LR, Zasuwa G, Divine GW: Race is a major determinant of secondary hyperparathyroidism in uremic patients. J Am Soc Nephrol 11: 330–334, 2000 [DOI] [PubMed] [Google Scholar]
- 23.Zehnder D, Landray MJ, Wheeler DC, Fraser W, Blackwell L, Nuttall S, Hughes SV, Townend J, Ferro C, Baigent C, Hewison M: Cross-sectional analysis of abnormalities of mineral homeostasis, vitamin D and parathyroid hormone in a cohort of pre-dialysis patients. The chronic renal impairment in Birmingham (CRIB) study. Nephron Clin Pract 107: c109–c116, 2007 [DOI] [PubMed] [Google Scholar]
- 24.Evenepoel P, Naesens M, Claes K, Kuypers D, Vanrenterghem Y: Tertiary ‘hyperphosphatoninism’ accentuates hypophosphatemia and suppresses calcitriol levels in renal transplant recipients. Am J Transplant 7: 1193–1200, 2007 [DOI] [PubMed] [Google Scholar]
- 25.Isakova T, Gutierrez O, Shah A, Castaldo L, Holmes J, Lee H, Wolf M: Postprandial mineral metabolism and secondary hyperparathyroidism in early CKD. J Am Soc Nephrol 19: 615–623, 2008 [DOI] [PMC free article] [PubMed] [Google Scholar]
- 26.Nishida Y, Taketani Y, Yamanaka-Okumura H, Imamura F, Taniguchi A, Sato T, Shuto E, Nashiki K, Arai H, Yamamoto H, Takeda E: Acute effect of oral phosphate loading on serum fibroblast growth factor 23 levels in healthy men. Kidney Int 70: 2141–2147, 2006 [DOI] [PubMed] [Google Scholar]
- 27.Thumfart J, Jung S, Amasheh S, Kraemer S, Peters H, Sommer K, Biber J, Murer H, Meij I, Querfeld U, Wagner CA, Muller DN: Magnesium stimulates renal phosphate reabsorption. Am J Physiol Renal Physiol 295: F1126–F1133, 2008 [DOI] [PubMed] [Google Scholar]
- 28.Berndt T, Thomas LF, Craig TA, Sommer S, Li X, Bergstralh EJ, Kumar R: Evidence for a signaling axis by which intestinal phosphate rapidly modulates renal phosphate reabsorption. Proc Natl Acad Sci U S A 104: 11085–11090, 2007 [DOI] [PMC free article] [PubMed] [Google Scholar]
- 29.Ramirez JA, Emmett M, White MG, Fathi N, Santa Ana CA, Morawski SG, Fordtran JS: The absorption of dietary phosphorus and calcium in hemodialysis patients. Kidney Int 30: 753–759, 1986 [DOI] [PubMed] [Google Scholar]
- 30.Xu H, Bai L, Collins JF, Ghishan FK: Age-dependent regulation of rat intestinal type IIb sodium-phosphate cotransporter by 1,25-(OH)2 vitamin D3. Am J Physiol Cell Physiol 282: C487–C493, 2002 [DOI] [PubMed] [Google Scholar]
- 31.Williams KB, DeLuca HF: Characterization of intestinal phosphate absorption using a novel in vivo method. Am J Physiol Endocrinol Metab 292: E1917–E1921, 2007 [DOI] [PubMed] [Google Scholar]
- 32.Dusso AS, Brown AJ, Slatopolsky E: Vitamin D. Am J Physiol Renal Physiol 289: F8–F28, 2005 [DOI] [PubMed] [Google Scholar]
- 33.Ben-Dov IZ, Galitzer H, Lavi-Moshayoff V, Goetz R, Kuro-o M, Mohammadi M, Sirkis R, Naveh-Many T, Silver J: The parathyroid is a target organ for FGF23 in rats. J Clin Invest 117: 4003–4008, 2007 [DOI] [PMC free article] [PubMed] [Google Scholar]
- 34.Galitzer H, Ben-Dov IZ, Silver J, Naveh-Many T: Parathyroid cell resistance to fibroblast growth factor 23 in secondary hyperparathyroidism of chronic kidney disease. Kidney Int 77: 211–218, 2010 [DOI] [PubMed] [Google Scholar]
- 35.Coburn JW, Popovtzer M, Massry SG, Kleeman CR: The physicochemical state and renal handling of divalent ions in chronic renal failure. Arch Int Med 124: 302–311, 1969 [PubMed] [Google Scholar]
- 36.Coburn JW, Koppel MH, Brickman AS, Massry SG: Study of intestinal absorption of calcium in patients with renal failure. Kidney Int 3: 264–272, 1973 [DOI] [PubMed] [Google Scholar]
- 37.Popovtzer MM, Schainuck LJ, Massry SG, Kleeman CR: Divalent ion excretion in chronic kidney disease: Relation to degree of renal insufficiency. Clin Sci 38: 297–307, 1970 [DOI] [PubMed] [Google Scholar]
- 38.Goodman WG, Quarles LD: Development and progression of secondary hyperparathyroidism in chronic kidney disease: Lessons from molecular genetics. Kidney Int 74: 276–288, 2008 [DOI] [PubMed] [Google Scholar]
- 39.Slatopolsky E, Bricker NS: The role of phosphorus restriction in the prevention of secondary hyperparathyroidism in chronic renal disease. Kidney Int 4: 141–145, 1973 [DOI] [PubMed] [Google Scholar]
- 40.Block GA, Klassen PS, Lazarus JM, Ofsthun N, Lowrie EG, Chertow GM: Mineral metabolism, mortality, and morbidity in maintenance hemodialysis. J Am Soc Nephrol 15: 2208–2218, 2004 [DOI] [PubMed] [Google Scholar]
- 41.Kestenbaum B, Sampson JN, Rudser KD, Patterson DJ, Seliger SL, Young B, Sherrard DJ, Andress DL: Serum phosphate levels and mortality risk among people with chronic kidney disease. J Am Soc Nephrol 16: 520–528, 2005 [DOI] [PubMed] [Google Scholar]
- 42.Dhingra R, Sullivan LM, Fox CS, Wang TJ, D'Agostino RB, Sr, Gaziano JM, Vasan RS: Relations of serum phosphorus and calcium levels to the incidence of cardiovascular disease in the community. Arch Intern Med 167: 879–885, 2007 [DOI] [PubMed] [Google Scholar]
- 43.Onufrak SJ, Bellasi A, Shaw LJ, Herzog CA, Cardarelli F, Wilson PW, Vaccarino V, Raggi P: Phosphorus levels are associated with subclinical atherosclerosis in the general population. Atherosclerosis 199: 424–431, 2008 [DOI] [PubMed] [Google Scholar]
- 44.Foley RN, Collins AJ, Herzog CA, Ishani A, Kalra PA: Serum phosphorus levels associate with coronary atherosclerosis in young adults. J Am Soc Nephrol 20: 397–404, 2009 [DOI] [PMC free article] [PubMed] [Google Scholar]
- 45.Jono S, McKee MD, Murry CE, Shioi A, Nishizawa Y, Mori K, Morii H, Giachelli CM: Phosphate regulation of vascular smooth muscle cell calcification. Circ Res 87: 10e–117, 2000 [DOI] [PubMed] [Google Scholar]
- 46.Adeney KL, Siscovick DS, Ix JH, Seliger SL, Shlipak MG, Jenny NS, Kestenbaum BR: Association of serum phosphate with vascular and valvular calcification in moderate CKD. J Am Soc Nephrol 20: 381–387, 2009 [DOI] [PMC free article] [PubMed] [Google Scholar]
- 47.Ix JH, de Boer IH, Peralta CA, Adeney KL, Duprez DA, Jenny NS, Siscovick DS, Kestenbaum BR: Serum phosphorus concentrations and arterial stiffness among individuals with normal kidney function to moderate kidney disease in MESA. Clin J Am Soc Nephrol 4: 609–615, 2009 [DOI] [PMC free article] [PubMed] [Google Scholar]
- 48.Tentori F, Blayney MJ, Albert JM, Gillespie BW, Kerr PG, Bommer J, Young EW, Akizawa T, Akiba T, Pisoni RL, Robinson BM, Port FK: Mortality risk for dialysis patients with different levels of serum calcium, phosphorus, and PTH: The dialysis outcomes and practice patterns study (DOPPS). Am J Kidney Dis 52: 519–530, 2008 [DOI] [PubMed] [Google Scholar]
- 49.Gutierrez OM, Mannstadt M, Isakova T, Rauh-Hain JA, Tamez H, Shah A, Smith K, Lee H, Thadhani R, Juppner H, Wolf M: Fibroblast growth factor 23 and mortality among patients undergoing hemodialysis. N Engl J Med 359: 584–592, 2008 [DOI] [PMC free article] [PubMed] [Google Scholar]
- 50.Wolf M, Shah A, Gutierrez O, Ankers E, Monroy M, Tamez H, Steele D, Chang Y, Camargo CA, Jr, Tonelli M, Thadhani R: Vitamin D levels and early mortality among incident hemodialysis patients. Kidney Int 72: 1004–1013, 2007 [DOI] [PubMed] [Google Scholar]
- 51.London GM, Guerin AP, Verbeke FH, Pannier B, Boutouyrie P, Marchais SJ, Metivier F: Mineral metabolism and arterial functions in end-stage renal disease: Potential role of 25-hydroxyvitamin D deficiency. J Am Soc Nephrol 18: 613–620, 2007 [DOI] [PubMed] [Google Scholar]
- 52.Kovesdy CP, Kalantar-Zadeh K: Vitamin D receptor activation and survival in chronic kidney disease. Kidney Int 73: 1355–1363, 2008 [DOI] [PubMed] [Google Scholar]
- 53.Ibels L, Alfrey AC, Haut L, Huffer WE: Preservation of function in experimental renal disease by dietary restriction of phosphate. N Engl J Med 298: 122–126, 1978 [DOI] [PubMed] [Google Scholar]
- 54.Schwarz S, Trivedi BK, Kalantar-Zadeh K, Kovesdy CP: Association of disorders in mineral metabolism with progression of chronic kidney disease. Clin J Am Soc Nephrol 1: 825–831, 2006 [DOI] [PubMed] [Google Scholar]
- 55.de Boer IH, Rue TC, Kestenbaum B: Serum phosphorus concentrations in the Third National Health and Nutrition Examination Survey (NHANES III). Am J Kidney Dis 53: 399–407, 2009 [DOI] [PMC free article] [PubMed] [Google Scholar]
- 56.Burnett S-A, Gunawardene S, Bringhurst FR, Juppner H, Lee H, Finkelstein JS: Regulation of C-terminal and intact FGF-23 by dietary phosphate in men and women. J Bone Miner Res 21: 1187–1196, 2006 [DOI] [PubMed] [Google Scholar]
- 57.Oliveira RB, Cancela ALE, Graciolli FG, Dos Reis LM, Draibe SA, Cuppari L, Carvalho AB, Jorgetti V, Canziani ME, Moyses RMA: Early control of PTH and FGF23 in normophosphatemic CKD patients: A new target in CKD-MBD Therapy? Clin J Am Soc Nephrol 5: 286–291, 2010 [DOI] [PMC free article] [PubMed] [Google Scholar]