

Abstract
The formulation of the Finite-Difference Time-Domain (FDTD) approach is presented in the framework of its potential applications to in vivo flow cytometry based on light scattering. The consideration is focused on comparison of light scattering by a single biological cell alone in controlled refractive index matching conditions and by cells labeled by gold nanoparticles. The optical schematics including phase contrast (OPCM) microscopy as a prospective modality for in vivo flow cytometry is also analyzed. The validation of the FDTD approach for the simulation of flow cytometry may open a new avenue in the development of advanced cytometric techniques based on scattering effects from nanoscale targets.
Keywords: Finite-difference time-domain (FDTD) method, light scattering, cytometry, gold nanoparticle, optical phase contrast microscopy, refractive index matching, image contrast enhancement, nanoscale cell imaging
Introduction
Flow cytometry is well-established, powerful analytical tool that has led to many revolutionary discoveries in cell biology [1-3]. In this technique, cells are introduced into an artificial flow and are hydrodynamically focused into single file orientation so that laser-induced fluorescence and/or scattered light reflecting off of them could be detected by photodetectors. This is a highly accurate technology providing fast (a few million cells in a minute) multi-parameter quantification of the biological properties of individual cells at sub-cellular and molecular levels including cell size, shape and intracellular heterogeneities. In particular, analysis of forward and orthogonal scattering of light allows discrimination between lymphocytes, monocytes, and granulocytes [2]. Nevertheless, the invasive extraction of cells from a living system may lead to changes in cell properties and prevents the long-term study of cells in their native biological environment. In vivo flow cytometry using vessels with natural bioflows containing of cells of interests can potentially overcome these problems. To reduce the interference from light scattering background from surrounding tissue gold nanoparticles (NPs) with strong plasmon scattering resonance properties can be applied as flow cytometry contrast agents.
The development of advanced flow cytometry techniques requires an understanding of light interaction features with cells alone as well as with cells in the presence of NPs. Specifically, information about the nature of the light scattering mechanisms from cell microstructures determines the sensitivity of the light scattering parameters to pathological changes in the cellular morphology. Unfortunately, the biological origins of the differences in the light scattering patterns from normal and pathological (for example, pre-cancerous and cancerous) cells are not fully understood [1, 4-7]. This could make the interpretation of the in vivo flow cytometry results difficult and inefficient.
In many cytometry and cell imaging studies optical software simulation and modeling tools provide the only means to a deeper understanding of the underlying physical and biochemical processes [8]. The computational modeling of light scattering from single biological cells is of particular interest since it could provide information about the fundamental light-cell interaction phenomena that is highly relevant for the practical interpretation of cell scattering signatures and images by pathologists. The modeling of light interaction with cells is usually approached from a single particle electromagnetic wave scattering perspective. The single particle scattering approach is of particular relevance for experimental configurations based on flow cytometry and could be characterized by two specific features. First, the wavelength of light is larger than or comparable to the size of the scattering sub-cellular structures. Second, biological cells have irregular shapes and inhomogeneous refractive index distributions which makes it impossible to use analytical modeling approaches. Both features necessitate the use of numerical modeling approaches derived from rigorous electromagnetic theory such as: the method of separation of variables, the finite element method, the method of lines, the point matching method, the method of moments, the discrete dipole approximation method, the null-field (extended boundary condition) method, the T-matrix electromagnetic scattering approach, the surface Green's function electromagnetic scattering approach, and the finite-difference time domain (FDTD) method [9].
The FDTD simulation and modeling of the light interaction with single and multiple, normal and pathological biological cells and sub-cellular structures has attracted the attention of researchers since 1996 [8, 10-23]. The FDTD approach was first adopted as a better alternative of Mie theory [24] allowing for the modeling of irregular cell shapes and inhomogeneous distributions of complex refractive index values. The emerging relevance of nanoscale cell imaging research has established the FDTD method as one of the powerful tools for studying the nature of light-cell interactions within the context of cytometry. One could identify à number of cytometry related research directions based on the FDTD approach. The first one focuses on studying the lateral light scattering patterns for the early detection of pathological changes in cancerous cells such as increased nuclear size and degrees of nuclear pleomorphism and nuclear-to-cytoplasmic ratios [8, 10-16]. The second research direction explores the application of the FDTD method to the modeling of forward light transmission and scattering from cells for application in advanced cell imaging based on optical phase contrast microscopy (OPCM) techniques [19-23]
This paper has two main objectives. First, to present a number of examples illustrating the application of the FDTD approach to the modeling the light scattering configurations associated with flow cytometry. Second, it provides a thorough discussion of the potential relevance of these new developments for advanced cytometry research by pointing out potential new research directions. It provides a very brief description the FDTD method focusing on features associated with its application to the modeling of light scattering and optical phase contrast microscope (OPCM) cell imaging experiments. The examples include light scattering from and OPCM imaging of single biological cells in conditions of controlled refractive index matching and labeling by diffused and clustered gold nanoparticles. The paper concludes by a discussion and suggestions for future research.
1. Formulation of the FDTD method
1.1 The basic FDTD numerical scheme
The finite-difference time domain (FDTD) technique is an explicit numerical method for solving Maxwell's equations. It was invented by Yee in 1966 [25]. The advances of the various FDTD approaches and applications have been periodically reviewed by Taflove et al. [26]. Details about the numerical aspects of the explicit finite-difference approximation of Maxwell's equations in space and time can be found in Taflove et al. [26] and Sun et al. [27-29].
In a source free absorptive dielectric medium Maxwell's equations have the form:
| (1a) |
| (1b) |
where E⃗ and H⃗ are the vectors of the electric and magnetic fields, respectively, μ0 is the vacuum permeability and ε0ε is the permittivity of the medium. Assuming a harmonic [∝ exp(−iωt)] time dependence of the electric and magnetic fields and a complex value of the relative permittivity ε = εr + iεi transforms Eq. (1b) as follows:
| (2) |
where τ = ωεr / εi and ω is the angular frequency of the light. The continuous coordinates (x, y, z) are replaced by discrete spatial and temporal points: xi = iΔs, yj = jΔs, zk = kΔs, tn = nΔt, where i = 0,1,2,…, I, J = 0,1,2,…, J, k = 0,1,2,…, K, n = 0,1,2,…, N. Δs and Δt denote the cubic cell size and time increment, respectively. Using central difference approximations for the temporal derivatives over the time interval [nΔt, (n + 1)Δt] leads to
| (3) |
where the electric and the magnetic fields are calculated at alternating half-time steps. The discretization of Eq. (3) over the time interval [(n − 1/2)Δt, (n + 1/2)Δt] (one half time step earlier than the electric field) ensures second-order accuracy of the numerical scheme and takes the form:
| (4) |
where Ex, and Hy, Hz denote the electric and magnetic field components, respectively. Eq. (1b) is discretized in a very similar way [26, 27-29]. The numerical stability of the FDTD scheme is ensured through the Courant-Friedrichs-Levy condition [25-26]: cΔt ≤ (1/Δx2 + 1/Δy2 + 1/Δz2)−1/2, where c is the speed of light in the host medium andΔx, Δy, Δy are the spatial steps in the x, y and z direction, respectively. In our case Δx = Δy = Δz = Δs and Δt = Δs/2c.
1.2 Numerical excitation of the input wave
The FDTD approach uses the so-called total-field/scattered-field formulation [26, 29] to excite the input magnetic and electric fields and simulate a linearly polarized plane wave propagating in a finite region of a homogeneous absorptive dielectric medium. In this formulation, an arbitrary (in most cases rectangular) shape closed surface is defined inside of the computational domain and around the scattering object. Using the equivalence theorem [26] allows demonstrating that the input wave excitation within the closed surface can be replaced by the equivalent electric and magnetic currents located at the closed surface. Therefore, the input wave can be numerically excited at the closed surface by adding the electric ad magnetic field incident sources as follows:
| (5a) |
| (5b) |
where E⃗inc and H⃗inc are the incident fields and n⃗ is the inward normal vector of the closed surface [26]. If there is a scattering object inside of the closed surface, the interior fields will be the total fields (incident plus scattered) and the exterior fields are just the scattered fields. Details about the specific form of the components of Eq. (5) in the case of a rectangular close surface can be found in [26, 29].
1.3 Uni-axial perfectly matched layer absorbing boundary conditions
The FDTD numerical scheme presented here uses the uni-axial perfectly matcher layer (UPML) suggested by Sacks et al. [30] to truncate the absorptive host medium in the FDTD computational domain. The UPML approach is based on the physical introduction of absorbing anisotropic, perfectly matched medium layers at all sides of the rectangular computational domain. The anisotropic medium of each of these layers is uni-axial and is composed of both electric permittivity and magnetic permeability tensors [31, 32]. The introduction of the UPMLs leads to a modified UPML FDTD numerical scheme which is applied in the UPML parts of the computational domain. In the non-UPML region, the unmodified FDTD formulation is used (Eq. 4). More details on the numerical implementation of the UPML boundary conditions can be found in [26-32].
1.4 FDTD formulation of the light scattering properties from single cells
The calculation of the light scattering and extinction cross sections by cells in free space requires the far-field approximation for the electromagnetic fields [5, 26, 33]. The far-field approach has been also used [34] to study scattering and absorption by spherical particles in an absorptive host medium. However, when the host medium is absorptive, the scattering and extinction rates depend on the distance from the cell center. This could lead to ambiguities in the presentation and the interpretation of the light scattering results. Recently, an alternative approach based on Mie theory was suggested to calculate the single-scattering properties of a spherical object in an absorptive medium using the electromagnetic fields on the surface of the scattering object [35, 36]. This alternative approach was then extended and numerically implemented within the FDTD context to enable the calculation of the absorption and extinction rates of arbitrarily-shaped scattering objects in an absorptive medium [29]. The absorption and extinction rates calculated in this way depend on the size, shape and optical properties of the scattering object and the surrounding medium, but do not depend on the distance from it. The possibility to use the FDTD method in studying the lateral light scattering patterns from single cells in absorptive media is of critical importance for the modeling of flow cytometry experimental configurations where the absorption properties of the host (extra-cellular) medium could be an important scattering factor.
In order to define some of the key light scattering parameters, the incident field is decomposed in two components along the unit vectors e⃗α and e⃗β both laying in a plane perpendicular to direction of propagation of the input wave and defined as parallel and perpendicular to the scattering plane, respectively [18]:
| (6) |
The numerically calculated scattered field is decomposed in two components along the unit vectors α⃗ and β⃗ which are both perpendicular to the direction of its propagation and parallel and perpendicular to the scattering plane, respectively:
| (7) |
Thus the incident and scattered fields are specified relative to different sets of basis vectors. The relationship between the incident and scattered fields can be conveniently expressed in a matrix form:
| (8) |
where Sk = Sk (θ, φ), k = 1,2,3,4 are the elements of the amplitude scattering matrix and, in general, depend on the scattering angle θ and the azimuth angle φ [18]. In the case of the scattered wave the four Stokes parameters which take the form [5, 18, 34]:
| (9) |
The relation between the incident and the scattered Stokes parameters is given by the Mueller scattering matrix:
| (10) |
where , εh is the complex relative permittivity of the host medium, I0 Q0 U0 V0 are the Stokes parameters of the incident wave, R is the distance from the cell, and
The P matrix elements contain the full information about the scattering process. In non absorptive media the elements of the Mueller matrix (Eq. 10) can be used to define the scattering cross-section and anisotropy. The scattering cross-section σs is defined as the geometrical cross-section of a scattering object that would produce an amount of light scattering equal to the total observed scattered power in all directions. It can be expressed by the elements of the scattering matrix P and the Stokes parameters I0 Q0 U0 V0 of the incident light as follows [18]
| (11) |
In the case of a spherically symmetrical scattering object and non polarized light the Mueller scattering matrix component P11(θ) becomes the most relevant and the relationship (11) is reduced to the usual integral of the indicatrix with respect to the scattering angle:
| (12) |
Using P11(θ) the anisotropy parameter g can be expressed as follows:
| (13) |
In an absorptive medium, the elements of the Mueller scattering matrix (Eq. 10) depend on the radial distance from the scattering object and can not be directly related to the scattering cross-section as given above by Eq. (12). In this case the different elements of the matrix are used individually in the analysis of the scattering phenomena. In practice, their values are normalized by the total scattered rate in the radiation zone around the object, which is proportional to the integral of P11 for all scattering angles.
1.5 FDTD formulation of optical phase contrast microscopic (OPCM) imaging
The 3D FDTD formulation provided here is based on a modified version of the total-field/scattered-field (TFSF) formulation [26, 29] that was described earlier (Fig. 1a). It could be more appropriately called total-field/reflected-field (TFRF) formulation. The 3D TFRF formulation uses a TFSF region which contains the biological cell and extends beyond the limits of the simulation domain (Fig. 1b and Fig. 1c). The extension of the transverse dimension of the input field beyond the limits of the computational domain through the UPML boundaries would lead to distortions of its ideal plane wave shape and eventually distort the simulation results. To avoid these distortions one must use Bloch periodic boundary conditions (Fig. 1b and Fig. 1c) in the lateral x- and y-directions which are perpendicular to the direction of propagation – z[26].
Figure 1.
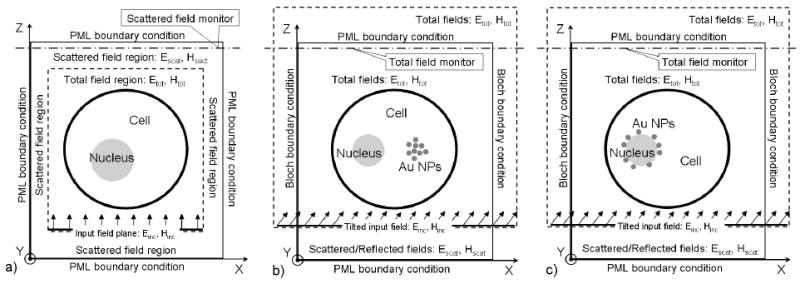
Schematic representation of the 3D FDTD formulations including: a) the standard TFSF formulation in the case of a cell with a nucleus; b) TFRF formulation in the case of a cell with a nucleus and a cluster of gold nanoparticles in the cytoplasm; c) TFRF formulation in the case of a cell with gold nanoparticles randomly distributed on the surface of the nucleus.
Phase contrast microscopy is utilized to produce high-contrast images of transparent specimens such as microorganisms, thin tissue slices, living cells and sub-cellular components such as nuclei and organelles and therefore could be used as a basis for phase-sensitive slide or flow cytometry. In a conventional flow cytometry configuration a beam of light of a single (or several) wavelength is directed onto a hydro-dynamically focused stream of fluid driving a periodical array of cells to flow through it. The OPCM simulation model requires the explicit availability of the forward scattered transverse distribution of the fields. The phase of the scattered field accumulated by a plane wave propagating through a biological cell within a cytometric cell flow will be used in the FDTD model of the OPCM that is described as the follows.
Figure 2a shows a possible flow cytometry configuration of a phase contrast microscope, where an image with a strong image contrast ratio is created by coherently interfering a reference (R) with a beam (D) that is diffracted from one particular cell in the cell flow. Relative to the reference beam, the diffracted beam has lower amplitude and is retarded in phase by approximately π/2 through interaction with the cell. The main feature in the design of the phase contrast cytometer is the spatial separation of the R beam from D wave front emerging from the cell. In addition, the amplitude of the R beam light must be reduced and the phase advanced or retarded by another ±π/2 in order to maximize the differences in the intensity between the cell and the background in the image plane. The mechanism for generating relative phase retardation has two-steps: i) the D beam is being retarded in phase by a quarter wavelength (i.e., π/2) at the specimen, and ii) the R beam is advanced (or retarded) in phase by a phase plate positioned in or very near the objective rear focal plane (Fig. 2a). This two-step process is enabled by a specially designed annular diaphragm – the annulus. The condenser annulus, which is placed in the condenser front focal plane, is matched in diameter and optically conjugated to the phase plate residing in the objective rear focal plane. The resulting image, where the total phase difference is translated by interference at the image plane into an amplitude variation, can have a high contrast ratio, particularly if both beams have the same amplitude.
Figure 2.
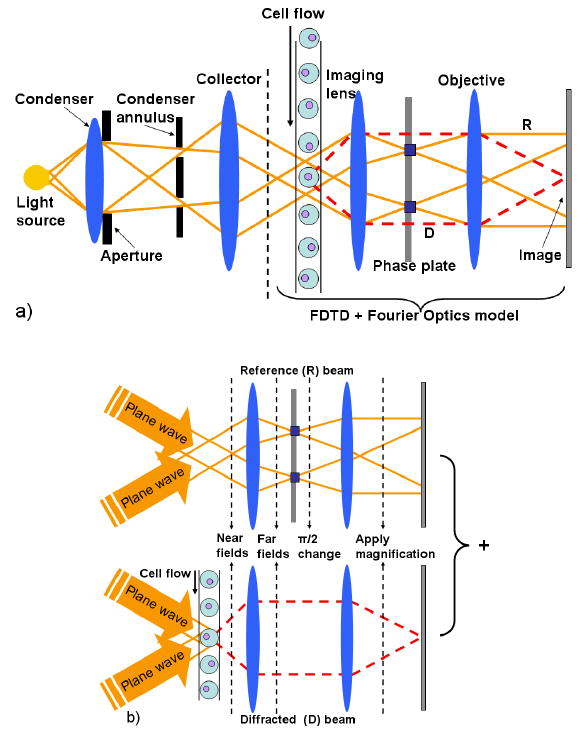
a) Schematic representation of an OPCM cytometer. b) 2D visual representation of the FDTD OPCM model using incoherent illumination by two planes waves at a polar angle of 30 deg. For each of the two plane waves the propagation of light is modeled as a combination of two parallel wave phenomena: i) propagation of the reference (R) beam without the cell flow, and ii) propagation of the diffracted (D) beam due to one particular cell of the cell flow.
Figure 2a illustrates the part of the microscope that will become the subject of FDTD modeling combined with Fourier optics. Figure 2b provides a visual representation illustrating the major steps in the FDTD OPCM model. The phase contrast microscope uses incoherent annular illumination that could be approximately modeled by adding up the results of eight different simulation using ideal input plane waves incident at a given polar angle (30 deg), an azimuthal angle (0, 90, 180 or 270 deg), and a specific light polarization (parallel or perpendicular to the plane of the graph). Every single FDTD simulation provides the near field components in a transverse monitoring plane located right behind the cell (Fig. 1).
The far field transformations use the calculated near fields right behind the cell and return the three complex components of the electromagnetic fields far enough from the location of the near fields, i.e. in the far field [26]. The amplitudes and the phases of the calculated far-field components can be used then to do Fourier optics with both the scattered and reference beams. We assume an ideal optical lens system that could be characterized by a given magnification factor. This simple model could be easily extended to include the numerical equivalent of the two lenses together with an additional model to take into account any aberrational effects. The magnification factor was implemented by merely modifying the angle of light propagation – it was applied to the far fields before the interference of the diffracted (D) and reference (R) beams at the image plane [26]. It was also possible to apply the effect of a numerical aperture NA which clips any light that has too steep an angle and would not be collected by the lens system. The OPCM images at the image plane are calculated by adding up the scattered and the reference beam at any desired phase offset Ψ:
| (14) |
The coefficient a and the phase Ψ are simulation parameters corresponding to the ability of the OPCM to adjust the relative amplitudes and the phase difference between the two beams.
2. FDTD simulation results of light scattering patterns from single cells
2.2 Effect of extra-cellular medium absorption on the light scattering patterns
This section describes the FDTD simulation results for the effect of absorption in the extra-cellular medium on the light scattering patterns from a single cell [18]. We consider two different cell geometries: the one considered in the previous section and another one with a shape of a spheroid (both cytoplasm and nucleus). The light is incident in the x-direction along the long axis of the spheroid. The size parameters of the cytoplasm are defined by 2πRa/λ0 = 40 and 2πRb,c/λ0 = 20, where Ra = a/2 and Rb,c = b/2 = c/2. The size parameters of the nucleus are defined by 2πra/λ0 =20 and 2πrb,c/λ0 =10, where ra and rb are the large and small radii of the nucleus, respectively. The cell refractive indices are: cytoplasm: 1.37; nucleus: 1.40, extra-cellular medium: 1.35, and 1.35+0.05i. The FDTD cell size is Δs = λ0/20. The number of mesh point are Nx = 147, Ny = 147 and Nz = 275. The number of simulation time steps is 14000. Figure 3 shows: i) the effect of absorption in the extra-cellular medium of spherical cells, and ii) the effect of cell shape (ideal sphere vs spheroid) in an absorptive extra-cellular medium [17, 18].
Figure 3.
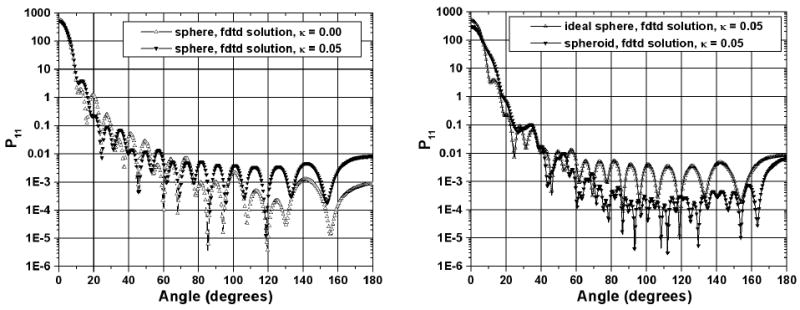
Normalized light scattering intensity distribution with scattering angle for two different cases: i) absorptive and non-absorptive extra-cellular medium for ideally spherical cells (left), and ii) absorptive extra-cellular medium for an ideal sphere and a spheroid (right). The values of the imaginary part of the refractive index of the extra-cellular medium are indicated in the insight.
A more detailed analysis of the two graphs shown in Figure 3 leads to some interesting findings. First, absorption in the extra-cellular material of spherical cells (Fig. 3, left graph) increases the intensity of the light scattering up to one order in the angle range between 90° (transverse scattering) and Ψ = 180° (backward scattering). The same light scattering feature was also found in the case of spheroid cells (not shown here). Second, the influence of absorption in the extra-cellular material is relatively more pronounced in the case of spherical as compared to spheroid cells (Fig. 3, right graph). Third, in the case of exact backward scattering and absorptive extra-cellular material, the light scattering intensity is approximately equal for both cell shapes. However this is not true for non-absorptive cell surroundings. This last finding could be very important for OCT and ñonfocal imaging systems, especially for studies in the wavelength ranges within the hemoglobin, water and lipids bands.
These findings show that the analysis of light scattering from isolated biological cells should necessarily account for the absorption effect of the surrounding medium. It could be particularly relevant in the case of optical immersion techniques using intra-tissue administration of appropriate chemical agents with absorptive optical properties [37-39]; however, this relevance does not appear to have been studied. It should be pointed out that whenever there is a matching of the refractive indices of a light scatterer and the background material, the scattering coefficient goes to zero and it is only the absorption in the scatterer or in the background material that will be responsible for the light beam extinction. Former research studies [40, 41] have examined the light scattering role of the absorption within the particle-based tissue phantoms. Our results provide some good preliminary insights about the light scattering role of absorption in the background material; however, it needs to be further studied.
3 FDTD simulation results of OPCM nanobioimaging
3.1 Cell structure
The 3D FDTD modeling of OPCM imaging of single biological cells in a number of different scenarios is based on the FDTD OPCM model briefly described above for the optical magnification factor M = 10 and the numerical aperture NA = 0.8. The cell is modeled as a dielectric sphere with a radius Rc = 5μm (Fig. 1). The cell membrane thickness is d = 20nm which corresponds to effective (numerical) thickness of approximately 10 nm. The cell nucleus is also spherical with a radius Rn = 1.5μm centered at a position which is 2.0 μm shifted from the cell center in a direction perpendicular to the direction of light propagation. The refractive index of the cytoplasm is ncyto = 1.36, of the nucleus nnuc = 1.14, of the membrane nmem = 1.47 and of the extra-cellular material next = 1.33 (no refractive index matching [RIM]) or 1.36 (RIM).
3.2 Optical clearing effect
The RIM between the cytoplasm and the extra-cellular medium leads to the optical clearing of the cell image. The optical clearing effect leads to the increased light transmission through cell due to the matching of the refractive indices of some of their components to that of the extra-cellular medium. The refractive index of the extra-cellular fluid can be externally controlled by the administration of an appropriate chemical agent [37-39]. Figure 4 shows the cross-sections of two cell images for different values of the phase offset Ψ between the reference and diffracted beam of the OPCM: 180° and 90°. The images illustrate the nature of the optical clearing effect and the value of its potential application for the early detection of cancerous cells by a careful examination of their nucleus size, eccentricity, morphology and chromatin texture (refractive index fluctuations) [15]. At no RIM conditions in both cases (Ψ = 180° and Ψ = 90°) the image of the nucleus is represented by a dip in the cell image. At RIM conditions the image contrast of the cell is drastically reduced to zero levels and it is only the image of the nucleus that remains sharply visible. The image of the nucleus is represented by a nice peak associated with the 3-dimensinal optical phase accumulation corresponding to its perfectly spherical shape and homogeneous refractive index distribution. A finer analysis of the two graphs shown in Fig. 4 will show that the diameter of the nucleus (the full width at the half-height of the nucleus image contrast peak) depends on the phase delay Ψ. At Ψ = 180° and no RIM conditions the diameter of the nucleus is estimated at value of ∼2.3 μm as compared to RIM conditions where it's value is 3.3 μm (the estimation accounts for the optical magnification factor ×10 of the system). At Ψ = 90° and no RIM conditions the diameter of the nucleus is estimated at a value of ∼3.05 μm as compared to RIM conditions where its value is 3.75 μm (the cell model used in the FDTD simulations has a nucleus with a diameter 3.0 μm). This shows that the OPCM should be preliminary set-up at a given optimum phase delay and the OPCM images should be used for relative measurements only after a proper calibration. The analysis of the graphs, however, shows an unprecedented opportunity for using the optical clearing effect for the analysis of any pathological changes in the eccentricity and the chromatin texture of cell nuclei within the context of OPCM cytometry configurations. This new opportunity is associated with the fact that at RIM the cell image is practically transformed into a much finer image of the nucleus.
Figure 4.
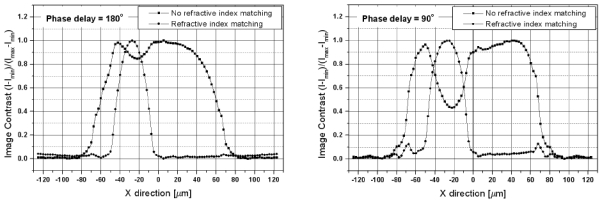
Cross-sections of FDTD-generated OPCM images of a single cell illustrating the optical clearing effect for different values of the phase offset Ψ between the reference and diffracted beam of the OPCM: 180° (on the left-hand side) and 90° (on the right-hand side). Matching the refractive index value of the extra-cellular material with that of the cytoplasm enhances the optical contrast and leads to a finer view of the morphological structure of the nucleus.
3.3 The cell imaging effect of gold nanoparticles
Gold nanoparticles (NPs) have the ability to resonantly scatter visible and near infrared light. The scattering ability is due to the excitation of surface plasmon resonances (SPR). It is extremely sensitive to their size, shape, and aggregation state offering a great potential for optical cellular imaging and detection labeling studies [42-47]. Our FDTD approach [19] uses the dispersion model for gold NPs derived from the experimental data provided by Johnson and Christy [48] where the total, complex-valued permittivity is given as:
| (15) |
The first term represents the contribution due to the basic, background permittivity. The second and third terms represent Lorentz and plasma contributions:
| (16) |
where all material constants are: εREAL = 7.077, εLORENTZ = 2.323, ω0 = 4.635×10¹⁵ Hz, δ0 = 9.267×10¹⁴ Hz, ωP = 1.391×10¹⁶ Hz, and νC = 1.411×10⁷ Hz [48].
Both the resonant and non-resonant cases were modeled. The ability to model these two different cases, together with the effect of optical clearing effect, provides the opportunity to numerically study the possibility for imaging the uptake of clusters of NPs – a scenario which needs to be further studied [19]. We have also used the FDTD technique to calculate the extinction cross-sections over a 400-900 nm wavelength range for a single 50 nm diameter gold NP immersed in a material having the properties of the cytoplasm (ncyto = 1.36) and resolution dx = dy = dz =10nm. The calculated extinction cross-section has a maximum of 3.89 at around 543.0 nm corresponding to one of the radiation wavelengths of He-Ne lasers. The result for λ = 676.4nm (a Krypton laser wavelength) which corresponds to the non-resonant case (extinction cross-section value 0.322, ∼12 times smaller than 3.89). The FDTD results were validated by comparing them with the theoretical curve calculated by Mie theory.
The OPCM cell images are the result of simulations using non-uniform meshing where the number of mesh points in space is automatically calculated to ensure a higher number of mesh points in materials with higher values of the refractive index [49]. Figure 5 shows the schematic positioning of a cluster of 42 nanoparticles in the cytoplasm that was used in simulations. The cell center is located in the middle (x = y = z = 0) of the computational domain with dimensions 15 μm ×12 μm ×15 μm (Fig. 1b). The nucleus' center is located at x = −2μm, y = z = 0μm. The cluster of gold NPs is located at x = 2μm, y = z = 0μm. Figure 6 shows another simulation scenario where the cluster of 42 NPs is randomly distributed on the surface of the cell nucleus.
Figure 5.
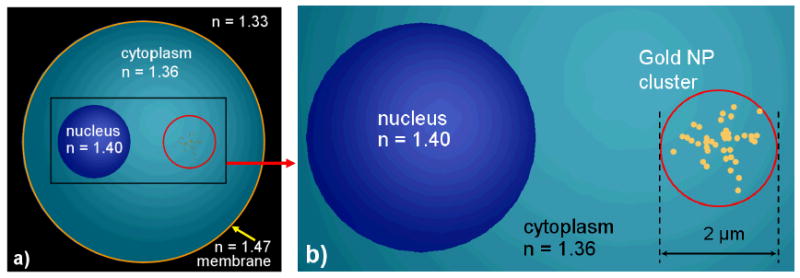
A cluster of 42 gold NPs in the cytoplasm: a) cell model; b) cluster model. The NP size on right hand graph is slightly exaggerated.
Figure 6.
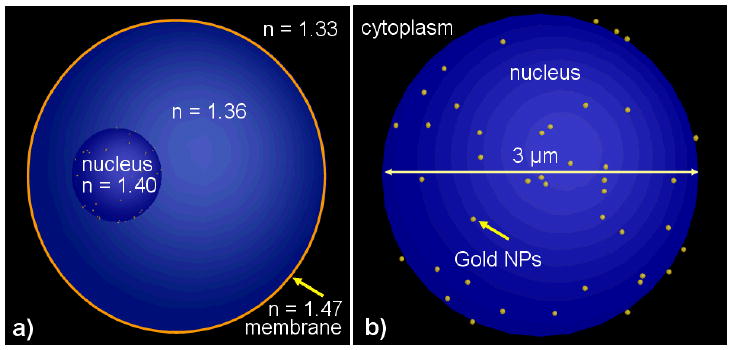
A group of 42 gold NPs randomly distributed on the surface of the cell nucleus: a) cell model; b) nucleus and cluster model. The NP size on right hand graph is slightly exaggerated.
The realistic cell dimensions (including both cell radius and membrane) require a very fine numerical resolution making the simulations computationally intensive. The numerical resolution of the nanoparticles was hard-coded to dx = dy = dz = 10nm making sure that their numerically manifested optical resonant properties will be the same as the ones that were discussed above. This lead to additional requirements for the CPU time and memory (∼120Gbs RAM) requiring high performance computing resources.
Based on the fact that RIM enhances significantly the imaging of the cell components, we have used the FDTD OPCM model to create the OPCM images of the cell at optical immersion conditions including the cluster of 42 gold NPs in the cytoplasm (Fig. 7) and for two different values of the phase offset Ψ between the reference beam and the scattered beam (assuminga = 1, see Eq. 14).
Figure 7.
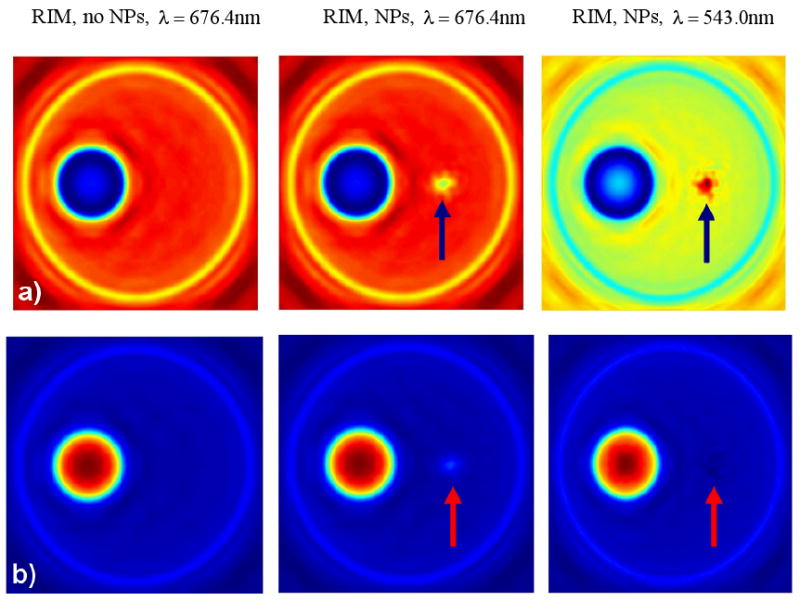
OPCM images of a single cell for different values (a: −90°, b: +90°) of the phase offset Ψ between the reference and diffracted beam of the OPCM at RIM (optical immersion) conditions including a cluster of 42 gold NPs located in a position symmetrically opposite to the nucleus. The arrows indicate the position of the cluster. The left column corresponds to a cell without NPs. The other columns correspond to a cell with NPs at resonant (right) and non-resonant (middle) conditions.
The enhanced imaging (a factor of 1.71) of the gold NP cluster at resonant conditions is clearly demonstrated for a phase offset Ψ = −90° between the reference beam and the scattered beam. However, it needs to be further studied as a function of Ψ. A calculation of the optical contrast due to the gold NP cluster as a function of the phase offsets between the reference (R) and the diffracted (D) beams of the optical phase microscope shows that the enhancement of the optical contrast due to the NP resonance changes significantly from a minimum of 0.0 (Ψ = 0°) to a maximum of 3.60 (Ψ = −150°) [19]. This finding should be taken into account in real life OPCM imaging flow cytometry experiments.
Figure 8 shows the OPCM images of a cell with a group of 42 gold NPs (see Fig. 6) located on the surface of the cell nucleus [22]. The images are for two different values of the phase offset Ψ (a: −90°, b: +90°) at optical immersion and both resonant and non-resonant conditions. It should be pointed out that the optical wave phenomena involved in the simulation scenario considered here are fundamentally different from the ones considered early in this paper where the gold NPs are randomly distributed within the homogeneous material of cytoplasm and their presence is manifested by means of their own absorption and scattering properties. In the present case the NPs are located at the interface of the nucleus and the cytoplasm which is characterized by a relatively large refractive index difference (Δn = 0.04) and which is, therefore, expected to largely dominate and modify the visual effect of the NPs. A close examination of the OPCM images in Fig. 8 provides an illustration of this fact.
Figure 8.
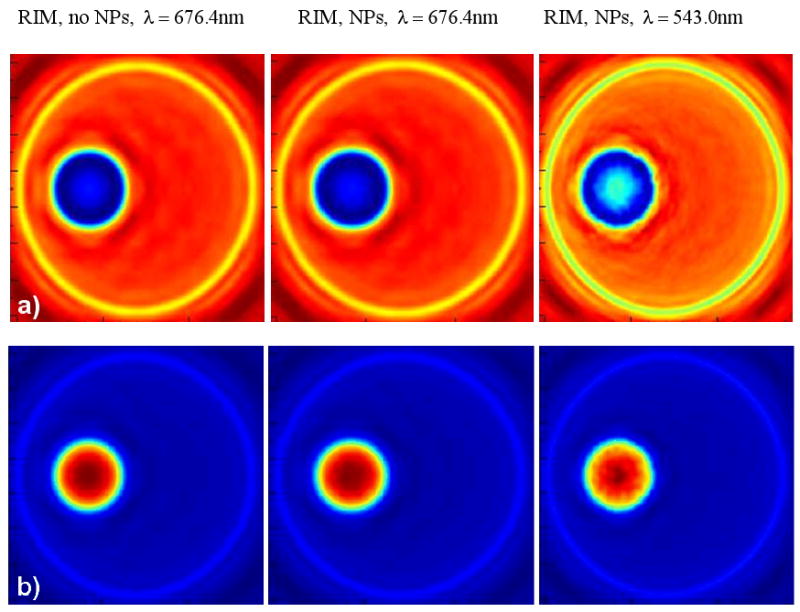
OPCM images of the cell for different values of the phase offset Ψ (a: −90°; b: +90°) between the reference and diffracted beam of the OPCM at optical immersion, i.e. refractive index matching, conditions without NPs (left) and including 42 gold NPs (middle – at no resonance, right – at resonance) randomly located at the surface of the cell nucleus.
The analysis of Figure 8 leads to a number of interesting findings. First, the images of the cell without the gold NPs are hardly distinguishable from the images including the gold NPs at no resonance conditions (λ = 676.4nm). Second, the visual effect of the gold NP presence at resonant conditions (λ = 543.0nm) depends significantly on the phase offset Ψ. Third, the presence of the gold NPs at resonant conditions can be identified by a specific fragmentation of the image of the nucleus for specific values of the offset Ψ. This last finding indicates the importance of the ability to adjust the offset Ψ between the reference and diffracted beam of the OPCM in practical circumstances. It is expected to be of relevance for the development and calibration of phase-sensitive slide and flow cytometers.
Conclusion
In this paper we provided a brief summary of different formulations of the FDTD method for application in cytometry related biophotonics problems. We have then applied the FDTD approach to three different modeling scenarios: i) light scattering from single cells, ii) OPCM imaging of realistic size cells, and iii) OPCM imaging of gold NPs in singe cells. We have demonstrated the FDTD ability to model OPCM microscopic imaging by, first, reproducing the effect of optical immersion on the OPCM images of a realistic size cell containing a cytoplasm, a nucleus and a membrane; second, including the presence of a cluster of gold NPs in the cytoplasm at optical immersion conditions as well as the enhanced imaging effect of the optical resonance of the nanoparticles, third, studying the imaging effect of gold NPs randomly distributed on the surface of the cell nucleus. The results do not allow analyzing the scaling of the NP imaging effect as a function of the number of the NPs. However, the validation of the model provides a basis for future research on cytometry related OPCM nanobioimaging including the effects of NP cluster size, NP size and number, as well as average distance between the NPs.
We believe that the shift from the modeling of the light scattering properties of single cells alone to the construction of images of cells containing gold NPs represents a major step forward in extending the application of the FDTD approach to in vivo flow cytometry. Further development may include detection of enhanced scattering effects from laser-induced microbubbles around endogenous absorbing cellular zones and NPs with different methods including thermolens schematics as was discussed in [45, 50-51] and demonstrated in vivo for non moving cells in [52].
Acknowledgments
ST and JP acknowledge the use of the computing resources of WestGrid (Western Canada Research Grid). VVT was supported by grants № 224014 PHOTONICS4LIFE-FP7-ICT-2007-2 (2008-2013), RF President's “Supporting of Leading Scientific Schools” - NSHA-208.2008.2 (2008-2009), and № № 2.1.1/4989, 2.2.1.1/2950 of PF Program on the Development of High School Potential (2009-2010). VPZ was supported by the National Institute of Health grants EB005123, EB000873, CA131164.
Contributor Information
Stoyan Tanev, Integrative Innovation Management Unit, Department of Industrial and Civil Engineering University of Southern Denmark, Niels Bohrs Alle 1, DK-5230 Odense M, Denmark.
Wenbo Sun, Science Systems and Applications, Inc., USA.
James Pond, Lumerical Solutions, Vancouver, BC, Canada.
Valery V. Tuchin, Institute of Optics and Biophotonics, Saratov State University, Saratov, 410012, Russia, Institute of Precise Mechanics and Control of RAS, Saratov 410028, Russia
Vladimir P. Zharov, Phillips Classic Laser and Nanomedicine Laboratories, Arkansas University of Medical Science, USA
References
- 1.Pawley JP. Handbook of Biological and Confocal Microscopy. 2nd. Plenum; New York: 1995. [Google Scholar]
- 2.Shapiro HM. Practical Flow Cytometry. 4th. Wiley-Liss; New York: 2003. [Google Scholar]
- 3.Sack Ulrich, Tárnok Attila, Rothe Gregor., editors. Zelluläre Diagnostik: Grundlagen, Methoden und Klinische Anwendungen der Durchflusszytometrie. Karger; 2006. [Google Scholar]
- 4.Prasad PN. Introduction to Biophotonics. Ch 7. John Wiley & Sons; New Jersey: 2003. Bioimaging: principles and techniques; pp. 203–249. [Google Scholar]
- 5.Tuchin VV. Tissue Optics: Light Scattering Methods and Instruments for Medical Diagnosis. second. PM 166. SPIE Press; Bellingham, WA: 2007. [Google Scholar]
- 6.Drexler W, Fujimoto JG, editors. Optical Coherence Tomography: Technology and Applications. Springer; Berlin: 2008. [Google Scholar]
- 7.Wilson T. Confocal microscopy. In: Vo-Dinh Tuan., editor. Biomedical Photonics Handbook. Ch 10. CRC Press; Boca Raton, Florida: 2003. p. 10.1. [Google Scholar]
- 8.Drezek R, Guillaud M, Collier T, Boiko I, Malpica A, Macaulay C, Follen M, Richards-Kortum R. Light scattering from cervical cells throughout neoplastic progression: influence of nuclear morphology, DNA content, and chromatin texture. J Biomed Opt. 2003;8:7–16. doi: 10.1117/1.1528950. [DOI] [PubMed] [Google Scholar]
- 9.Kahnert FM. Numerical methods in electromagnetic scattering theory. J Quant Spectr & Radiat Trans. 2003;73:775–824. [Google Scholar]
- 10.Dunn A, Richards-Kortum R. Three-dimensional computation of light scattering from cells. IEEE J Selec Top Quant Electr. 1996;2:898–894. [Google Scholar]
- 11.Dunn A. PhD Dissertation. Biomedical Engineering, University of Texas at Austin; Austin TX: 1997. Light Scattering Properties of Cells. http://www.nmr.mgh.harvard.edu/%7Eadunn/papers/dissertation/index.html. [Google Scholar]
- 12.Dunn A, Smithpeter C, Welch AJ, Richards-Kortum R. Finite-difference time-domain simulation of light scattering from single cells. J Biomed Opt. 1997;2:262–266. doi: 10.1117/12.275219. [DOI] [PubMed] [Google Scholar]
- 13.Drezek R, Dunn A, Richards-Kortum R. Light scattering from cells: finite-difference time-domain simulations and goniometric measurements. Appl Opt. 1999;38:3651–3661. doi: 10.1364/ao.38.003651. [DOI] [PubMed] [Google Scholar]
- 14.Drezek R, Dunn A, Richards-Kortum R. A pulsed finite-difference time-domain (FDTD) method for calculating light scattering from biological cells over broad wavelength ranges. Opt Exp. 2000;6:147–157. doi: 10.1364/oe.6.000147. [DOI] [PubMed] [Google Scholar]
- 15.Arifler D, Guillaud M, Carraro A, Malpica A, Follen M, Richards-Kortum R. Light scattering from normal and dysplastic cervical cells at different epithelial depths: finite-difference time domain modeling with a perfectly matched layer boundary condition. J Biomed Opt. 2003;8:484–494. doi: 10.1117/1.1578640. [DOI] [PubMed] [Google Scholar]
- 16.Tanev S, Sun W, Zhang R, Ridsdale A. The FDTD approach applied to light scattering from single biological cells. Proc SPIE. 2004;5474:162–168. [Google Scholar]
- 17.Tanev S, Sun W, Zhang R, Ridsdale A. Simulation tools solve light-scattering problems from biological cells. Laser Focus World. 2004 January;:67–70. [Google Scholar]
- 18.Tanev S, Sun W, Loeb N, Paddon P, Tuchin VV. The Finite-Difference Time-Domain Method in the biosciences: Modelling of light scattering by biological cells in absorptive and controlled extra-cellular media. In: Wilson BC, Tuchin VV, Tanev S, editors. Advances in Biophotonics. Vol. 369. IOS Press; Amsterdam: 2005. pp. 45–78. NATO Science Series I. [Google Scholar]
- 19.Tanev S, Pond J, Paddon P, Tuchin VV. A new 3D simulation method for the construction of optical phase contrast images of gold nanoparticle clusters in biological cells. Adv Opt Techn. 2008;2008 doi: 10.1155/2008/727418. Article ID 727418, 9 pages. http://www.hindawi.com/GetArticle.aspx?doi=10.1155/2008/727418. [DOI]
- 20.Tanev S, Tuchin V, Paddon P. Cell membrane and gold nanoparticles effects on optical immersion experiments with non-cancerous and cancerous cells: FDTD modeling. J Biomed Opt. 2006;11:064037-1–6. doi: 10.1117/1.2400239. [DOI] [PubMed] [Google Scholar]
- 21.Tanev S, Tuchin VV, Paddon P. Light scattering effects of gold nanoparticles in cells: FDTD modeling. Laser Phys Lett. 2006;3:594–598. [Google Scholar]
- 22.Tanev S, Tuchin VV, Pond J. Simulation and modeling of optical phase contrast microscope cellular nanobioimaging. Proc SPIE. 2008;7027 16-1-8. [Google Scholar]
- 23.Li X, Taflove A, Backman V. Recent progress in exact and reduced-order modeling of light-scattering properties of complex structures. IEEE J Selec Top Quant Electr. 2005;11:759–765. [Google Scholar]
- 24.Sun W, Loeb NG, Fu Q. Light scattering by coated sphere immersed in absorbing medium: a comparison between the FDTD and analytic solutions. J Quant Spectr & Radiat Trans. 2004;83:483–492. [Google Scholar]
- 25.Yee KS. Numerical solution of initial boundary value problems involving Maxwell's equation in isotropic media. IEEE Trans Anten Propag. 1966;AP-14:302–307. [Google Scholar]
- 26.Taflove A, Hagness SC, editors. Computational Electrodynamics: The Finite-Difference Time-Domain Method. 3rd. Artech House; Norwood, MA: 2005. [Google Scholar]
- 27.Sun W, Fu Q, Chen Z. Finite-difference time-domain solution of light scattering by dielectric particles with a perfectly matched layer absorbing boundary condition. Appl Opt. 1999;38:3141–3151. doi: 10.1364/ao.38.003141. [DOI] [PubMed] [Google Scholar]
- 28.Sun W, Fu Q. Finite-difference time-domain solution of light scattering by dielectric particles with large complex refractive indices. Appl Opt. 2000;39:5569–5578. doi: 10.1364/ao.39.005569. [DOI] [PubMed] [Google Scholar]
- 29.Sun W, Loeb NG, Fu Q. Finite-difference time-domain solution of light scattering and absorption by particles in an absorbing medium. Appl Opt. 2002;41:5728–5743. doi: 10.1364/ao.41.005728. [DOI] [PubMed] [Google Scholar]
- 30.Sacks ZS, Kingsland DM, Lee R, Lee JF. A perfectly matched anisotropic absorber for use as an absorbing boundary condition. IEEE Trans Anten Propag. 1995;43:1460–1463. [Google Scholar]
- 31.Gedney SD. An anisotropic perfectly matched layer absorbing media for the truncation of FDTD lattices. IEEE Trans Anten Propag. 1996;44:1630–1639. [Google Scholar]
- 32.Gedney SD, Taflove A. Perfectly matched absorbing boundary conditions. In: Taflove A, Hagness S, editors. Computational Electrodynamics: The Finite-Difference Time Domain Method. Artech House; Boston: 2000. pp. 285–348. [Google Scholar]
- 33.Yang P, Liou KN. Finite-difference time domain method for light scattering by small ice crystals in three-dimensional space. J Opt Soc Am A. 1996;13:2072–2085. [Google Scholar]
- 34.Bohren CF, Huffman DR. Absorption and Scattering of Light by Small Particles. John Wiley & Sons; New York: 1998. [Google Scholar]
- 35.Goedecke GH, O'Brien SG. Scattering by irregular inhomogeneous particles via the digitized Green's function algorithm. Appl Opt. 1988;27:2431–2438. doi: 10.1364/AO.27.002431. [DOI] [PubMed] [Google Scholar]
- 36.Fu Q, Sun W. Mie theory for light scattering by a spherical particle in an absorbing medium. Appl Opt. 2001;40:1354–1361. doi: 10.1364/ao.40.001354. [DOI] [PubMed] [Google Scholar]
- 37.Barer R, Ross KFA, Tkaczyk S. Refractometry of living cells. Nature. 1953;171:720–724. doi: 10.1038/171720a0. [DOI] [PubMed] [Google Scholar]
- 38.Fikhman BA. Microbiological Refractometry. Medicine; Moscow: 1967. [Google Scholar]
- 39.Tuchin VV. Optical Clearing of Tissues and Blood. PM 154. SPIE Press; Bellingham, WA: 2006. [Google Scholar]
- 40.Beck GC, Akgun N, Rück A, Steiner R. Developing optimized tissue phantom systems for optical biopsies. Proc SPIE. 1997;3197:76–85. [Google Scholar]
- 41.Beck GC, Akgun N, Rück A, Steiner R. Design and characterization of a tissue phantom system for optical diagnostics. Lasers Med Sci. 1998;13:160–171. [Google Scholar]
- 42.Sokolov K, Follen M, Aaron J, Pavlova I, Malpica A, Lotan R, Richards-Kortum R. Real time vital imaging of pre-cancer using anti-EGFR antibodies conjugated to gold nanoparticles. Cancer Res. 2003;63:1999–2004. http://cancerres.aacrjournals.org/cgi/content/full/63/9/1999#B9. [PubMed]
- 43.El-Sayed IH, Huang X, El-Sayed MA. Surface plasmon resonance scattering and absorption of anti-EGFR antibody conjugated gold nanoparticles in cancer diagnostics: applications in oral cancer. Nano Lett. 2005;5:829–834. doi: 10.1021/nl050074e. [DOI] [PubMed] [Google Scholar]
- 44.Khlebtsov NG, Melnikov AG, Dykman LA, Bogatyrev VA. Optical properties and biomedical applications of nanostructures based on gold and silver bioconjugates. In: Videen G, Yatskiv YaS, Mishchenko MI, editors. Photopolarimetry in Remote Sensing. Vol. 161. Kluwer; Dordrecht: 2004. pp. 265–308. NATO Science Series, II Mathematics, Physics, and Chemistry. [Google Scholar]
- 45.Zharov VP, Kim JW, Curiel DT, Everts M. Self-assembling nanoclusters in living systems: application for integrated photothermal nanodiagnostics and nanotherapy. Nanomed Nanotech, Biol, Med. 2005;1:326–345. doi: 10.1016/j.nano.2005.10.006. [DOI] [PubMed] [Google Scholar]
- 46.Zharov VP, Mercer KE, Galitovskaya EN, Smeltzer MS. Photothermal nanotherapeutics and nanodiagnostics for selective killing of bacteria targeted with gold nanoparticles. Biophys J. 2006;90:619–627. doi: 10.1529/biophysj.105.061895. [DOI] [PMC free article] [PubMed] [Google Scholar]
- 47.Tuchin Valery V, Drezek Rebekah, Nie Shuming, Zharov Vladimir P., editors. J Biomed Opt. 2. Vol. 14. 2009. Special section on Nanophotonics for Diagnostics, Protection and Treatment of Cancer and Inflammatory Diseases; pp. 020901pp. 021001–021017. Guest Editors. [Google Scholar]
- 48.Johnson PB, Christy RW. Optical constants of the noble metals. Phys Rev B. 1972;6:4370–4379. [Google Scholar]
- 49.Non-uniform meshing is a standard feature of the FDTD Solutions™ software.
- 50.Zharov VP, Galitovsky V, Chowdhury P. Nanocluster model of photothermal assay: Application for high-sensitive monitoring of nicotine –induced changes in metabolism, apoptosis and necrosis at a cellular level. J Biomed Opt. 2005;10:044011. doi: 10.1117/1.1990200. [DOI] [PubMed] [Google Scholar]
- 51.Zharov VP, Menyaev YA, Shashkov EV, Galanzha EI, Khlebtsov BN, Scheludko AV, Zimnyakov DA, Tuchin VV. Fluctuation of probe beam in thermolens schematics as potential indicator of cell metabolism, apoptosis, necrosis and laser impact. Proc SPIE. 2006;6085:608504-1–12. [Google Scholar]
- 52.Lee H, Alt C, Pitsillides CM, Lin CP. Optical detection of intracellular cavitation during selective laser targeting of the retinal pigment epithelium: dependence of cell death mechanism on pulse duration. J Biomed Opt. 2007;12:064034. doi: 10.1117/1.2804078. [DOI] [PubMed] [Google Scholar]