

Abstract
Poor reliability has been reported when counting the total number of follicles in polycystic ovaries using conventional two-dimensional (2-D) ultrasound viewing methods. In the current study, we report good reliability in follicle counts when observers imposed a programmable grid system over the viewing window. Four observers estimated total follicle counts in 45 ovarian ultrasound scans by compartmentalizing the ovary into 9 to 12 grid sections and performing focused follicle counts per section. The mean number of follicles counted per ovary was 44.6 ± 2.3. The level of inter-observer agreement when making follicle counts was 0.82 and total follicle counts did not differ among observers. The level of intra-observer agreement was 0.93 which further corroborated the utility of this method for making dependable follicle counts. In summary, the ability to obtain reproducible follicle counts will help to establish reliable diagnostic criteria for polycystic ovarian morphology.
Keywords: Ultrasonography, Polycystic ovaries, Follicle count, Inter-observer agreement, Intra-observer agreement, Reliability
INTRODUCTION AND LITERATURE
Polycystic ovary syndrome (PCOS) is a complex endocrine disorder which imposes serious risks for metabolic and malignant diseases in women of reproductive age (Rotterdam-Group 2004a, 2004b). Polycystic ovaries on ultrasonography are a consistent finding in women demonstrating clinical and biochemical evidence of PCOS (Rotterdam-Group 2004a, 2004b). However, their usefulness in diagnosing PCOS has been criticized since significant variability has been reported when identifying polycystic ovarian morphology (Amer et al. 2002). Polycystic ovaries are commonly enlarged and characterized by an increased number of small antral follicles (2 to 9 mm) distributed peripherally about a bright echogenic stroma (Adams et al. 1985; Fulghesu et al. 2001). Since follicle distribution pattern and stromal echogenicity are considered inherently more subjective in their assessment, efforts to develop objective criteria for polycystic ovarian morphology have centered on thresholds for follicle count and ovarian volume (Jonard et al. 2003, 2005). The current ultrasound criteria supported by an international coalition of experts define the polycystic ovary as having 12 or more follicles measuring 2 to 9 mm in diameter and/or an ovarian volume greater than 10 cm3 (Rotterdam-Group 2004a, 2004b). These criteria are presently being debated (Jonard et al. 2005; Allemand et al. 2006) and efforts to validate these cutoffs are necessary to corroborate the use of ultrasound in the diagnosis of PCOS.
Some of the variability in identifying polycystic ovarian morphology relates to difficulty in achieving a precise follicle count. We have previously reported poor levels of inter-observer agreement when counting the total number of follicles present in polycystic ovaries (Lujan et al. 2008, 2009) In fact, even after medical imaging specialists were given specific training on how to identify, count and measure ovarian follicles using conventional two-dimensional (2-D)-ultrasound viewing software, agreement among observers did not improve (Lujan et al. 2008). Others have showed relatively good agreement in follicle counts made for normal ovaries using real-time and off-line 2-D-ultrasonography (Scheffer et al. 2002; Jayaprakasan et al. 2007). However, better agreement would be expected for normal ovaries since they do not contain as many follicles, nor have follicles as closely packed as polycystic ovaries. These groups did notice a distinct decrease in inter-observer agreement when follicle counts were greater than 15 (Scheffer et al. 2002; Jayaprakasan et al. 2007), which supported the notion that the high density of follicles in polycystic ovaries is a major reason for the large variability in total follicle counts.
Based upon our previous experiences assessing ultrasonographic images of polycystic ovaries, we reasoned that the inability to make precise counts might reflect the limitations of traditional viewing software. In the current study, we proposed to determine whether dividing the polycystic ovary into separate segments with a programmable grid overlay would improve reliability in making off-line estimates of total follicle count. We hypothesized that if instead of scrolling through digitally stored ultrasound scans and attempting to count all follicles simultaneously, agreement in follicle counts would be improved if observers made focused follicle counts on a single section of ovary at a time. In this way, observers would be better able to distinguish between adjacent follicles and reduce the risk of overlooking smaller follicles that might not be counted when trying to analyze the entire cross-sectional view of ovary at once. Ultimately, reliable follicle counts made for each segment of the ovary would be expected to lead to more reliable estimates of total follicle counts.
MATERIALS AND METHODS
Study subjects
Seventeen women diagnosed with PCOS by the 2003 European Society for Human Reproduction and Embryology (ESHRE) and American Society for Reproductive Medicine (ASRM) guidelines of having two of three characteristics were enrolled in the study: (1) oligo-anovulation (menstrual cycles <21 or >38 days) (Fraser et al. 2007), (2) clinical and/or biochemical evidence of hyperandrogenism (modified Ferriman-Gallwey score ≥8 (Ferriman and Gallwey 1961) and/or a free androgen index ≥5 (Escobar-Morreale et al. 2001), (3) polycystic ovaries on ultrasound (≥12 follicles measuring 2 to 9 mm in diameter and/or ovarian volume >10 cm3 (Rotterdam-Group 2004a, 2004b). Other etiologies of anovulatory infertility such as hyperprolactinemia, hypercortisolemia, thyroid dysfunction and 21-hydroxylase deficiency were excluded. Subjects ranged in age from 18 to 35 and had not used hormonal contraception, fertility medications, or valproate in the 3 months prior to enrolment. The ability to visualize at least one ovary by transvaginal ultrasonography was required for inclusion.
Transvaginal ultrasonography
Subjects had a single transvaginal ultrasound scan performed at a random time (during their menstrual cycle) as part of the clinical evaluation for PCOS. Scans were performed by a single ultrasonographer using an UltraSonix RP ultrasound scanner equipped with a 9-MHz transvaginal probe (Ultrasonix, Vancouver, British Columbia, Canada). Ovaries were scanned from the inner to outer margins in both the transverse and sagittal planes. Scans were recorded digitally as cineloops (i.e., audio interleave file format) and transferred to a custom-designed database for off-line image analysis.
Selection and randomization of ultrasonographic records
Cineloops of 30 individual ovaries were selected for analysis from the 34 ovaries scanned. Of the 30 cineloops, 15 were randomly duplicated for an intra-observer analysis. In total, observers analyzed 45 ultrasound cases. Electronic links to each of these cases were randomly assigned for every observer such that no observer analyzed images in the same order. Four observers with training in ultrasonography assessed each of the ultrasound cases for the total number of follicles ≥2 mm in the entire ovary using Santesoft DICOM Editor medical imaging software. Cineloops could be viewed at any speed or direction including, frame-by-frame analysis.
Follicle count analysis with a grid-overlay
Observers were given instructions on how to impose a programmable grid overlay onto the viewing window using Santesoft DICOM Editor. Observers could adjust the size and number of sections per grid depending on their preference for compartmentalizing the ovary in question. In general, observers elected to compartmentalize the ovary into 9 to 12 sections. After imposing the grid (Fig. 1), observers selected a single section of the grid to focus on and then proceeded to scroll or play through the cineloop counting all the follicles contained within that single section. Observers made focused follicle counts for each section of the grid and then summed the counts from all sections to obtain a total follicle count.
Fig. 1.
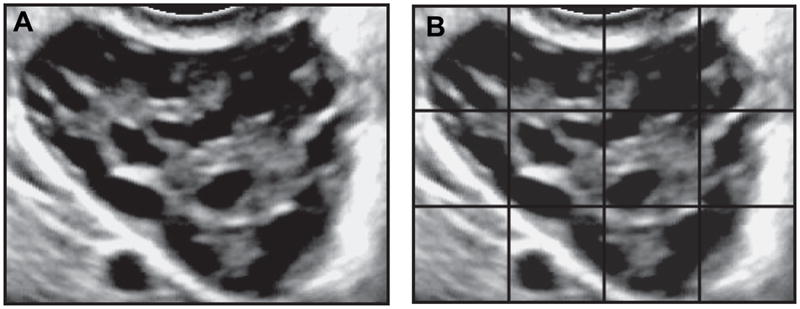
Cross-sectional view of a polycystic ovary with and without a grid overlay. A single frame of a digital recording of a transverse sweep through a polycystic ovary acquired by transvaginal ultrasonography is represented in panel A. Traditional viewing software (including, real-time ultrasound machines) are not equipped with grid options. As such, observers must estimate the number of follicles by scrolling through the image clip and counting all follicles in view simultaneously. Application of a grid (panel B) allowed observers to make focused follicle counts on a single section of the ovary at a time. Follicle counts obtained for each section were tallied to generate a total follicle count.
Ethical considerations
This study was approved by the University of Saskatchewan Biomedical Research Ethics Review Board. All study procedures conformed to the Canadian Tri-Council Guidelines for Human Research and International Good Clinical Practice Guidelines. Informed consent was obtained from all subjects. Ultrasound images used in this study were de-identified.
Statistical analysis
Descriptive statistics (mean ± SE) for clinical features of the study subjects were generated from clinical and laboratory medical records obtained at the time of evaluation for PCOS. Tukey’s multiple comparison tests were used to determine differences in follicle counts among observers. Linear regression analyses were performed to determine associations among follicle counts and clinical parameters. Lin’s concordance correlation coefficients (ρ) were used to assess the levels of intra-and inter-observer agreement (Lin 1989). Coefficients that approximated 1 denoted perfect agreement, while values that approximated 0 denoted agreement no better than that by chance alone. Guidelines for evaluating level of agreement were: >0.80 good, 0.60 to 0.80 moderate/fair and <0.60 poor.
RESULTS
Subject demographics
Clinical features of the study participants are summarized in Table 1. The average age of the participants was 27.9 ± 1.0 years and their mean body mass index (BMI) was 32.1 ± 2.1 kg/m2. As a group, subjects reported long intervals between menstrual periods, had hirsutism scores consistent with increased levels of terminal hair growth and had elevated levels of total testosterone and the free androgen index. All subjects demonstrated increased follicle counts consistent with polycystic ovarian morphology. By contrast, only 41% (7/17) of subjects had ovarian volumes >10 cm3.
Table 1.
Clinical features in women with polycystic ovary syndrome
| Mean ± SE | Normal range | |
|---|---|---|
| Menstrual cycle length (d) | 182 ± 28 | 21–38 |
| Modified hirsutism score | 11.5 ± 2.0 | <8 |
| Total testosterone (nmol/L) | 2.8 ± 0.3 | <2.5 |
| Free androgen index (%) | 9.4 ± 1.4 | <5 |
| Total follicle count | 44.6 ± 2.3 | <12 |
| Ovarian volume (cm3) | 10.4 ± 0.6 | <10 |
Total follicle counts
Mean (±SE) follicle counts reported by the four observers analyzing 45 ultrasound scans are compared in Table 2. Overall, the average number of follicles counted by the observers was 44.6 ± 2.3 and follicle counts did not differ among observers. Total follicle counts were positively associated with levels of total testosterone (R = 0.516, p = 0.040) and ovarian volume (R = 0.742, p < 0.001) but not menstrual cycle length (p = 0.389), hirsutism score (p = 0.143) or the free androgen index (p = 0.399).
Table 2.
Mean follicle counts made by four observers using a grid to assess ultrasonographic images of polycystic ovaries
Differences for within row comparisons are denoted by different letters (p < 0.05).
Intra-observer agreement
The level of intra-observer agreement when making follicle counts using a grid ranged from 0.83 to 0.98 (Table 3). Overall, the level of intra-observer agreement when making follicle counts in polycystic ovaries was 0.93.
Table 3.
Level of intra-observer agreement among four observers assessing total follicle counts in polycystic ovaries using a grid
| Observer | Concordance correlation coefficient for follicle count |
|---|---|
| 1 | 0.95 |
| 2 | 0.83 |
| 3 | 0.98 |
| 4 | 0.98 |
| Average | 0.93 |
Inter-observer agreement
Previously reported scatterplots of pair-wise agreement for total follicle counts made in polycystic ovaries using a conventional image viewer are compared to our current measurements made using a grid in Figure 2. Perfect agreement between two observers corresponds to a slope of 1 (diagonal line). Medical imaging specialists showed poor agreement when making follicle counts using a conventional image viewer as appreciated by the relatively high degree of scatter of points along the diagonal line (Fig. 2A; ρ = 0.55). Following focused training in the ultrasonographic interpretation of polycystic ovaries, agreement in total follicle counts was not improved (Fig. 2B; ρ = 0.54). By contrast, agreement was substantially better when observers used a grid to make follicle counts (Fig. 2C; ρ = 0.82).
Fig. 2.

Scatterplots of inter-observer agreement when making total follicle counts in polycystic ovaries using conventional viewing methods or a grid analysis. Inter-observer agreement in follicle counts was poor before (A) and after (B) participation in a workshop focused on assessing ultrasonographic images of polycystic ovaries using conventional viewing software. Use of a grid system was associated with better levels of inter-observer agreement (C). Perfect agreement between observers corresponds to a slope of 1 (diagonal line). Data for panels A and B were adapted with permission from Lujan et al. Reprod Biol Endocrinol 2008;18:30.
The corresponding levels of inter-observer agreement for the observers using a grid to estimate follicle counts are summarized in Table 4. Inter-observer agreement ranged from 0.78 to 0.87 and the overall level of inter-observer agreement when making follicle counts using a grid was 0.82. This level of overall agreement represented a 50% improvement in reliability compared to coefficients previously obtained with conventional image viewing.
Table 4.
Level of inter-observer agreement among four observers assessing total follicle counts in polycystic ovaries using a grid
| Observer pair | Concordance correlation coefficient for follicle count |
|---|---|
| 1,2 | 0.87 |
| 1,3 | 0.79 |
| 1,4 | 0.86 |
| 2,3 | 0.81 |
| 2,4 | 0.78 |
| 3,4 | 0.81 |
| Average | 0.82 |
DISCUSSION AND SUMMARY
The objective of the current study was to determine if use of a software-based grid system would improve reliability when making total follicle counts in polycystic ovaries. We had predicted that by compartmentalizing the ovary and performing focused follicle counts on individual segments of the ovary, observers would generate reliable estimations of total follicle counts. Our study showed that agreement between multiple observers was exceptional when a grid was used. Moreover, very little to no variation was noted when a single observer assessed the same images, further corroborating the utility of this method for making ultrasonographic measurements in polycystic ovaries.
We had previously reported in two separate studies that medical imaging specialists showed poor agreement when assessing ultrasonographic features of polycystic ovaries (Lujan et al. 2008; 2009). In the case of total follicle counts, observers using conventional viewing software showed levels of inter-observer agreement that ranged from only 0.08 to 0.63. Agreement in total follicle counts could not be improved following participation in an ultrasound training workshop nor following the synthesis of consensus criteria for assessing ultrasonographic images of polycystic ovaries (Lujan et al. 2008). In our previous studies, follicle counts made in women diagnosed with PCOS by the ESHRE/ASRM criteria approximated 35 to 40 follicles and significant differences were noted in follicle counts made by multiple observers. In the current study, mean follicle counts were comparable to those obtained in our previous studies; however, we noted no differences in counts between observers when a programmable grid was applied onto the viewing window. Both intra- and inter-observer reliability analyses yielded coefficients well over 0.80 which is clinically significant since this threshold is considered to represent good diagnostic accuracy (Widmalm et al. 2006).
That we were able to produce reliable follicle counts in the range of 35 to 40 suggests that a grid analysis is a suitable tool for investigating the clinical significance of polycystic ovarian morphology. At present, there is significant controversy over the use of ultrasonographic evidence of polycystic ovaries as a diagnostic criterion for PCOS. Some of this controversy relates to the appropriateness of the ESHRE/ASRM recognized ultrasound guidelines, which are based on a single report that the appearance of 12 or more follicles had 99% specificity and 75% sensitivity for distinguishing between normal and polycystic ovaries (Jonard et al. 2003). More recently, a cut-off of 20 follicles or more was reported to be more specific at minimizing false-positive diagnoses of poly-cystic ovaries (Allemand et al. 2006). Despite having been determined by three-dimensional (3-D)-ultrasonography, a 20 follicle cut-off for polycystic ovarian morphology is more in line with what we have encountered in this study since all observers counted a minimum of 20 follicles for each ovary using the grid system. Nevertheless, it is important to view findings relating to the diagnostic cut-offs for polycystic ovarian morphology with caution. The receiver operating curve (ROC) analyses on which these thresholds are based are strictly dependent on having generated reliable total follicle counts for both the disease and normal cohorts. Because previous studies have noted a distinct decrease in inter-observer agreement when follicle counts were greater than 15 (Scheffer et al. 2002; Jayaprakasan et al. 2007), measures of within and between observer variability should be reported in studies reporting follicle counts. These coefficients attest to the reliability of the technique used to make follicle counts and the interpretative ability of the medical imaging specialist. A future assessment of ovarian morphology using the grid system in both women with and without PCOS is needed to validate a higher follicle count threshold for polycystic ovaries. Moreover, future studies must also address the grid system’s utility in diagnosing polycystic ovaries compared to conventional image viewing.
The ability to achieve reliable follicle counts on ultrasonography has far reaching implications for the diagnosis, management and study of PCOS. Reliable identification of polycystic ovarian morphology facilitates early diagnosis and intervention of PCOS and aids in predicting success of ovarian stimulation or susceptibility to ovarian hyperstimulation syndrome (Hendriks et al. 2005; Tummon et al. 2005). More recently, follicle counts have been reported to reflect the degree of reproductive and metabolic disturbance in PCOS (Diamanti-Kandarakis and Panidis 2007; Sikka et al. 2007). This suggests that ovarian morphology may help to identify persons at risk for developing PCOS or judge the progression of the syndrome in patients. Consistent with this notion, studies involving treatment of PCOS patients with insulin sensitizers have indicated that improvements in ovarian morphology have occurred in concert with improvements in reproductive and metabolic parameters (Falbo et al. 2009; Romualdi et al. 2009). In this study, reliable follicle counts in a small cohort of subjects were positively associated with serum testosterone levels and ovarian volume which support the notion that follicle counts reflect degree of symptomology in PCOS. However, a larger pool of subjects and stratification of subjects by distinct clinical phenotypes are certainly needed to better delineate the relevance of total follicle counts in manifestations of PCOS.
While the grid analysis we describe here yields highly consistent results, this approach is laborious and difficult to apply in a clinical setting. Use of a grid system substantially increases the amount of time needed to make follicle counts. The duration of the analysis can be best described as being proportional to the number of quadrants used and the speed at which the cineloop is viewed, each of which is a variable that can be controlled by the evaluator. In this study, evaluators would compartmentalize the ovary in 9 to 12 sections, which would mean that they were viewing the files at least nine times. Since a cineloop through the ovary is generally viewed in about 10 to 12 s and several seconds are needed to apply the grid, adjust settings, record follicle counts per quadrant and sum total follicle counts, determining follicle counts using the grid system took about 3 min per case. This is in contrast to general practice in which images may be viewed off-line once or twice to generate a gross evaluation of increased follicle count (i.e., counting 12 follicles or more). Validating the clinical relevance of total follicle counts to risk, severity and/or progression of PCOS may motivate a transition to making an assessment of follicle counts part of evaluation for PCOS. But to date, this method is best suited for investigational purposes.
With the advent of 3-D imaging and automated follicle counting software it is important to question the relevance of the grid system. To the best of our knowledge, there is no published report of a reliable method of automatically counting follicles throughout the entire polycystic ovary. We are aware of only two reports, including one of ours, in which reliable automated follicle counts were obtained in a single cross-section of a poly-cystic ovary (Lawrence et al. 2007; Deng et al. 2008). However, since the Rotterdam consensus supports counts be made throughout the entire ovary, efforts to generate reliable automated follicle counts in the entire polycystic ovary are needed. Others have confirmed that automated follicle counts can be achieved in the order of 10 to 26 follicles in unstimulated ovaries but only when significant manual postprocessing is applied (Deb et al. 2009). Our attempts to use this automated follicle counting software in women with clinically diagnosed PCOS have not been successful (unpublished observation). Follicles are much more abundant in polycystic ovaries and the software does not have adequate sensitivity to discriminate between crowded follicles. In our experience, the time needed to perform the manual postprocessing in polycystic ovaries is much more substantial than that needed to use the grid system on a 2-D cineloop. For this reason we continue to rely on 2-D viewing software that is equipped with a grid option. We certainly believe there are advantages to using 3-D viewing software, in that it allows for the simultaneous viewing of the three sectional planes. However, making follicle counts remains challenging when the ovary is not compartmentalized into manageable sections. Development of a software plug-in which enables a grid to be applied to a 3-D viewing platform may be valuable in this regard.
In summary, reliable follicle counts in polycystic ovaries can be obtained by applying a grid system onto the viewing window. Confirmation of a reliable method for counting follicles in polycystic ovaries has important implications for alleviating current controversies over the relevance of polycystic ovarian morphology in the clinical evaluation of PCOS. This approach promises to serve as a useful tool for reproductive biologists assessing ovarian follicle development in PCOS, engineers generating automated task functions for counting follicles on ultrasonography and clinicians working to gauge the severity, progression and response to treatment in patients with PCOS.
Acknowledgments
This work was supported by a scholarship from the Strategic Training Initiative in Research in Reproductive Health Sciences (STIRRHS), a Saskatchewan Health Research Foundation Fellowship (SHRF) Award and a Canadian Institutes of Health Research (CIHR) Fellowship Award (Regional Partnership Program).
References
- Adams J, Franks S, Polson DW, Mason HD, Abdulwahid N, Tucker M, Morris DV, Price J, Jacobs HS. Multifollicular ovaries: Clinical and endocrine features and response to pulsatile gonadotropin releasing hormone. Lancet. 1985;2:1375–1379. doi: 10.1016/s0140-6736(85)92552-8. [DOI] [PubMed] [Google Scholar]
- Allemand MC, Tummon IS, Phy JL, Foong SC, Dumesic DA, Session DR. Diagnosis of polycystic ovaries by three-dimensional transvaginal ultrasound. Fertil Steril. 2006;85:214–219. doi: 10.1016/j.fertnstert.2005.07.1279. [DOI] [PubMed] [Google Scholar]
- Amer SA, Li TC, Bygrave C, Sprigg A, Saravelos H, Cooke ID. An evaluation of the inter-observer and intra-observer variability of the ultrasound diagnosis of polycystic ovaries. Hum Reprod. 2002;17:1616–1622. doi: 10.1093/humrep/17.6.1616. [DOI] [PubMed] [Google Scholar]
- Deb S, Jayaprakasan K, Campbell BK, Clewes JS, Johnson IR, Raine-Fenning NJ. Intra-observer and inter-observer reliability of automated antral follicle counts made using three-dimensional ultrasound and SonoAVC. Ultrasound Obstet Gynecol. 2009;33:477–483. doi: 10.1002/uog.6310. [DOI] [PubMed] [Google Scholar]
- Deng Y, Wang Y, Chen P. Automated detection of Polycystic Ovary Syndrome from ultrasound images. Conf Proc IEEE Eng Med Biol Soc. 2008;2008:4772–4775. doi: 10.1109/IEMBS.2008.4650280. [DOI] [PubMed] [Google Scholar]
- Diamanti-Kandarakis E, Panidis D. Unravelling the phenotypic map of polycystic ovary syndrome (PCOS): A prospective study of 634 women with PCOS. Clin Endocrinol (Oxf) 2007;67:735–742. doi: 10.1111/j.1365-2265.2007.02954.x. [DOI] [PubMed] [Google Scholar]
- Escobar-Morreale HF, Asuncion M, Calvo RM, Sancho J, San Millan JL. Receiver operating characteristic analysis of the performance of basal serum hormone profiles for the diagnosis of polycystic ovary syndrome in epidemiological studies. Eur J Endocrinol. 2001;145:619–624. doi: 10.1530/eje.0.1450619. [DOI] [PubMed] [Google Scholar]
- Falbo A, Orio F, Venturella R, Rania E, Materazzo C, Tolino A, Zullo F, Palomba S. Does metformin affect ovarian morphology in patients with polycystic ovary syndrome? A retrospective cross-sectional preliminary analysis. J Ovarian Res. 2009;2:5. doi: 10.1186/1757-2215-2-5. [DOI] [PMC free article] [PubMed] [Google Scholar]
- Ferriman D, Gallwey JD. Clinical assessment of body hair growth in women. J Clin Endocrinol Metab. 1961;21:1440–1447. doi: 10.1210/jcem-21-11-1440. [DOI] [PubMed] [Google Scholar]
- Fraser IS, Critchley HO, Munro MG, Broder M. Can we achieve international agreement on terminologies and definitions used to describe abnormalities of menstrual bleeding? Hum Reprod. 2007;22:635–643. doi: 10.1093/humrep/del478. [DOI] [PubMed] [Google Scholar]
- Fulghesu AM, Ciampelli M, Belosi C, Apa R, Pavone V, Lanzone A. A new ultrasound criterion for the diagnosis of polycystic ovary syndrome: The ovarian stroma/total area ratio. Fertil Steril. 2001;76:326–331. doi: 10.1016/s0015-0282(01)01919-7. [DOI] [PubMed] [Google Scholar]
- Hendriks DJ, Mol BW, Bancsi LF, Te Velde ER, Broekmans FJ. Antral follicle count in the prediction of poor ovarian response and pregnancy after in vitro fertilization: A meta-analysis and comparison with basal follicle-stimulating hormone level. Fertil Steril. 2005;83:291–301. doi: 10.1016/j.fertnstert.2004.10.011. [DOI] [PubMed] [Google Scholar]
- Jayaprakasan K, Walker KF, Clewes JS, Johnson IR, Raine-Fenning NJ. The interobserver reliability of off-line antral follicle counts made from stored three-dimensional ultrasound data: A comparative study of different measurement techniques. Ultrasound Obstet Gynecol. 2007;29:335–341. doi: 10.1002/uog.3913. [DOI] [PubMed] [Google Scholar]
- Jonard S, Robert Y, Cortet-Rudelli C, Pigny P, Decanter C, Dewailly D. Ultrasound examination of polycystic ovaries: Is it worth counting the follicles? Hum Reprod. 2003;18:598–603. doi: 10.1093/humrep/deg115. [DOI] [PubMed] [Google Scholar]
- Jonard S, Robert Y, Dewailly D. Revisiting the ovarian volume as a diagnostic criterion for polycystic ovaries. Hum Reprod. 2005;20:2893–2898. doi: 10.1093/humrep/dei159. [DOI] [PubMed] [Google Scholar]
- Lawrence MJ, Eramian MG, Pierson RA, Neufeld E. Computer assisted detection of polycystic ovary morphology in ultrasound images. Conf Proc IEEE Fourth Canadian Conference on Computer and Robot Vision; 2007; 2007. pp. 105–112. [Google Scholar]
- Lin LI. A concordance correlation coefficient to evaluate reproducibility. Biometrics. 1989;45:255–268. [PubMed] [Google Scholar]
- Lujan ME, Chizen DR, Peppin AK, Dhir A, Pierson RA. Assessment of ultrasonographic features of polycystic ovaries is associated with modest levels of interobserver agreement. J Ov Res. 2009;2:6. doi: 10.1186/1757-2215-2-6. [DOI] [PMC free article] [PubMed] [Google Scholar]
- Lujan ME, Chizen DR, Peppin AK, Kriegler S, Leswick DA, Bloski TG, Pierson RA. Improving inter-observer variability in the evaluation of ultrasonographic features of polycystic ovaries. Reprod Biol Endocrinol. 2008;6:30. doi: 10.1186/1477-7827-6-30. [DOI] [PMC free article] [PubMed] [Google Scholar]
- Romualdi D, Giuliani M, Cristello F, Fulghesu AM, Selvaggi L, Lanzone A, Guido M. Metformin effects on ovarian ultrasound appearance and steroidogenic function in normal-weight normoinsulinemic women with polycystic ovary syndrome: A randomized double-blind placebo-controlled clinical trial. Fertil Steril. 2009 doi: 10.1016/j.fertnstert.2009.01.114. in press. [DOI] [PubMed] [Google Scholar]
- Rotterdam-Group. Revised 2003 consensus on diagnostic criteria and long-term health risks related to polycystic ovary syndrome. Fertil Steril. 2004a;81:19–25. doi: 10.1016/j.fertnstert.2003.10.004. [DOI] [PubMed] [Google Scholar]
- Rotterdam-Group. Revised 2003 consensus on diagnostic criteria and long-term health risks related to polycystic ovary syndrome (PCOS) Hum Reprod. 2004b;19:41–47. doi: 10.1093/humrep/deh098. [DOI] [PubMed] [Google Scholar]
- Scheffer GJ, Broekmans FJ, Bancsi LF, Habbema JD, Looman CW, Te Velde ER. Quantitative transvaginal two- and three-dimensional sonography of the ovaries: Reproducibility of antral follicle counts. Ultrasound Obstet Gynecol. 2002;20:270–275. doi: 10.1046/j.1469-0705.2002.00787.x. [DOI] [PubMed] [Google Scholar]
- Sikka P, Gainder S, Dhaliwal LK, Bagga R, Sialy R, Sahdev S. Ultrasonography of the ovaries and its correlation with clinical and endocrine parameters in infertile women with PCOS. Int J Fertil Womens Med. 2007;52:41–47. [PubMed] [Google Scholar]
- Tummon I, Gavrilova-Jordan L, Allemand MC, Session D. Polycystic ovaries and ovarian hyperstimulation syndrome: A systematic review. Acta Obstet Gynecol Scand. 2005;84:611–616. doi: 10.1111/j.0001-6349.2005.00788.x. [DOI] [PubMed] [Google Scholar]
- Widmalm SE, Brooks SL, Sano T, Upton LG, McKay DC. Limitation of the diagnostic value of MR images for diagnosing temporomandibular joint disorders. Dentomaxillofac Radiol. 2006;35:334–338. doi: 10.1259/dmfr/23427399. [DOI] [PubMed] [Google Scholar]