

Abstract
Purpose
To investigate the expression of harmonin in the mouse retina, test for ultrastructural and physiological mutant phenotypes in the retina of an Ush1c mutant mouse, and define in detail the retinal phenotype in human USH1C.
Methods
Antibodies were generated against harmonin. Harmonin isoform distribution was examined by Western blot analysis and immunocytochemistry. Retinas of deaf circler (dfcr) mice, which possess mutant Ush1c, were analyzed by microscopy and electroretinography (ERG). Two siblings with homozygous 238_239insC (R80fs) USH1C mutations were studied with ERG, perimetry, and optical coherence tomography (OCT).
Results
Harmonin isoforms a and c, but not b are expressed in the retina. Harmonin is concentrated in the photoreceptor synapse where the majority is postsynaptic. Dfcr mice do not undergo retinal degeneration and have normal synaptic ultrastructure and ERGs. USH1C patients had abnormal rod and cone ERGs. Rod- and cone-mediated sensitivities and retinal laminar architecture were normal across 50°–60° of visual field. A transition zone to severely abnormal function and structure was present at greater eccentricities.
Conclusions
The largest harmonin isoforms are not expressed in the retina. A major retinal concentration of harmonin is in the photoreceptor synapses, both pre- and post-synaptically. The dfcr mouse retina is unaffected by its mutant Ush1c. Patients with USH1C retained regions of normal central retina surrounded by degeneration. Perhaps the human disease is simply more aggressive than that in the mouse. Alternatively, the dfcr mouse may be a model for nonsyndromic deafness, due to the nonpathologic effect of its mutation on the retinal isoforms.
Usher syndrome is an inherited deafness–blindness disorder, characterized by both cochlear dysfunction and progressive retinal degeneration (retinitis pigmentosa). It has been divided into three general clinical subtypes, Usher-1, -2, and -3, but it can be caused by mutations in any one of 11 different genes. Usher syndrome type 1C is caused by mutations in the gene, USH1C, which encodes for a PDZ-domain protein, referred to as harmonin.1 Harmonin was originally identified as an antigen of autoantibodies generated by patients with colon cancer2 and is present in a wide range of tissues.3
Harmonin is expressed in alternatively spliced isoforms that make up three different-sized subclasses.1 Because of its PDZ-domains, harmonin has been proposed to function as a scaffolding protein.1 In support, in vitro binding studies have shown that all the other known Usher-1 proteins, myosin VIIa, cadherin23, protocadherin15, and SANS, bind to PDZ domains of harmonin,4–6 as do two of the Usher 2 proteins, usherin, and VLGR1.7 As a consequence, it has been proposed that all the Usher-1 and -2 proteins function in a large interactive complex with harmonin as its core.7–10 This unifying hypothesis is attractive in that it may simplify a syndrome that can be caused by the loss-of-function of any one of a group of proteins with otherwise very different apparent functions. However, our understanding of the in situ function of most of the Usher proteins is insufficient to test this hypothesis adequately. This lack of understanding is especially true with respect to harmonin in the retina.
In the present study, we focused on increasing our understanding of harmonin in the retina. We have re-evaluated its expression in the retina, studied the retina of an Ush1c mutant mouse, and performed structural and functional analyses of the retinas in a sibship with USH1C mutations.
Materials and Methods
Animals
Mice were housed in vivaria on a 12-hour light/12-hour dark cycle under 10- to 50-lux fluorescent light during the light cycle. All procedures conformed to institutional animal care and use authorizations and were in accordance with regulations established by the National Institutes of Health and the ARVO Statement for the Use of Animals in Ophthalmic and Vision Research.
Deaf circler (dfcr) mice, on a BALB/cByJ genetic background, were obtained from The Jackson Laboratory (Bar Harbor, ME). They were backcrossed onto a C57BL/6 background for two to four generations. To distinguish WT, dfcr heterozygotes, and dfcr homozygotes from one another, a PCR-based approach was used (cf. Ref. 11). Dfcr homozygotes were also evident by their characteristic circling and head-tossing behavior.
Antibodies
Harmonin H1 anti-sera were generated in rabbits against a His tag fusion of a protein containing the amino acid sequence 1 to 200 of mouse harmonin that includes the first PDZ domain of the protein. These antibodies were purified by affinity chromatography against the bacterially expressed antigen coupled to an NHS-Sepharose column (Amersham, Arlington Heights, IL). Harmonin H3 anti-sera were generated in rabbits against a GST fusion with a harmonin-a1 fragment, containing the third PDZ domain (amino acids, 367–541). They were affinity purified against a fusion of maltose binding protein and full-length harmonin-a1 (amino acids 1–548), and provided to us as a gift by Ulrich Müller (The Scripps Institute, La Jolla, CA). Polyclonal anti-sera against myosin VIIa were made as described,12 and purified by series depletion against retinal proteins from MYO7A-null mice. Monoclonal antibodies against synaptophysin, SVP38, and acetylated α-tubulin were purchased from Sigma-Aldrich (St. Louis, MO), and a monoclonal antibody against SV213 was a gift from Kathleen Buckley (Harvard Medical School, Boston, MA).
Western Blot Analysis
Western blot analysis was performed on eyecups and on rod outer segment (ROS) and synaptosome fractions. As controls, HEK293 cells and HEK293 cells transfected with GFP-harmonin-b (gift from Ulrich Müller) were used. Samples were lysed in buffer A, containing 250 mM sucrose, 1 mM EDTA, 20 mM HEPES (pH 7.4), protease inhibitors, and 1 mM DTT. Samples were boiled for 5 minutes in SDS loading buffer with 20% SDS. ROSs were isolated by collection of the supernatant after repetitive vortexing and sedimentation and then purified further by centrifugation in a step gradient (OptiPrep; Sigma-Aldrich), and collection from the 10 and 18% interface. Synaptosomes were purified from mouse retinas that were homogenized in 0.32 M sucrose, and centrifuged at 750g for 10 minutes at 4°C. The pellet was discarded, and the supernatant (S1) was centrifuged at 100,000g for 1 hour. This second pellet (P2) was loaded on a 1.2 M sucrose cushion and centrifuged at 200,000g for 3 minutes. Synaptosomes were collected from the surface of the cushion. The fraction was diluted in buffer A without sucrose and centrifuged, and the synaptosome pellet was resuspended in buffer.
For Western blot analysis, samples were subjected to SDS-PAGE, using a 4% to 12% gradient gel, and transferred to PVDF membranes (Millipore, Bedford, MA). The membranes were blocked with 5% BSA in PBS/0.05% Tween-20 for 1 hour. Proteins were detected with the H1 harmonin antibodies. Primary antibodies were incubated in blocking solution for 1 hour at RT. After they were washed, the membranes were probed with the respective secondary antibodies and the signal was detected by chemiluminescence (SuperSignal West Dura Extended–Duration Substrate ECL kit; Thermo Scientific, Waltham, MA).
Microscopy
Retinas were fixed either by perfusion of the whole animal or by immersion of the eyecup with 2% glutaraldehyde+2% paraformaldehyde in 0.1 M cacodylate buffer (pH 7.4). For the analyses of the dfcr synapses, 0.1% tannic acid was also included in the primary fixative. After osmication, dehydration, and embedment in Epon 812, semithin sections (0.7 μm, stained with toluidine blue) and ultrathin sections were analyzed by light and electron microscopy, respectively. For immunofluorescence microscopy, the eyecups were fixed in 4% paraformaldehyde in PBS, cryoprotected in phosphate-buffered saline (PBS) with 30% sucrose overnight at 4°C, and embedded in OCT compound (Ted Pella, Irvine, CA). Thick (8 μm) cryosections were collected on polylysine-coated glass slides. Autofluorescence was quenched with 0.1% sodium borohydride in PBS. Sections were incubated with primary antibody overnight at 4°C in blocking solution (2% goat serum, 0.1% Triton X-100 in PBS), and then secondary antibodies conjugated to Alexa 594 nm or 488 nm (Molecular Probes, Eugene, OR) for 1 hour at room temperature in the dark. Sections were mounted (Mowiol; Calbiochem, San Diego, CA), and analyzed by scanning laser confocal microscopy. For immunoelectron microscopy, the eyecups were fixed by immersion in 0.1% glutaraldehyde+2% paraformaldehyde in 0.1 M cacodylate buffer (pH 7.4), and processed for embedment in resin (LR White; EMS, Fort Washington, PA). Ultrathin sections were etched with saturated sodium periodate, blocked with 4% bovine serum albumin (BSA) in Tris-buffered saline (TBS) for 1 hour, incubated with purified harmonin antibody in TBS+1% BSA+1% Tween 20 overnight at 4°C, washed, incubated with goat anti-rabbit IgG conjugated to 10 nm gold (Amersham) in TBS+1% BSA+1% Tween 20 for 1 hour, postfixed with 2% glutaraldehyde for 20 minutes, washed, and stained with 2% ethanolic uranyl acetate for 15 minutes and lead citrate for 10 minutes. Negative control sections were processed at the same time. They included sections that were not incubated with the primary antibody or incubated with the primary antibody together with the fusion protein that was used as an immunogen.
Quantitative Analysis of Microscopy
Immunogold labeling of the different cells at rod photoreceptor synapses was quantified after labeling with the H1 antibody. Images of rod spherules, in which we could clearly identify processes from two horizontal cells and a bipolar cell, were collected and used for the quantification. Dorsoventral semithin sections of retinas from 12-month-old dfcr and WT littermates that had been maintained together in the same cages were imaged by light microscopy. The thickness of the photoreceptor nuclear layer was determined, in terms of number of nuclei, at 0.5-mm intervals from the optic nerve head.
Ultrastructural analyses of the rod spherules were conducted on one retina from each of four wild-type and four dfcr mice. We used only dorsoventral sections in which the photoreceptor inner and outer segments were well-aligned in longitudinal sections, as determined by light microscopy of semithin sections, taken before the ultrathin sections for electron microscopy. Both central and peripheral regions of the retina were used. For each retina, the first 15 spherules identified from each region were used for quantification. A spherule was identified, based on the presence of a ribbon, synaptic vesicles, and a mitochondrion, and provided it was clearly not part of a cone pedicle. Each rod spherule was scored according to whether it contained a bipolar cell process, horizontal cell processes, and an arciform density. The density of ribbon-associated vesicles was assessed by counting the number of vesicles within 40 nm of the ribbon.14
Two-sample, two-tailed, Student's t-tests were used to test the probability of no significant difference between mutant and control samples.
Electroretinography
Full field bilateral electroretinograms (ERGs) were recorded with a custom-built Ganzfeld stimulus, a computer-based system (EPIC-XL; LKC Technologies, Gaithersburg, MD) and specially made contact lens electrodes (Hansen Ophthalmics, Iowa City, IA), according to published methodology.15 Briefly, animals (dfcr, n = 5; wild type, n = 20; ages 1–4 months old), were dark adapted (>12 hours) and anesthetized with a mixture of ketamine HCl (65 mg/kg) and xylazine (5 mg/kg) intramuscularly under dim red light. The corneas were anesthetized with proparacaine HCl (0.5%), and pupils were dilated with tropicamide (1%) and phenylephrine (2.5%). Medium energy (10-μs duration) and high energy (1 zms duration) flash stimulators with unattenuated luminances of 0.8 and 3.6 log scot-cd · s · m−2, respectively, were used. Neutral density (Wratten 96; Eastman Kodak Company, Rochester, NY) and blue (Wratten 47A; Eastman Kodak Company) filters served to attenuate and spectrally shape the stimuli. First, dark-adapted ERGs were obtained with increasing intensities of blue light flashes from −4.2 to 0.1 log scot-cd · s · m−2. Next, an ERG photoresponse was evoked with a single blue 2.2 log scot-cd · s · m−2 flash. The b-wave amplitudes were measured conventionally, from baseline or a-wave trough to positive peak; a-wave amplitudes were measured from baseline to the trough of the a-wave.
Human Subjects
Two siblings with the clinical diagnosis of Usher syndrome type 1 and with USH1C mutations underwent a complete eye examination and retinal studies. Normal subjects (n = 42; ages, 5–58 years) were also included. Informed consent was obtained for all subjects; procedures adhered to the Declaration of Helsinki and were approved by the institutional review board.
Visual and Retinal Function
Full-field ERGs were performed with a standard protocol. Details of the methods and normal results have been published.16,17 Kinetic perimetry used targets V-4e and I-4e. Static threshold perimetry was performed with a modified automated perimeter (Humphrey Field Analyzer; Carl Zeiss Meditec Inc., Dublin, CA) with 1.7° diameter, 200 ms-duration stimuli under dark-adapted (500 and 650 nm) and light-adapted (600 nm) conditions. Sensitivity (1/threshold) was measured at 2° intervals along the horizontal meridian for 30° on either side of fixation. Techniques, methods of data analysis and normal results have been described.18,19
Optical Coherence Tomography
We obtained cross-sectional retinal reflectivity profiles in the patients and controls with OCT (OCT3; Humphrey Instruments; Carl Zeiss Meditec). Details of our techniques have been published.20,21 Postac-quisition processing of OCT data was performed with custom programs (MatLab 6.5; The MathWorks, Natick, MA). Longitudinal reflectivity profiles (LRPs) making up the OCT scans were aligned using a dynamic cross-correlation algorithm.20 The outer nuclear layer (ONL) thickness was defined as the major intraretinal signal trough delimited by the signal slope maxima. For topographic analysis, the location and orientation of each scan relative to retinal features were determined using video images of the fundus. LRPs were allotted to regularly spaced bins in a rectangular coordinate system centered at the fovea; the waveforms in each bin were aligned and averaged. ONL thickness was measured as described earlier. Missing data were interpolated bilinearly; thickness values were mapped to a pseudocolor scale; and location of blood vessels and optic nerve head was overlaid for reference.21,22
Results
Expression of Harmonin Isoforms
The H1 antibodies are against the N-terminal region that is common to all isoforms of harmonin (Fig. 1A). Using these antibodies to label Western blots (Fig. 1B), we observed that a- and c-isoforms were present in eyecups (the posterior eye). None of the largest isoforms, the b-isoforms, were evident, although the antibodies clearly reacted with a GFP-harmonin-b that was expressed in transfected HEK293 cells. An a-isoform was enriched in the synaptosome fraction. In the rod outer segment (ROS) fraction, a c-isoform and, to a lesser extent, an a-isoform, were detected, but they showed no significant enrichment over that in the eyecup fraction. The ROS fraction contained an enrichment of photoreceptor cilium proteins, as indicated by increased labeling of acetylated α-tubulin. Although the lack of enrichment of harmonin in the ROS fraction does not necessarily exclude its presence in the photoreceptor cilium, this observation is consistent with the lack of immunoelectron microscopic labeling of this structure, described next.
Figure 1.
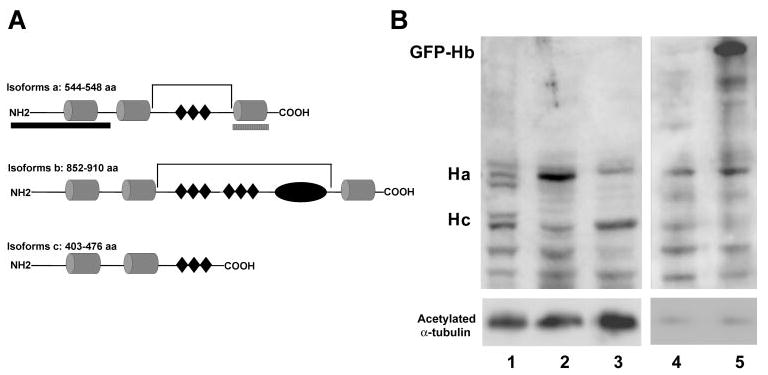
(A) The three classes of harmonin isoforms: a, b, and c.1 The cylindrical structures represent the PDZ domains (PDZ1 to -3 in isoforms a and b, and PDZ1 and -2 in isoform c). (◆) Present predicted coiled–coil domains; the oval structure in isoform b represents a PST (proline, serine, threonine-rich) domain. The brackets indicate the predicted deletions in isoforms a and b, due to the dfcr mutation. The two hatched bars beneath the diagram of isoform a indicate the regions against which the antibodies H1 and H3 were generated. (B) Western blot, labeled with antibodies against harmonin (H1) (top) and acetylated α-tubulin (bottom). Lane 1: mouse eyecup proteins; lane 2: synaptosome fraction from mouse retina; lane 3: ROSs from mouse retinas; lane 4: HEK293 cells; lane 5: HEK293 cells, transfected with GFP-harmonin-b. Each lane was loaded with 20 μg total protein. HEK293 cells express harmonin-a endogenously. Transfected HEK293 cells also showed an upper band that represents GFP-harmonin-b. The acetylated α-tubulin labeling is an indicator of photoreceptor cilium proteins in the ROS fraction (lane 3), although acetylated α-tubulin is present in other parts of the retina, including the photoreceptor synapse.23
Immunoelectron Microscopy of Harmonin
Many of the Usher proteins have been localized in the connecting cilium and/or in the periciliary membrane,12,24–26 as shown for myosin VIIa (Fig. 2A). By contrast, neither of the two harmonin antibodies labeled this region (or the outer segment) (Fig. 2B). Consistent with the Western blot analysis, the most significant concentration of label by the H1 or H3 antibodies, observed by immunoelectron microscopy, was in the synaptic terminals of the photoreceptor cells. At the synapses of the rod photoreceptor cells (rod spherules), immunogold label was evident in the rod presynaptic region, and in the postsynaptic processes of the horizontal and bipolar cells (Figs. 3A–C). Quantification of the gold particles indicated that most of the harmonin labeling was in a central postsynaptic (i.e., bipolar cell) process of each spherule (Fig. 3D).
Figure 2.
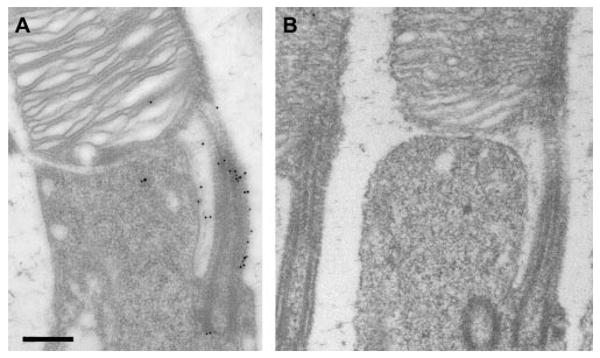
Immunoelectron micrographs of the inner–outer segment junction of rod photoreceptor cells from mouse retinas. (A) Immunogold labeled with antibodies against myosin VIIa. (B) Immunogold labeled with H1 harmonin antibodies. This image was taken from a section that showed labeling of the rod photoreceptor synapses, similar to that shown in Figure 3. (A) and (B) are the same magnification. Scale bar, 300 nm.
Figure 3.
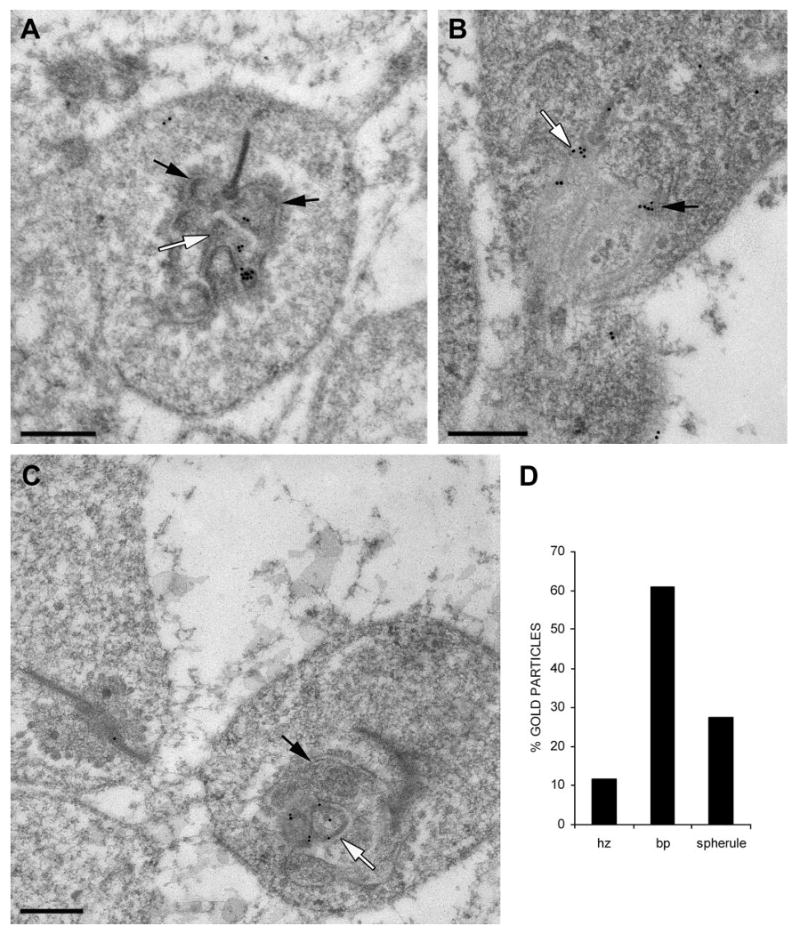
Immunogold labeling of rod photoreceptor synapses with H1 harmonin antibodies. (A–C) Immunoelectron micrographs. Black arrows: horizontal cell postsynaptic processes. White arrows: bipolar cell postsynaptic processes. Scale bar, 300 nm. (D) Relative amounts of immunogold label counted in the postsynaptic horizontal cell processes (hz), the postsynaptic bipolar cell (bp) processes, and the presynaptic rod terminal (spherule; n = 10).
Dfcr Retinal Structure and Function
Deaf circler (dfcr) mice carry a 12.8-kb intragenic deletion that eliminates most of the region between the second and third PDZ domains11 (Fig. 1A). It was reported that retinas of 9-month-old dfcr mice show some degeneration in their periphery.11 We examined the retinas from 12-month-old dfcr mice, across the entire dorsoventral axis by light microscopy. This analysis was performed on mice that had been backcrossed onto the C57BL6 genetic background and repeated on mice that were on the BALB/cBy genetic background, as originally obtained from Jackson Laboratories (and on the same background as that used in the previous study11). With either genetic background, we found no evidence of degeneration in the central retina (Fig. 4A) or in the periphery (Figs. 4B, 4C); in all regions, the dfcr retinas contained the same number of photoreceptor cell nuclei as their control littermates (Fig. 4D).
Figure 4.
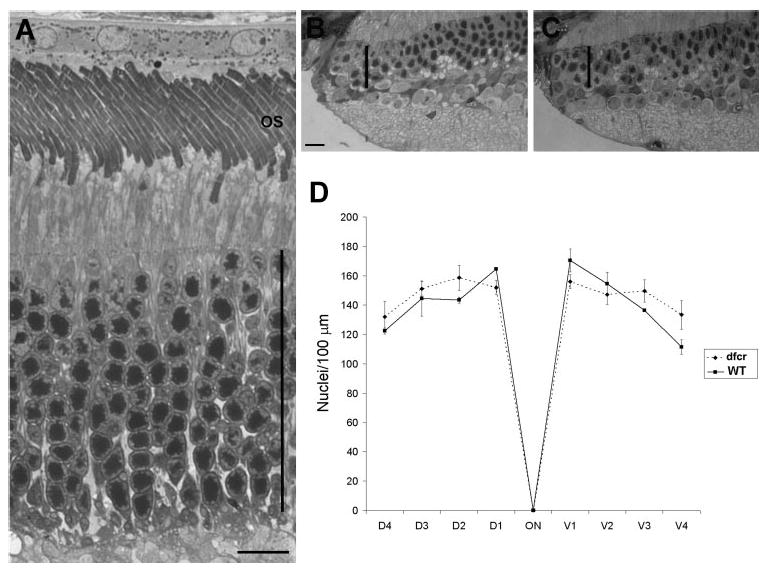
Test for retinal degeneration in the dfcr retina. (A) Light micrograph of the central retina of a 12-month-old dfcr mouse on a BALB/cByJ genetic background. (B, C) Light micrographs of the far periphery of retinas from WT (B) and dfcr (C) 12-month old littermate mice. The dfcr retina appears normal in both the central and peripheral regions. Vertical bars: thickness of the photoreceptor nuclear layer. (D) Quantification of photoreceptor cell nuclei at 0.5-mm intervals along dorsoventral sections of retinas from WT and dfcr 12-month-old littermate mice on a BALB/cByJ genetic background, indicating no difference between WT and dfcr. Error bars, ±SD (n = 3). Comparable data from WT and dfcr 12-month-old mice backcrossed to a C57BL6 background also indicated no difference.
Studies of zebrafish, treated with Ush1c morpholinos to knockdown expression of harmonin, have shown that markers of the photoreceptor cell synaptic layer are mislocalized and that the photoreceptor cell synapses possess fewer arciform densities and fewer processes from second-order neurons (Phillips JB, et al. IOVS 2008;49:ARVO E-Abstract 3070). We examined the ultrastructure of the photoreceptor synapses in dfcr retinas. They appeared normal, possessing all the salient features of this ribbon synapse (Figs. 5A, 5B). Labeling with synaptic terminal markers, antibodies against synaptophysin and SV2, was indistinguishable between dfcr and control littermate retinas (e.g., Supplementary Fig. S1, http://www.iovs.org/cgi/content/full/50/8/3881/DC1). Quantification of the proportion of synapses in EM section, with an evident arciform density, indicated no significant difference between the retinas of dfcr mice and control (heterozygous) littermates. Likewise, quantification of the number of processes from the bipolar and horizontal cells showed that the rod spherules of dfcr retinas contained a normal postsynaptic organization (Fig. 5C). Further, we quantified the density of synaptic vesicles adjacent to the synaptic ribbon and also found no evidence of a defect in this respect (Fig. 5C).
Figure 5.
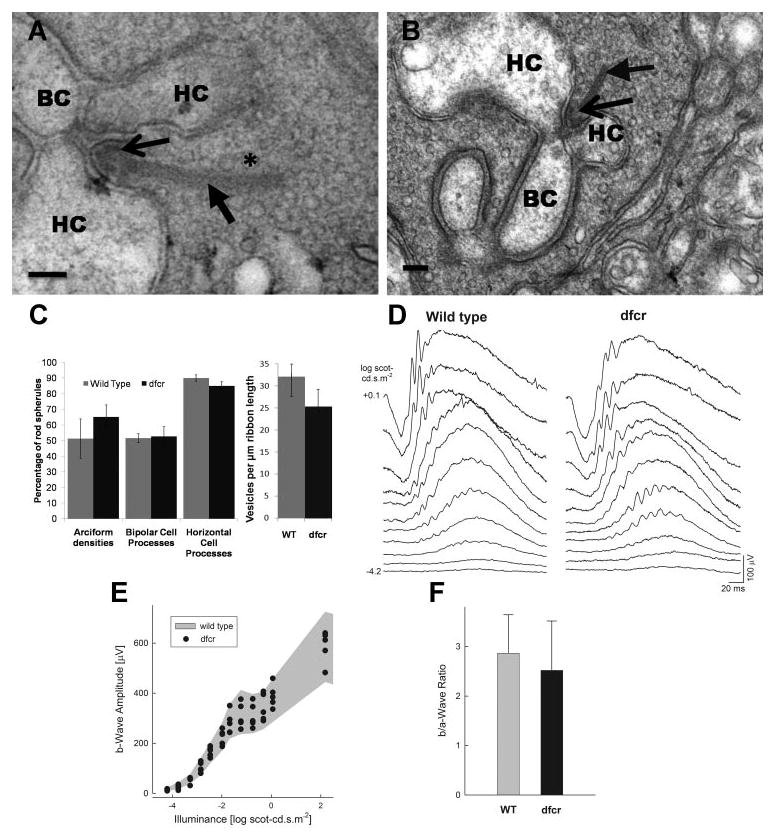
Photoreceptor synaptic structure and function in the dfcr retina. (A, B) Rod photoreceptor synapses (spherules) in a 3-week-old dfcr retina (A) and a 2-month-old dfcr retina (B) show the typical synaptic arrangement observed in mouse retina. Scale bars: (A) 50 nm; (B) 100 nm. Horizontal cell (HC) and bipolar cell (BC) processes, arciform densities (thin arrow), and the density of vesicles (★) associated with the ribbon (thick arrow) are indicated. (C, left) The percentage of rod spherules, shown in ultrathin section, in which an arciform density, a bipolar cell process, and two horizontal processes were evident, and (right) the density of ribbon-associated vesicles in the rod photoreceptor synapses of dfcr and WT retinas. Data shown in (C) were obtained from four dfcr and four wild-type littermates that had been used to obtain the ERG data in (D–F). Bars, mean ± SD. There is no significant difference between dfcr mice and controls for all measurements; according to Student's t-test (n = 4 for each), the probability of no significant difference was calculated as 0.97, 0.89, 0.79, and 0.30 for the number of arciform densities, bipolar cell processes, horizontal processes, and synaptic vesicle density, respectively. (D–F) ERGs and waveform analyses in dfcr mice. (D) Dark-adapted ERGs elicited with increasing intensities of a blue light stimulus in a representative dfcr mouse compared to an age-matched (2-month-old) WT mouse. Stimulus luminance is to the left of key traces; traces start at stimulus onset. ERG waveforms from the dfcr mouse are indistinguishable from those of WT. (E) B-wave amplitude plotted as a function of stimulus intensity in five dfcr mice. Shaded region: normal range (mean ± SD) for wild-type animals (n = 20). The b-wave amplitudes for all animals tested fell within the normal range across a wide range of stimulus intensities. (F) Ratio of the amplitude of the postreceptoral component of the ERG (b-wave) to the receptoral component (a-wave) in response to a +0.1 log scot-cd · s · m−2 stimulus in dfcr compared with results from wild-type. There is no significant difference between dfcr mice and controls (P > 0.05).
Photoreceptor and bipolar cell function in dfcr mice were assayed with ERG. Dark-adapted ERGs in response to suprathreshold but relatively dim intensities of light are dominated by a postsynaptic (bipolar) component of the response, the b-wave (Fig. 5D). Brighter stimuli reveal the photoreceptor component, the a-wave. Both ERG components in a representative dfcr mouse were indistinguishable from wild-type ERGs elicited with a wide range of stimulus intensities (Fig. 5D). The b-wave amplitudes in dfcr mice (n = 5) also fell within the normal range (mean ± SD) of wild-type (n = 20) animals (Fig. 4E). The b- to a-wave ratio, a conventional measure of synaptic transmission between photoreceptors and bipolar cells27 was not significantly different in dfcr mice (mean ± 2 SD = 2.52 ± 1.0) compared with wild-type (2.87 ± 0.78) animals (P > 0.05; (Fig. 5F), arguing against the presence of major dysfunction at the photoreceptor-to-bipolar synapse in this animal model.
Human USH1C Retinal Phenotype
Patients II-1 and II-2, two siblings from an Ashkenazi Jewish family without known consanguinity (Fig. 6A) had severe hearing loss from birth (treated with cochlear implants) and retinitis pigmentosa diagnosed in the second decade of life. The diagnosis was Usher syndrome type 1 and the molecular cause was a homozygous USH1C gene mutation with nucleotide change 238_239insC (R80fs), a mutation that has been previously described.28–31
Figure 6.
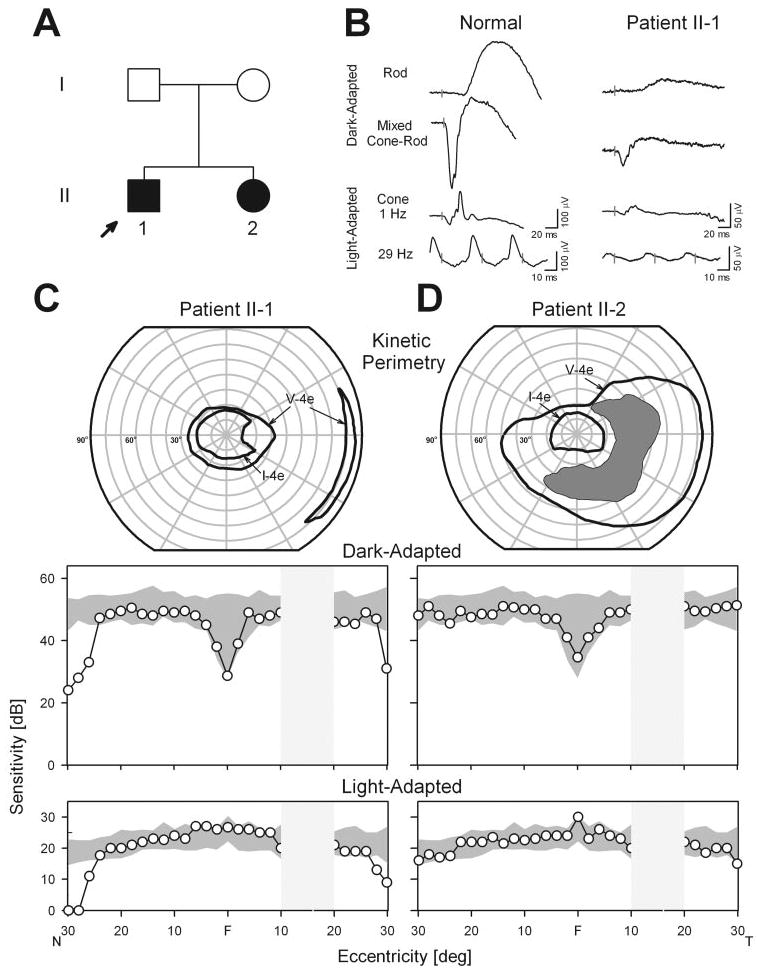
Visual and retinal function in patients with USH1C. (A) Pedigree. Filled symbols: affected; open symbols: unaffected. (B) Full-field ERGs from patient II-1 and a normal subject (age 31 years). Vertical bars: stimulus onset. Calibrations are to the right and below the waveforms. Rod b-waves are reduced (to 8% of mean normal amplitude); mixed ERGs have reduced a- and b-wave amplitudes (11%–12%); and cone ERGs (1 and 29 Hz) are reduced in amplitude (to ∼10%) with normal timing. (C, D) Kinetic perimetry (top) and chromatic static perimetric profiles in the dark-adapted state with a 500 nm stimulus (middle) and in the light-adapted state with a 600 nm stimulus (bottom). Shaded areas represent normal limits. The physiological blind spot is a hatched bar in the temporal field. N, nasal; T, temporal visual field.
Patients II-1 and II-2, at ages 25 and 32 years, respectively, had visual acuities of 20/20 in each eye. Pigmentary retinopathy was present in the periphery. ERGs in II-1 showed a subnormal rod b-wave, reduced a- and b-waves of the mixed cone-rod signal, and reduced cone responses (Fig. 6B). The measured waveform parameters were all between 8% and 12% of normal mean results; for the mixed cone-rod signal, the b- to a-wave ratio was normal at 1.9 (normal mean, 1.6; SD, 0.2; n = 96, age range, 9–50 years32). Kinetic fields in II-1 indicated a large central island separated from a far temporal peripheral island by an absolute mid-peripheral scotoma (Fig. 6C). II-2 had a more extensive field with an incomplete absolute mid-peripheral scotoma (Fig. 6D). Chromatic static perimetry in the dark- and light-adapted states was used to determine rod- and cone-mediated function across the central 60°. II-2 had normal sensitivity at all loci across this region; II-1 was also normal for a wide central region but there was a decline in sensitivity at 26–30° eccentricity.
OCT cross-sections along the horizontal meridian showed normal laminar structure underlying the normal visual function (Fig. 7). ONL thickness was quantified and it was within normal limits except beyond 24–26° eccentricity in patient II-1 (Fig. 7A), where it declined to unmeasurable. This result relates well to the decline in sensitivity at this eccentricity determined by the visual function measurements. Topographical maps of ONL thickness in both patients indicated large central islands of ONL that extended more superiorly than inferiorly. The inset comparing the map of the patients to the lower limit of normal (mean − 2 SD) showed that this central island had normal ONL thickness (Figs. 7, right, insets), but there was a decrement of ONL thickness with increasing eccentricity.
Figure 7.
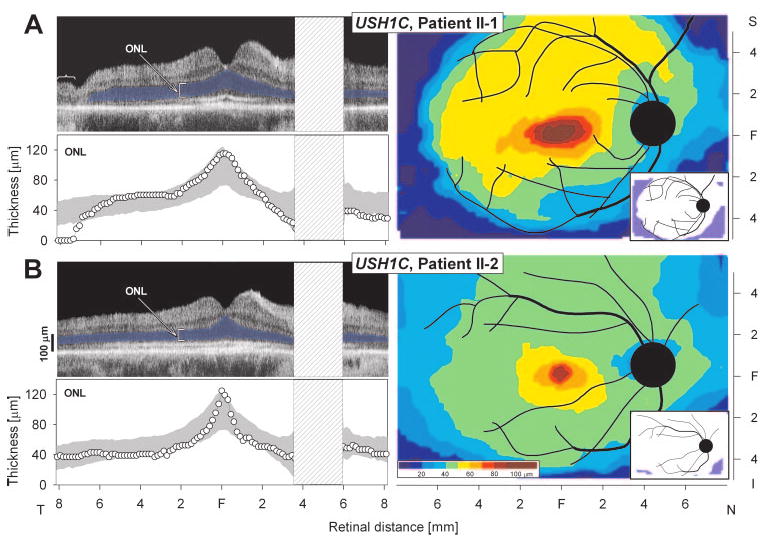
Retinal laminar architecture in patients with USH1C. (A, B, left) OCT images across the horizontal meridian of patients II-1 and II-2. Outer nuclear layer (ONL) thickness is quantified beneath each scan and compared with normal limits (gray shading, mean ± 2 SD). ONL is colored blue. Bracket identifies area of disorganized retina without ONL in patient II-1 temporal retina. (A, B, right) Topographical maps of ONL thickness in the two patients. Traces of major blood vessels and location of optic nerve head are overlaid on each map (depicted as right eyes). Pseudocolor scales are shown beneath the normal maps. Insets: thickness difference maps showing region that is abnormally thinned (blue) or within normal limits (white, defined as mean ± 2 SD). N, nasal; S, superior; I, inferior, F, fovea.
Discussion
Our results show that harmonin isoforms a and c were present in eyecups. Harmonin-a was concentrated in the photoreceptor synapse, where the majority was found postsynaptically. The deaf circler mouse, while having a clear inner ear and vestibular defect, was found to have normal photoreceptor cell viability across the entire retina, and normal ultrastructure and function of the rod photoreceptor synapse. Two patients with Usher 1C exhibited normal central retinal structure and function, but their peripheral retinas had signs of degeneration.
Two previous studies on harmonin expression in the retina report different results. Our results are in agreement with those in one study, in which only isoforms a and c were detected,1 but not with another study, which also reported the presence of harmonin-b.33 In this latter study, Reiners et al.33 found that harmonin-b was present in the photoreceptor outer segments. We did not detect harmonin-b in eyecups by Western blot analysis, and, in sections, the outer segments were not labeled with H1 antibodies, which were generated against the N-terminal region that is common among all isoforms, or with the H3 antibodies, which were generated against a region that is common to the a and b isoforms (Fig. 1). It is not clear why our findings and those of Reiners et al.33 differ. They also used N-terminal antibodies, although the region represented by their immunogen was different from ours; they used amino acids 1–89 of mouse harmonin, whereas our H1 antibodies were generated against amino acids 1–200 of mouse harmonin, so that primary epitopes could be different. The H1 antibodies were shown to react with harmonin-b on Western blots of proteins from transfected HEK293 cells (Fig. 1B). Our results and those of Verpy et al.1 suggest that the retina differs from the cochlea, where harmonin-b has been shown to be present by functional studies as well as immunolocalization. Harmonin-b isoforms are the largest and contain two additional modules, including a PST region (Fig. 1A), which is associated with the binding of actin filaments.34 This f-actin binding domain may have a critical role in the function of harmonin in the F-actin-rich stereocilia of cochlear hair cells.
In a previous study, harmonin was localized near the synaptic ribbon of the rod photoreceptor synapse.33 In the present study, harmonin was found not only in the rod synaptic terminal, but also in the processes of the second-order neurons that extended into the invagination of each rod spherule. Indeed, the bipolar cell process contained more than twice the label counted in the rod spherule. This observation indicates that future attempts at Usher 1C gene therapy should consider transduction of bipolar and horizontal cells in addition to the photoreceptor cells, although there was no indication of an ERG abnormality attributable to postphotoreceptoral synaptic dysfunction, such as an abnormal b- to a-wave ratio, in either the Ush1c mutant mice or patients with USH1C mutations.
Because of its primary structure, with two or three PDZ domains (Fig. 1), plus in vitro binding studies and functional studies with cochlear hair cells,4,5,34,35 harmonin has been proposed as the central scaffolding element that binds other Usher proteins into a so-called Usher interactome.7–10 Although evidence is less apparent for an Usher interactome in the retina than in the cochlea, two candidate locations in the retina have been proposed. One is in the region of the photoreceptor connecting cilium and periciliary membrane, where the Usher 1B (myosin VIIa), Usher 1G (SANS), Usher 2A (usherin), Usher 2C (VLGR1), and Usher 2D (whirlin) proteins have been localized.12,24–26 However, harmonin has not been localized to this region previously,33 and was not detected there in the present study. The other location is the photoreceptor synapse, which has been proposed extensively as an Usher interactome site.7–10,33,36,37 As discussed elsewhere,38 a weakness of this proposal is the lack of convincing evidence that any of the Usher proteins, besides harmonin, reside there. Further doubt about the likelihood of Usher protein interactions in the synapse has been cast by the present observations of harmonin in the postsynaptic neurons. Except for the presence of myosin VIIa in the RPE,39,40 there is no evidence that any of the other Usher 1 or 2 proteins is expressed in other retinal cells besides the photoreceptor cells. Therefore, in the retina, harmonin is likely to function largely independent of other Usher-1 or -2 proteins.
USH1C, previously thought to be a disease exclusive to Acadians, has now been documented in many ethnic groups.28–31 Molecular diagnosis has been refined but there is no parallel progress in understanding the detailed retinal phenotype of Usher genotypes. Such progress is especially useful in cases in which the murine models lack retinal degeneration, as shown here for the dfcr model for Usher 1C, and reported elsewhere for most of the models of other types of Usher syndrome.38 From the standpoint of preclinical retinal gene therapy studies for Usher 1C, it is unfortunate that we have been unable to identify a mutant phenotype in the dfcr mouse retina. Even though the shaker1 mouse, a model for Usher 1B, does not undergo retinal degeneration, the identification of mutant retinal phenotypes has enabled the testing of a functional protein introduced through gene therapy.41
The two siblings with USH1C mutations in the present work show the expected results in mid- and far peripheral retina of dysfunction by perimetry and ERGs, and retinal degeneration and signs of retinal remodeling by OCT. The unexpected result, however, was the normal structure and function in a wide central retinal region. A normal expanse of central retina was also recently reported in some patients with USH1B mutations.22 Further Usher 1C patients at all disease stages should be studied in similar detail. If retinal function and structure is normal for relatively long durations after birth, maybe the human disease is simply more aggressive than in the mouse. Alternatively, the dfcr mouse, with its apparent complete lack of mutant retinal phenotype, may be a model for nonsyndromic deafness. The dfcr mutation also affects harmonin isoforms a and c (Fig. 1A), and therefore also affects retinal harmonin, but it is still possible that it results in a functional defect that is restricted to the ear. The mutation does not affect any of the PDZ domains, and the elimination of the coiled coil domains in harmonin may not be pathologic (in which case, it would seem important to test the function of the F-actin binding domain in cochlear hair cell function). The mutation carried by the patients with USH1C described herein should have a more drastic effect on the gene (it is likely an effective null) than the dfcr in-frame deletion. Nonsyndromic deafness, DFNB18, has been linked to mutations in the USH1C gene, so that there appears to be a genotype-phenotype relationship, with hypomorphic alleles of USH1C causing deafness without retinal defects.30,42
Supplementary Material
Acknowledgments
The authors thank Sharon B. Schwartz, Alexander Sumaroka, Alejandro J. Roman, Elaine E. Smilko, Elizabeth A. M. Windsor, Monalisa Mishra, Kornnika Khanobdee, and Karen Teofilo for providing critical help.
Supported by grants from the National Eye Institute, the National Neuroscience Research Institute, Foundation Fighting Blindness, Research to Prevent Blindness (RPB), and Hope for Vision. DSW is a Jules and Doris Stein RPB Professor.
Footnotes
Disclosure: D.S. Williams, None; T.S. Aleman, None; C. Lillo, None; V.S. Lopes, None; L.C. Hughes, None; E.M. Stone, None; S.G. Jacobson, None
References
- 1.Verpy E, Leibovici M, Zwaenepoel I, et al. A defect in harmonin, a PDZ domain-containing protein expressed in the inner ear sensory hair cells, underlies Usher syndrome type 1C. Nat Genet. 2000;26:51–55. doi: 10.1038/79171. [DOI] [PubMed] [Google Scholar]
- 2.Scanlan MJ, Chen YT, Williamson B, et al. Characterization of human colon cancer antigens recognized by autologous antibodies. Int J Cancer. 1998;76:652–658. doi: 10.1002/(sici)1097-0215(19980529)76:5<652::aid-ijc7>3.0.co;2-p. [DOI] [PubMed] [Google Scholar]
- 3.Scanlan MJ, Williamson B, Jungbluth A, et al. Isoforms of the human PDZ-73 protein exhibit differential tissue expression. Biochim Biophys Acta. 1999;1445:39–52. doi: 10.1016/s0167-4781(99)00033-0. [DOI] [PubMed] [Google Scholar]
- 4.Boeda B, El-Amraoui A, Bahloul A, et al. Myosin VIIa, harmonin and cadherin 23, three Usher I gene products that cooperate to shape the sensory hair cell bundle. EMBO J. 2002;21:6689–6699. doi: 10.1093/emboj/cdf689. [DOI] [PMC free article] [PubMed] [Google Scholar]
- 5.Siemens J, Kazmierczak P, Reynolds A, Sticker M, Littlewood-Evans A, Muller U. The Usher syndrome proteins cadherin 23 and harmonin form a complex by means of PDZ-domain interactions. Proc Natl Acad Sci U S A. 2002;99:14946–14951. doi: 10.1073/pnas.232579599. [DOI] [PMC free article] [PubMed] [Google Scholar]
- 6.Adato A, Michel V, Kikkawa Y, et al. Interactions in the network of Usher syndrome type 1 proteins. Hum Mol Genet. 2005;14:347–356. doi: 10.1093/hmg/ddi031. [DOI] [PubMed] [Google Scholar]
- 7.Reiners J, van Wijk E, Marker T, et al. Scaffold protein harmonin (USH1C) provides molecular links between Usher syndrome type 1 and type 2. Hum Mol Genet. 2005;14:3933–3943. doi: 10.1093/hmg/ddi417. [DOI] [PubMed] [Google Scholar]
- 8.Kremer H, van Wijk E, Marker T, Wolfrum U, Roepman R. Usher syndrome: molecular links of pathogenesis, proteins and pathways. Hum Mol Genet. 2006;15:R262–R270. doi: 10.1093/hmg/ddl205. [DOI] [PubMed] [Google Scholar]
- 9.Reiners J, Nagel-Wolfrum K, Jurgens K, Marker T, Wolfrum U. Molecular basis of human Usher syndrome: deciphering the meshes of the Usher protein network provides insights into the pathomechanisms of the Usher disease. Exp Eye Res. 2006;83:97–119. doi: 10.1016/j.exer.2005.11.010. [DOI] [PubMed] [Google Scholar]
- 10.van Wijk E, van der Zwaag B, Peters T, et al. The DFNB31 gene product whirlin connects to the Usher protein network in the cochlea and retina by direct association with USH2A and VLGR1. Hum Mol Genet. 2006;15:751–765. doi: 10.1093/hmg/ddi490. [DOI] [PubMed] [Google Scholar]
- 11.Johnson KR, Gagnon LH, Webb LS, et al. Mouse models of USH1C and DFNB18: phenotypic and molecular analyses of two new spontaneous mutations of the Ush1c gene. Hum Mol Genet. 2003;12:3075–3086. doi: 10.1093/hmg/ddg332. [DOI] [PMC free article] [PubMed] [Google Scholar]
- 12.Liu X, Vansant G, Udovichenko IP, Wolfrum U, Williams DS. Myosin VIIa, the product of the Usher 1B syndrome gene, is concentrated in the connecting cilia of photoreceptor cells. Cell Motil Cytoskel. 1997;37:240–252. doi: 10.1002/(SICI)1097-0169(1997)37:3<240::AID-CM6>3.0.CO;2-A. [DOI] [PubMed] [Google Scholar]
- 13.Buckley K, Kelly RB. Identification of a transmembrane glycoprotein specific for secretory vesicles of neural and endocrine cells. J Cell Biol. 1985;100:1284–1294. doi: 10.1083/jcb.100.4.1284. [DOI] [PMC free article] [PubMed] [Google Scholar]
- 14.Johnson BA, Ikeda S, Pinto LH, Ikeda A. Reduced synaptic vesicle density and aberrant synaptic localization caused by a splice site mutation in the Rs1h gene. Vis Neurosci. 2006;23:887–898. doi: 10.1017/S0952523806230244. [DOI] [PubMed] [Google Scholar]
- 15.Roman AJ, Boye SL, Aleman TS, et al. Electroretinographic analyses of Rpe65-mutant rd12 mice: developing an in vivo bioassay for human gene therapy trials of Leber congenital amaurosis. Mol Vis. 2007;13:1701–1710. [PubMed] [Google Scholar]
- 16.Jacobson SG, Yagasaki K, Feuer WJ, Roman AJ. Interocular asymmetry of visual function in heterozygotes of X-linked retinitis pigmentosa. Exp Eye Res. 1989;48:679–691. doi: 10.1016/0014-4835(89)90009-2. [DOI] [PubMed] [Google Scholar]
- 17.Aleman TS, Cideciyan AV, Volpe NJ, Stevanin G, Brice A, Jacobson SG. Spinocerebellar ataxia type 7 (SCA7) shows a cone-rod dystrophy phenotype. Exp Eye Res. 2002;74:737–745. doi: 10.1006/exer.2002.1169. [DOI] [PubMed] [Google Scholar]
- 18.Jacobson SG, Voigt WJ, Parel JM, et al. Automated light- and dark-adapted perimetry for evaluating retinitis pigmentosa. Ophthalmology. 1986;93:1604–1611. doi: 10.1016/s0161-6420(86)33522-x. [DOI] [PubMed] [Google Scholar]
- 19.Schwartz SB, Aleman TS, Cideciyan AV, et al. Disease expression in Usher syndrome caused by VLGR1 gene mutation (USH2C) and comparison with USH2A phenotype. Invest Ophthalmol Vis Sci. 2005;46:734–743. doi: 10.1167/iovs.04-1136. [DOI] [PubMed] [Google Scholar]
- 20.Huang Y, Cideciyan AV, Papastergiou GI, et al. Relation of optical coherence tomography to microanatomy in normal and rd chickens. Invest Ophthalmol Vis Sci. 1998;39:2405–2416. [PubMed] [Google Scholar]
- 21.Jacobson SG, Aleman TS, Cideciyan AV, et al. Identifying photoreceptors in blind eyes caused by RPE65 mutations: prerequisite for human gene therapy success. Proc Natl Acad Sci U S A. 2005;102:6177–6182. doi: 10.1073/pnas.0500646102. [DOI] [PMC free article] [PubMed] [Google Scholar]
- 22.Jacobson SG, Aleman TS, Sumaroka A, et al. Disease boundaries in the retina of patients with Usher syndrome caused by MYO7A gene mutations. Invest Ophthalmol Vis Sci. 2009;50(4):1886–1894. doi: 10.1167/iovs.08-3122. [DOI] [PubMed] [Google Scholar]
- 23.Sale WS, Besharse JC, Piperno G. Distribution of acetylated alpha-tubulin in retina and in vitro-assembled microtubules. Cell Motil Cytoskeleton. 1988;9:243–253. doi: 10.1002/cm.970090306. [DOI] [PubMed] [Google Scholar]
- 24.Goodyear R, Richardson G. The ankle-link antigen: an epitope sensitive to calcium chelation associated with the hair-cell surface and the calycal processes of photoreceptors. J Neurosci. 1999;19:3761–3772. doi: 10.1523/JNEUROSCI.19-10-03761.1999. [DOI] [PMC free article] [PubMed] [Google Scholar]
- 25.Liu X, Bulgakov OV, Darrow KN, et al. Usherin is required for maintenance of retinal photoreceptors and normal development of cochlear hair cells. Proc Natl Acad Sci U S A. 2007;104:4413–4418. doi: 10.1073/pnas.0610950104. [DOI] [PMC free article] [PubMed] [Google Scholar]
- 26.Maerker T, van Wijk E, Overlack N, et al. A novel Usher protein network at the periciliary reloading point between molecular transport machineries in vertebrate photoreceptor cells. Hum Mol Genet. 2008;17:71–86. doi: 10.1093/hmg/ddm285. [DOI] [PubMed] [Google Scholar]
- 27.Aleman TS, LaVail MM, Montemayor R, et al. Augmented rod bipolar cell function in partial receptor loss: an ERG study in P23H rhodopsin transgenic and aging normal rats. Vision Res. 2001;41:2779–2797. doi: 10.1016/s0042-6989(01)00157-2. [DOI] [PubMed] [Google Scholar]
- 28.Bitner-Glindzicz M, Lindley KJ, Rutland P, et al. A recessive contiguous gene deletion causing infantile hyperinsulinism, enteropathy and deafness identifies the Usher type 1C gene. Nat Genet. 2000;26:56–60. doi: 10.1038/79178. [DOI] [PubMed] [Google Scholar]
- 29.Zwaenepoel I, Verpy E, Blanchard S, et al. Identification of three novel mutations in the USH1C gene and detection of thirty-one polymorphisms used for haplotype analysis. Hum Mutat. 2001;17:34–41. doi: 10.1002/1098-1004(2001)17:1<34::AID-HUMU4>3.0.CO;2-O. [DOI] [PubMed] [Google Scholar]
- 30.Ahmed ZM, Smith TN, Riazuddin S, et al. Nonsyndromic recessive deafness DFNB18 and Usher syndrome type IC are allelic mutations of USHIC. Hum Genet. 2002;110:527–531. doi: 10.1007/s00439-002-0732-4. [DOI] [PubMed] [Google Scholar]
- 31.Blaydon DC, Mueller RF, Hutchin TP, et al. The contribution of USH1C mutations to syndromic and non-syndromic deafness in the UK. Clin Genet. 2003;63:303–307. doi: 10.1034/j.1399-0004.2003.00058.x. [DOI] [PubMed] [Google Scholar]
- 32.Azari AA, Aleman TS, Cideciyan AV, et al. Retinal disease expression in Bardet-Biedl syndrome-1 (BBS1) is a spectrum from maculopathy to retina-wide degeneration. Invest Ophthalmol Vis Sci. 2006;47:5004–5010. doi: 10.1167/iovs.06-0517. [DOI] [PubMed] [Google Scholar]
- 33.Reiners J, Reidel B, El-Amraoui A, et al. Differential distribution of harmonin isoforms and their possible role in Usher-1 protein complexes in mammalian photoreceptor cells. Invest Ophthalmol Vis Sci. 2003;44:5006–5015. doi: 10.1167/iovs.03-0483. [DOI] [PubMed] [Google Scholar]
- 34.Weil D, El-Amraoui A, Masmoudi S, et al. Usher syndrome type I G (USH1G) is caused by mutations in the gene encoding SANS, a protein that associates with the USH1C protein, harmonin. Hum Mol Genet. 2003;12:463–471. doi: 10.1093/hmg/ddg051. [DOI] [PubMed] [Google Scholar]
- 35.Senften M, Schwander M, Kazmierczak P, et al. Physical and functional interaction between protocadherin 15 and myosin VIIa in mechanosensory hair cells. J Neurosci. 2006;26:2060–2071. doi: 10.1523/JNEUROSCI.4251-05.2006. [DOI] [PMC free article] [PubMed] [Google Scholar]
- 36.Reiners J, Marker T, Jurgens K, Reidel B, Wolfrum U. Photoreceptor expression of the Usher syndrome type 1 protein protocadherin 15 (USH1F) and its interaction with the scaffold protein harmonin (USH1C) Mol Vis. 2005;11:347–355. [PubMed] [Google Scholar]
- 37.Reiners J, Wolfrum U. Molecular analysis of the supramolecular usher protein complex in the retina: harmonin as the key protein of the Usher syndrome. Adv Exp Med Biol. 2006;572:349–353. doi: 10.1007/0-387-32442-9_49. [DOI] [PubMed] [Google Scholar]
- 38.Williams DS. Usher syndrome: animal models, retinal function of Usher proteins, and prospects for gene therapy. Vision Res. 2008;48:433–441. doi: 10.1016/j.visres.2007.08.015. [DOI] [PMC free article] [PubMed] [Google Scholar]
- 39.Hasson T, Heintzelman MB, Santos-Sacchi J, Corey DP, Mooseker MS. Expression in cochlea and retina of myosin VIIa, the gene product defective in Usher syndrome type 1B. Proc Natl Acad Sci USA. 1995;92:9815–9819. doi: 10.1073/pnas.92.21.9815. [DOI] [PMC free article] [PubMed] [Google Scholar]
- 40.Gibbs D, Azarian SM, Lillo C, et al. Role of myosin VIIa and Rab27a in the motility and localization of RPE melanosomes. J Cell Sci. 2004;117:6473–6483. doi: 10.1242/jcs.01580. [DOI] [PMC free article] [PubMed] [Google Scholar]
- 41.Hashimoto T, Gibbs D, Lillo C, et al. Lentiviral gene replacement therapy of retinas in a mouse model for Usher syndrome type 1B. Gene Ther. 2007;14:584–594. doi: 10.1038/sj.gt.3302897. [DOI] [PMC free article] [PubMed] [Google Scholar]
- 42.Ouyang XM, Xia XJ, Verpy E, et al. Mutations in the alternatively spliced exons of USH1C cause non-syndromic recessive deafness. Hum Genet. 2002;111:26–30. doi: 10.1007/s00439-002-0736-0. [DOI] [PubMed] [Google Scholar]
Associated Data
This section collects any data citations, data availability statements, or supplementary materials included in this article.