Abstract
The mammalian target of rapamycin complex 1 (mTORC1) integrates mitogen and nutrient signals to control cell proliferation and cell size. Hence, mTORC1 is implicated in a large number of human diseases--including diabetes, obesity, heart disease, and cancer--that are characterized by aberrant cell growth and proliferation. Although eukaryotic translation initiation factor 4E-binding proteins (4E-BPs) are critical mediators of mTORC1 function, their precise contribution to mTORC1 signaling and the mechanisms by which they mediate mTORC1 function have remained unclear. We inhibited the mTORC1 pathway in cells lacking 4E-BPs and analyzed the effects on cell size, cell proliferation, and cell cycle progression. Although the 4E-BPs had no effect on cell size, they inhibited cell proliferation by selectively inhibiting the translation of messenger RNAs that encode proliferation-promoting proteins and proteins involved in cell cycle progression. Thus, control of cell size and cell cycle progression appear to be independent in mammalian cells, whereas in lower eukaryotes, 4E-BPs influence both cell growth and proliferation.
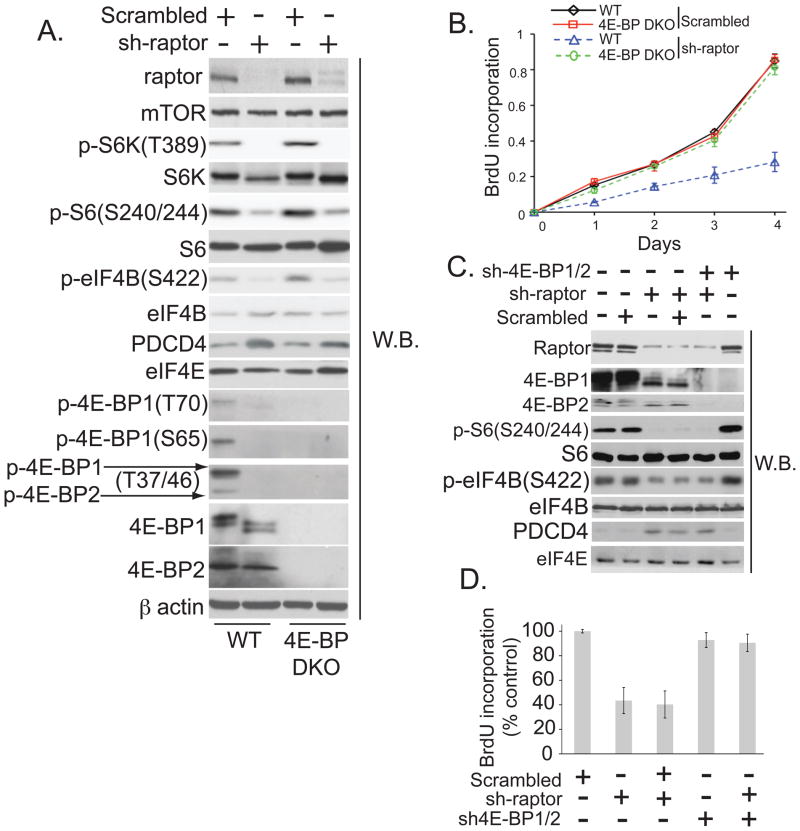
The mammalian target of rapamycin complex 1 (mTORC1) controls growth (increase in cell mass) and proliferation (increase in cell number) by modulating mRNA translation through phosphorylation of the eukaryotic translation initiation factor 4E (eIF4E)-binding proteins (4E-BP1, 2, and 3) and the ribosomal protein S6 kinases (S6K1 and 2) (1, 2). 4E-BPs regulate the translation of a subset of mRNAs by competing with eIF4G for binding to eIF4E, thus preventing the assembly of the eIF4F complex, whereas the S6Ks control the phosphorylation status of a number of translational components (1–3). Rapamycin has been an important tool in understanding mTORC1 signaling; however, it inefficiently and transiently inhibits 4E-BP phosphorylation (4)(fig. S1A). Moreover, we found that rapamycin inhibited proliferation and G1/S cell cycle progression of WT and 4E-BP double knock-out (DKO) mouse embryonic fibroblasts (MEFs) to the same extent, which suggests that its effects are not mediated by 4E-BPs (fig. S1, B to D). To directly address the role of 4E-BPs in mTORC1 signaling, we depleted raptor, a component of mTORC1 required for substrate binding (5), in these MEFs. 4E-BP DKO MEFs lack all three 4E-BPs as they do not express 4E-BP3 (fig. S2A). Depletion of raptor diminished the phosphorylation of 4E-BP1 at all mTOR-sensitive sites in wild-type MEFs, and inhibited mTORC1 signaling to the same extent in wild-type and 4E-BP DKO MEFs, as illustrated by reduced phosphorylation of S6Ks and its substrates (ribosomal protein S6 and eIF4B) and increased abundance of programmed cell death protein 4 (PDCD4) (Fig. 1A). Wild-type MEFs in which raptor was depleted proliferated more slowly than control cells, whereas raptor-depleted 4E-BP DKO MEFs proliferated at a rate indistinguishable from that of control cells (Fig. 1B). Similarly, in human embryonic kidney (HEK) 293T cells, raptor silencing had a pronounced effect on mTORC1 signaling and proliferation (Figs. 1C and D). The effect of raptor silencing on proliferation, but not mTOR signaling, was attenuated by co-depletion of 4E-BPs (Fig. 1D). Thus, mTORC1-dependent proliferation requires 4E-BPs.
Fig. 1. 4E-BPs mediate mTORC1’s effects on cell proliferation.
(A) Levels of the indicated proteins in wild-type and 4E-BP DKO MEFs infected with a scrambled or raptor-specific shRNA (sh-raptor) were determined by Western blotting. β actin-loading control. (B) Proliferation of MEFs from (A) was determined by 5-bromo2′-deoxyuridine (BrdU) incorporation. Results represent means ± SD (n=4). (C) Western blots of HEK293T cells infected by raptor and 4E-BP1 and 2 shRNA (sh-raptor; sh-4E-BP1/2), or scrambled shRNA. eIF4E served as a loading control. D Proliferation of cells from (C) was determined by BrdU incorporation. Results represent percentage of the values obtained in dimethyl sulfoxide (DMSO)-treated cells (set to 100%) ± SD values (n=4).
To further assess the role of 4E-BPs in mTORC1-mediated cell proliferation, we depleted mTOR or rictor (an mTORC2 specific component), in HEK293T cells. Depletion of mTOR resulted in decreased signaling by both mTORC1 and mTORC2, as measured by S6 Ser240/Ser244 or Akt Ser473 phosphorylation (fig. S2B). In contrast, depletion of rictor abolished only mTORC2-mediated phosphorylation of Akt, which was augmented by the depletion of raptor (fig. S2B), consistent with the loss of the negative feedback-loop from S6Ks to Akt (6). Depletion of mTOR, raptor, or rictor inhibited cell proliferation relative to control cells (fig. S2C). However, in the case of raptor or mTOR depletion, co-depletion of 4E-BPs totally or partially restored proliferation, respectively, whereas their depletion had no effect on the inhibition caused by rictor knockdown (fig. S2C). Thus, 4E-BPs mediate the effect of mTORC1, but not mTORC2, on proliferation.
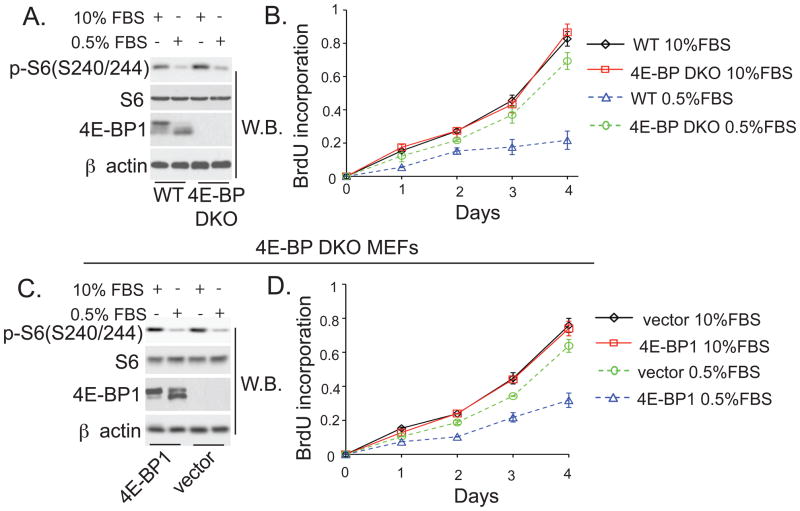
mTORC1 is differentially activated by distinct stimuli, including serum growth factors and amino acids (7). In low (0.5%) serum, or in the absence of amino acids, mTORC1 activity was blunted, as measured by decreased 4E-BP1 and S6 phosphorylation of (Fig. 2A and fig. S2D). In 10% serum or in the presence of amino acids, WT and 4E-BP DKO MEFs proliferated at the same rate, whereas in low serum or in the absence of amino acids, 4E-BP DKO MEFs proliferated at a faster rate than WT MEFs (Fig. 2B and fig. S2E). Theses effects were specific as reexpression of 4E-BP1 slowed proliferation of cells exposed to low serum (Fig. 2, C and D). Thus, distinct stimuli mediate proliferative responses largely through 4E-BPs.
Fig. 2. 4E-BPs regulate cell proliferation in low-serum conditions.
(A and C) Levels of the indicated proteins were determined by Western blotting in wild-type and 4E-BP DKO MEFs (A), or 4E-BP DKO MEFs infected with vector or 4E-BP1 construct (C), and maintained for 48h in 10% or 0.5% FBS. β actin served as a loading control. (B and D) Proliferation of WT and 4E-BP DKO MEFs (B) or 4E-BP DKO MEFs infected with vector or 4E-BP1 construct (D) maintained in 10% or 0.5% FBS was measured by BrdU incorporation. Results represent means ± SD (n=3).
Unlike rapamycin, active-site mTOR inhibitors (asTORi; e.g. PP242 and Torin1) suppress rapamycin-resistant phosphorylation of 4E-BPs (8–10)(fig. S1A, fig. S3, A and B). The anti-proliferative effects of asTORi on WT MEFs were partially attenuated in 4E-BP DKO MEFs (Fig. S3, C and D), most likely due the inhibition of both mTORC1 and mTORC2 (fig. S2C). The specificity of the inhibitory effects of asTORi is demonstrated by the finding that the proliferation of 4E-BP DKO MEFs, in which 4E-BP1 was reexpressed, was more strongly inhibited than in the 4E-BP DKO MEFs infected with a control virus (Fig. S3E). In contrast to asTORi, U0126, a mitogen-activated protein kinase kinase (MAPKK) inhibitor (11), suppressed the proliferation of both MEFs to the same extent, whereas the combination of Torin1 and U0126 had an additive inhibitory effect (fig. S3F). Thus the effects of asTORi appear to be specific for mTOR and are largely mediated by 4E-BPs. Depletion of 4E-BPs also conferred resistance of U937 (human promonocytic cell line) and Jurkat cells (human T cell leukemia cell line) to the anti-proliferative effects of asTORi (fig. S3G).
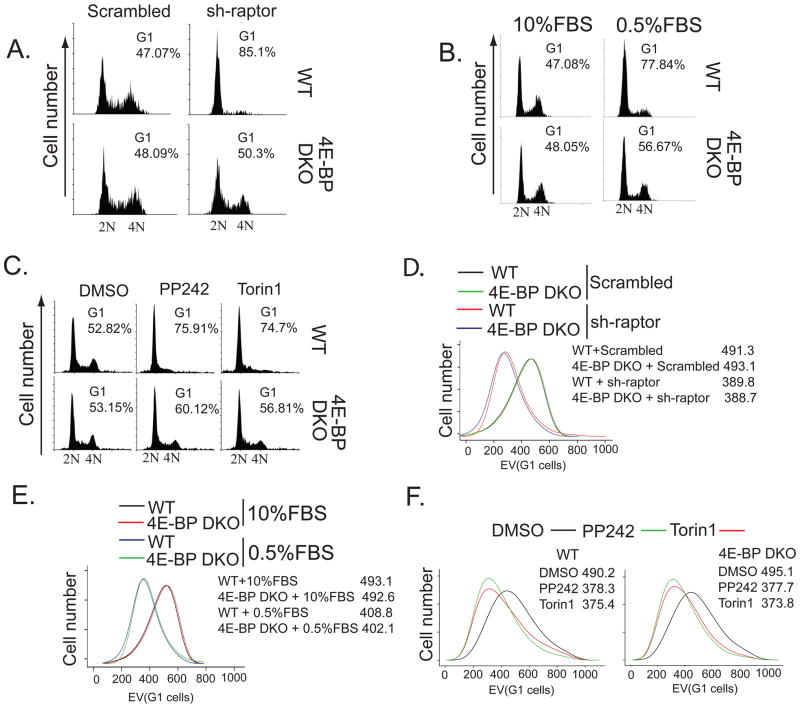
Next, we investigated whether the inhibition of proliferation by 4E-BPs is associated with the attenuation of cell cycle progression, cell survival, or cell growth. Depletion of raptor by short-hairpin RNA (shRNA) impaired G1 to S phase progression of wild-type MEFs, but had little effect on 4E-BP DKO MEFs (Fig. 3A). Likewise, the inhibition of wild-type cell cycle progression by serum deprivation or treatment with asTORi was largely unaffected in 4E-BP DKO MEFs (Fig. 3, B and C). Under all these conditions there were no apparent differences in survival of WT and 4E-BP DKO MEFs (Fig. S4, A to C). Depletion of raptor, serum deprivation or addition of asTORi decreased cell size in WT and 4E-BP DKO MEFs to a similar extent (Fig. 3, D to F). Thus, mTORC1 mediated inhibition of 4E-BPs affects proliferation through the modulation of cell cycle, rather than cell survival or cell size; this suggests that in mammalian cells, the regulation of cell size and proliferation can be uncoupled.
Fig. 3. 4E-BPs mediate the effects of mTORC1 signaling on cell cycle, but not on cell size.
(A to C) Cell cycle distributions for WT and 4E-BP DKO MEFs infected with a control or raptor-specific (sh-raptor) shRNA (A), maintained in 10% or 0.5% FBS for 48 hours (B), or treated with 2.5 μM PP242, 250 nM Torin1, or vehicle (DMSO) for 24 hours (C) were monitored by flow cytometry. N indicates DNA content. Cell size distributions for WT and 4E-BP DKO MEFs infected with a scrambled control or raptor-specific (sh-raptor) shRNA (D), maintained in 10 or 0.5% FBS (E) or treated as in (C) with the indicated compounds (F). The size of G1 cells was determined by measuring electronic volume (EV) with flow cytometry; numbers represent mean EV values.
S6Ks play a key role in the control of cell size (12), and S6K DKO MEFs are smaller than their WT counterparts (fig. S5A). asTORi-induced reduction in cell size was abrogated in S6K DKO MEFs (fig. S5A). Reexpression of S6K1 and 2 (fig. S5G) or a constitutively active mutant, S6K1CA (fig. S5H), completely restored cell size (fig. S5, A to C). asTORi decreased the size of S6K1/2-rescued MEFs as compared to S6K1/2 DKO MEFs (fig. S5B), whereas the drugs failed to reduce the size of cells expressing asTORi-insensitive S6K1CA (fig. S5, C and I). Thus, the inhibitory effects of asTORi on cell size appear to be mediated by the S6Ks. In contrast to cell size, asTORi induced accumulation of G1 phase cells irrespective of their S6K status (fig. S5, D to F). Although 4E-BP DKO MEFs exhibit increased S6K activity ((13); Fig. 1A), these data indicate that the proliferative response is independent of S6Ks. Accordingly, the depletion of 4E-BPs rendered both wild-type and S6K DKO MEFs equally resistant to the anti-proliferative effects of asTORi (fig. S6, A and B), demonstrating that 4E-BPs control proliferation downstream of mTORC1 independent of S6Ks. asTORi inhibition of cell size, cell proliferation, and cell cycle progression were all ameliorated in S6K1/4E-BP1/2 triple-knockout (TKO) MEFs (fig. S6C).
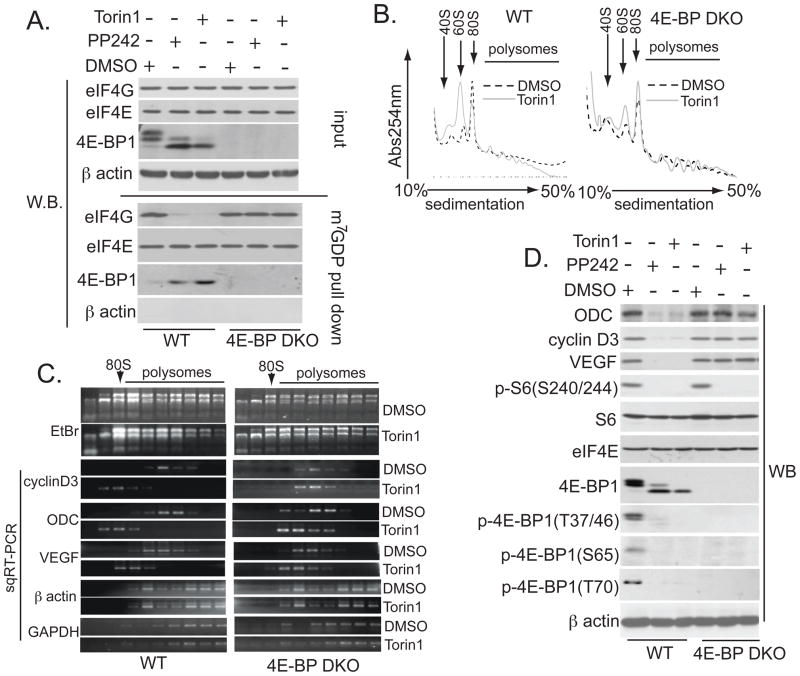
mTOR promotes cell proliferation through enhanced translation of a subset of mRNAs referred to as “eIF4E-sensitive” (2). Thus, the resistance of 4E-BP DKO cells to asTORi may be due to their inability to suppress the formation of eIF4F complexes, which is required for the translation of mRNAs needed for cell proliferation. We treated wild-type and 4E-BP DKO MEFs with asTORi and assessed eIF4F complex formation. Equal amounts of eIF4E were associated with N7-methyl-guanosine diphosphate (m7GDP) in the absence or presence of asTORi (Fig. 4A). asTORi impaired eIF4F complex formation in wild-type MEFs, as judged by the increase in 4E-BP1 binding to m7GDP and the corresponding decrease in eIF4G binding, but not in 4E-BP DKO MEFs (Fig. 4A); this finding demonstrated that the inhibition of eIF4F assembly by asTORi is largely mediated by 4E-BPs. Torin1 impaired translation to a greater extent in wild-type than in 4E-BP DKO MEFs, as illustrated by an increase of 40S and 60S ribosomal subunits and a decrease in polysomes (Fig. 4B), and strongly reduced polysome loading of eIF4E-sensitive ornithine decarboxylase (ODC), cyclin D3, and vascular endothelial growth factor (VEGF) mRNAs (14, 15) in wild-type MEFs, but only slightly in 4E-BP DKO MEFs (Fig. 4C). Torin1 had no effect on transcription or mRNA export, as judged by the unaltered cytoplasmic levels of cyclin D3, VEGF, and ODC mRNAs (Fig. S7A), and it specifically inhibited ribosome recruitment of eIF4E-sensitive mRNAs, as it had no impact on the polysome loading of eIF4E-insensitive β actin and glyceraldehyde 3-phosphate dehydrogenase (GAPDH) mRNAs (Fig. 4C). The amounts of cyclin D3, VEGF, and ODC proteins were reduced to a greater extent by asTORi in wild-type than in 4E-BP DKO MEFs, whereas asTORi had no effect on eIF4E-insensitive S6, eIF4E, and β actin proteins (Fig. 4D). Thus, in the absence of 4E-BPs, asTORi failed to suppress translation of eIF4E-sensitive mRNAs required for cell proliferation.
Fig. 4. asTORi inhibit translation of mRNAs encoding proliferation-promoting proteins via 4E-BPs.
(A) WT and 4E-BP DKO MEFs treated for 24 hours with 2.5 μM PP242, 250 nM Torin1, or vehicle (DMSO) were subjected to m7GDP pull-down. Amounts of the indicated proteins in the input (10%) or pull-down (25%) were determined by Western blotting. β actin served as a loading control (input) and to exclude contamination (m7GDP pull-down). (B) Absorption profiles of ribosomes from WT and 4E-BP DKO cells treated for 24 hours with 250 nM Torin1, or vehicle (DMSO). 40S and 60S denote the corresponding ribosomal subunits; 80S, monosome. (C) RNA was visualized by ethidium bromide (EtBr). Distribution of cyclin D3, VEGF, ODC, β actin, and GAPDH mRNAs was determined by semiquantitative reverse transcription polymerase chain reaction (sqRT-PCR). The RT-PCR reactions were in the linear range (fig. S7I). (D) WT and 4E-BP DKO MEFs were treated as in (A), and the amount of the indicated proteins was determined by Western blotting. β actin served as a loading control.
To ascertain whether asTORi’s inhibition of translation of eIF4E-sensitive mRNAs is dependent on the 4E-BP phosphorylation status, we expressed wild-type, 4Ala, or Δ4EBS 4E-BP1 (16, 17) in 4E-BP DKO MEFs. 4Ala 4E-BP1 has all its mTORC1-sensitive phosphorylation sites mutated to alanines and it constitutively binds to eIF4E (18). Δ4EBS 4E-BP1 does not bind to eIF4E, but is phosphorylated by mTORC1, albeit to a lesser extent than the wild-type 4E-BP1 (18, 19), fig. S7B). Expression of 4Ala 4E-BP1 impaired eIF4F complex formation (fig. S7C), decreased abundance of ODC, cyclin D3, and VEGF (fig. S7B), slowed proliferation rates (fig. S7D), and reduced G1/S progression (fig. S7E). Although Torin1 completely inhibited phosphorylation of wild-type 4E-BP1 and Δ4EBS 4E-BP1, only cells expressing wild-type 4E-BP1 exhibited decreased eIF4F complex assembly (fig. S7C), lower abundance of ODC, cyclin D3 and VEGF (fig. S7B), reduced proliferation rates (fig. S7D), and slower cell cycle progression (fig. S7E). Torin1 inhibited mTORC1 signalling equivalently in all cell lines (fig. S7B). Expression of wild-type and 4E-BP1 mutants had no major effect on cell size or the ability of Torin1 to reduce it (fig. S7F).
Finally, it is known that mTOR signaling is frequently dysregulated in cancer (20, 21) and 4E-BPs can act as tumor suppressors (22, 23). Consistent with these observations, asTORi reduced the number and size of colonies formed by E1A and Ras transformed wild-type MEFs, a response that was strongly attenuated in 4E-BP DKO MEFs (fig. S7, G and H). These data support the argument that the anti-tumorigenic effects of asTORi are in part dependent on the binding of nonphosphorylated 4E-BPs to eIF4E and suggest that malignant cells may progress through the cell cycle independently of a cell-size checkpoint by inactivating 4E-BPs.
In Drosophila, dS6K and d4E-BP have overlapping roles, in which both proteins influence cell growth and proliferation (24, 25). Our results indicate that 4E-BPs mediate mTORC1 effects to promote cell proliferation, but not growth, in mammalian cells, bolstering the theory that mammals evolved separate mechanisms to regulate cell proliferation and growth (12, 26).
Supplementary Material
Acknowledgments
Rapamycin was from LC laboratories and Calbiochem, PP242 was from Intellikine, and Torin1 was from N. Gray and D. Sabatini. Experimental procedures are described in the supplementary material. We thank M. Pende for S6K1CA construct; M. Holcik and N. Colburn for antibody to PDCD4; K. Shokat, C. Rommel, L. W. Ler, S. Fumagalli, and M. Livingstone for advice; C. Lister and P. Kirk for assistance; and M. Daston for editing. Supported by a grant from the Canadian Cancer Society and a Howard Hughes Medical Institute international research scholarship (N.S.); a Terry Fox Foundation research studentship (R.J.O.D.); NIH Mouse Models for Human Cancer Consortium grant U01 CA84292-06 (N.S., G.T., and S.C.K.); a Leukemia and Lymphoma Society special fellowship (I.T.); Canadian Institutes of Health Research and Alberta Heritage Foundation for Medical Research postdoctoral fellowships (T.A.); a Natural Sciences and Engineering Research Council of Canada predoctoral fellowship (M.B.); a CIHR consortium training fellowship award (B.D.F.); the Research Participation Program at the Air Force Research Laboratory, Human Effectiveness Directorate, Bioscience and Protection, Wright-Patterson AFB, administered by the Oak Ridge Institute for Science and Education (A.S.); NIH grants R01 DK73802 and P50 NS057531 (G.T. and S.C.K.); and the John and Gladys Strauss Chair in Cancer Research (G.T.). G.T. is a paid consultant for Novartis Oncology. There are MTAs or patents restricting use of materials listed, described as: PP242 and Torin1.
References
- 1.Guertin DA, Sabatini DM. Cancer Cell. 2007 Jul;12:9. doi: 10.1016/j.ccr.2007.05.008. [DOI] [PubMed] [Google Scholar]
- 2.Hay N, Sonenberg N. Genes Dev. 2004 Aug 15;18:1926. doi: 10.1101/gad.1212704. [DOI] [PubMed] [Google Scholar]
- 3.Pause A, et al. Nature. 1994 Oct 27;371:762. doi: 10.1038/371762a0. [DOI] [PubMed] [Google Scholar]
- 4.Choo AY, Blenis J. Cell Cycle. 2009 Feb 15;8:567. doi: 10.4161/cc.8.4.7659. [DOI] [PubMed] [Google Scholar]
- 5.Hara K, et al. Cell. 2002 Jul 26;110:177. doi: 10.1016/s0092-8674(02)00833-4. [DOI] [PubMed] [Google Scholar]
- 6.Um SH, D’Alessio D, Thomas G. Cell Metab. 2006 Jun;3:393. doi: 10.1016/j.cmet.2006.05.003. [DOI] [PubMed] [Google Scholar]
- 7.Wullschleger S, Loewith R, Hall MN. Cell. 2006 Feb 10;124:471. doi: 10.1016/j.cell.2006.01.016. [DOI] [PubMed] [Google Scholar]
- 8.Feldman ME, et al. PLoS Biol. 2009 Feb 10;7:e38. doi: 10.1371/journal.pbio.1000038. [DOI] [PMC free article] [PubMed] [Google Scholar]
- 9.Garcia-Martinez JM, et al. Biochem J. 2009 Apr 29; [Google Scholar]
- 10.Thoreen CC, et al. J Biol Chem. 2009 Mar 20;284:8023. doi: 10.1074/jbc.M900301200. [DOI] [PMC free article] [PubMed] [Google Scholar]
- 11.Favata MF, et al. J Biol Chem. 1998 Jul 17;273:18623. doi: 10.1074/jbc.273.29.18623. [DOI] [PubMed] [Google Scholar]
- 12.Ohanna M, et al. Nat Cell Biol. 2005 Mar;7:286. doi: 10.1038/ncb1231. [DOI] [PubMed] [Google Scholar]
- 13.Le Bacquer O, et al. J Clin Invest. 2007 Feb;117:387. doi: 10.1172/JCI29528. [DOI] [PMC free article] [PubMed] [Google Scholar]
- 14.De Benedetti A, Graff JR. Oncogene. 2004 Apr 19;23:3189. doi: 10.1038/sj.onc.1207545. [DOI] [PubMed] [Google Scholar]
- 15.Graff JR, Konicek BW, Carter JH, Marcusson EG. Cancer Res. 2008 Feb 1;68:631. doi: 10.1158/0008-5472.CAN-07-5635. [DOI] [PubMed] [Google Scholar]
- 16.Gingras AC, et al. Genes Dev. 1999 Jun 1;13:1422. doi: 10.1101/gad.13.11.1422. [DOI] [PMC free article] [PubMed] [Google Scholar]
- 17.Rong L, et al. Rna. 2008 Jul;14:1318. doi: 10.1261/rna.950608. [DOI] [PMC free article] [PubMed] [Google Scholar]
- 18.Tee AR, Tee JA, Blenis J. FEBS Lett. 2004 Apr 23;564:58. doi: 10.1016/S0014-5793(04)00313-8. [DOI] [PubMed] [Google Scholar]
- 19.Wang X, Beugnet A, Murakami M, Yamanaka S, Proud CG. Mol Cell Biol. 2005 Apr;25:2558. doi: 10.1128/MCB.25.7.2558-2572.2005. [DOI] [PMC free article] [PubMed] [Google Scholar]
- 20.Ruggero D, Pandolfi PP. Nat Rev Cancer. 2003 Mar;3:179. doi: 10.1038/nrc1015. [DOI] [PubMed] [Google Scholar]
- 21.Sabatini DM. Nat Rev Cancer. 2006 Sep;6:729. doi: 10.1038/nrc1974. [DOI] [PubMed] [Google Scholar]
- 22.Petroulakis E, et al. Cancer Cell. 2009 Nov 6;16:439. doi: 10.1016/j.ccr.2009.09.025. [DOI] [PubMed] [Google Scholar]
- 23.Kim YY, et al. Cancer Res. 2009 Nov 1;69:8455. doi: 10.1158/0008-5472.CAN-09-1923. [DOI] [PMC free article] [PubMed] [Google Scholar]
- 24.Miron M, et al. Nat Cell Biol. 2001 Jun;3:596. doi: 10.1038/35078571. [DOI] [PubMed] [Google Scholar]
- 25.Montagne J, et al. Science. 1999 Sep 24;285:2126. doi: 10.1126/science.285.5436.2126. [DOI] [PubMed] [Google Scholar]
- 26.Conlon I, Raff M. J Biol. 2003;2:7. doi: 10.1186/1475-4924-2-7. [DOI] [PMC free article] [PubMed] [Google Scholar]
Associated Data
This section collects any data citations, data availability statements, or supplementary materials included in this article.


