

Abstract
Mutually-complementary, self-repulsive oligopeptide pairs were designed to co-assemble into viscoelastic hydrogels. Peptide engineering was combined with biophysical techniques to investigate the effects of temperature on the structural and mechanical properties of the resulting hydrogels. Biophysical characterizations, including dynamic rheometry, small-angle X-ray scattering (SAXS) and fluorescence spectroscopy, were used to investigate hydrogelation at the bulk, fiber, and molecular levels, respectively. It has been found that temperature have a significant effect on the structure and mechanical properties of peptide-based biomaterials. Oligopeptide fibers assembled at 25°C are formed faster and are twice thicker and the resulting material is mechanically 7-times stronger than that assembled at 5°C.
Keywords: hydrogels, oligopeptides, viscoelasticity, dynamic rheometry, small-angle X-ray scattering (SAXS), fluorescence, anisotropy
Introduction
Soft and wet biomaterials often need to be assembled in the presence of proteins, nucleic acids1 and cells.2 In the past decade, self-assembling oligopeptides3,4 have attracted due attention from various research groups for their widely recognized potential in biomedical applications.5,6 Hydrogels are of particular interest as they possess promising properties for tissue engineering and repair,7,8 and as potential vehicles for hydrophobic drug delivery.8,9 Thus, it is highly desirable to have biomaterials assembled under mild, near physiological conditions. Extreme pH, temperature, ionic strength as well as UV light, free radicals and toxic catalysts should be avoided as much as possible during assembly. This requirement creates a unique challenge for the design and manufacture of biomaterials. On the other hand, mechanical properties are also an important consideration in designing biomaterials. Fine adjustments of material elasticity are of special importance for drug delivery as well as for regenerative medicine, as it has been shown to affect the process of cell differentiation.6
Previously, we reported mixing-induced hydrogelation conducted under physiological pH, ionic strength and ambient temperature.10,11 These hydrogels were assembled from self-repulsive but mutually complementary oligopeptide pairs. The two peptide modules are of equal chain length,12 and the side chains of the charged amino acids in one module bear positive charges while those in another module bear negative charges. Upon mixing, electrostatic interaction between positively and negatively charged peptide molecules drive their co-assembly and results in hydrogelation.10 The advantage of separating positive and negative charges into different modules is that hydrogelation is initiated by mixing two peptide solutions under physiological conditions and thereby maintain the structural integrity of encapsulated proteins within the hydrogel, an essential property for many biological applications of hydrogels.11 Most reports on peptide-based hydrogels are assembled from a single self-complementary peptide, often under non-physiological buffer conditions. For example, temperature (as high as 75°C) has been used to induce the gelation of β-hairpin peptides at pH 9.13
In the present work, gelation is mixing-induced rather than temperature-induced and takes place under physiological buffer conditions. The main goal here is to evaluate the effect of assembling temperature on material structures and properties. To this end, we selected two temperatures most commonly encountered in a laboratory setting: 25°C to represent room temperature and 5°C to represent cold room temperature. Using a combination of dynamic rheology, small-angle X-ray scattering (SAXS) and fluorescence spectroscopy, we demonstrate that, under physiological buffer conditions, elevating the assembly temperature from 5°C to 25°C significantly changes the structure and mechanical properties of hydrogels formed by oligopeptides.
Materials and Methods
Peptide design and synthesis
Positively charged peptide modules with ornithine instead of lysine were used in this study in an effort to increase their aqueous solubility (ornithine has one less -CH2- group than lysine). Also, alanine was used as the neutral amino acid to avoid low aqueous solubility caused by more hydrophobic neutral amino acids such as valine. For the same reason, N-termini of the peptide modules were formylated instead of acetylated (see data on the sequences of oligopeptides in Table 1). To obtain the formylation agent, i.e., 2,4,5-trichlorophenyl formate, 9.0 g of dicyclohexyl carbodiimide and 5.7g 2,4,5-trichlorophenol were added to ice-cold (at 0 °C) mixture of 2 mL of 98% formic acid in 50 mL of ethyl acetate. The reaction mixture was then filtered and sequentially washed with 150 mL of saturated NaHCO3 aqueous solution and then 150 mL of water. The end product was obtained after drying over anhydrous Na2SO4 for 1 hr followed by rotary evaporation (∼96% yield). NMR spectra of the resulting 2,4,5-trichlorophenyl formate did not show the phenolic protons, thus confirming complete conversion of 2,4,5-trichlorophenol to 2,4,5-trichlorophenyl formate.
Table 1.
Sequences of oligopeptides.
| Peptide | Sequences of Charged Peptide Modules | Molecular Weight (Da) | Concentration (for 1% wt/wt) |
|---|---|---|---|
| OAW10 (positive) | formyl-WOAOAOAOAO-amide | 1,086 | 9.2 mM |
| EAW10 (negative) | formyl-WEAEAEAEAE-amide | 1,161 | 8.6 mM |
Modular material assembly is achieved by pairing a positive module with a negative module. A, alanine; E, glutamic acid; O, ornithine; W, tryptophan. Tryptophan acts as a spectroscopic probe to monitor gelation. The N-, C-termini of each peptide were formylated (formyl-) and amidated (-amide), respectively.
Oligopeptides were synthesized using Fmoc solid-phase peptide synthesis14 and formylation of the N-terminus was carried out using a 5-fold excess of 2,4,5-trichlorophenyl formate with the peptide-attached resin under ice-cold conditions for 1 hr. A ninhydrin test for the free amino acid terminus was used to monitor the completion of formylation. After cleavage, with 90 % trifluoroacetic acid and 2.5% each of ethylene dithiol, tri-isopropyl silane, water (as scavengers) and dichloromethane from the resin, oligopeptides were purified by reversed-phase HPLC (Agilent Technologies, HP1100 chromatograph system, Wilmington, DE). The molecular weight for each oligopeptide was verified using MALDI-MS. Purity of the peptides was verified by analytical HPLC. Peptides were dissolved and dialyzed in phosphate-buffered saline (50 mM phosphate + 100 mM NaCl) at pH 7. The pH of each dialyzed peptide solution was verified and, if necessary, adjusted to pH 7. Concentrations of the peptide solutions were determined on the basis of the molar absorptivity of tryptophan at 280 nm (ε280 = 5690 M-1 cm-1).15 All hydrogel measurements were conducted at a total peptide concentration of 1% wt/wt, corresponding to 9.2 mM for OAW10 and 8.6 mM for EAW10.
Dynamic Rheometry
Sample Preparation
1% wt/wt stock solutions of each individual peptide were prepared and equilibrated at room temperature for 25°C experiments or maintained in an ice bath for 5°C experiments. Equal volumes of each of peptide solutions were mixed in a third Eppendorf tube which was pre-equilibrated at room temp (for 25°C experiments) or in an ice bath (for 5°C experiments) and vortexed. The just-mixed sample was immediately transferred into the parallel-plate geometry whose temperature was pre-equilibrated at either 25°C or 5°C.
Rheological Measurements
Dynamic rheological measurements were made using an AR 550 stress-controlled rheometer equipped with a Peltier temperature-control unit, and a 20-mm diameter parallel-plate aluminum geometry with solvent trap (TA Instruments, New Castle, DE) was used. The solvent trap was filled with mineral oil to prevent water evaporation during measurements. All rheological measurements were performed in the following sequence: time-sweep (∼8hrs) → frequency-sweep (∼4hrs) → strain-sweep (∼4 hrs). Time-sweep measurements were conducted at 0.2% strain amplitude and 1 rad/s angular frequency. After time-sweep measurements, frequency-sweep measurements were conducted at 0.2% strain amplitude and the data were acquired at a log mode with 4 data points per frequency decade. After frequency-sweep measurements, strain-sweep measurements were conducted. A shear modulus G versus strain profile taken at 1 rad/sec angular frequency was analyzed according to previously published procedures.16
Small-Angle X-Ray Scattering (SAXS)
Sample Preparation
Peptide solutions were prepared as for rheological measurements. The just-mixed sample was immediately centrifuged (30 sec at < 2500 rpm) in 1 mm thin-walled (0.001 m) sealed glass capillary fixed in a brass holder (which was also pre-equilibrated depending on the experimental conditions, at the room temperature or on ice) and placed into the sample holder of SAXS instrument which was thermostated at 5°C or 25°C.
SAXS Data Measurements and Analysis of Fiber Matrix
SAXS data were acquired and reduced to I(q) versus q using the small-angle X-ray scattering instrument and procedures described earlier.17 q is the amplitude of the scattering vector, and is calculated as 4π(sin θ)/λ, where 2 θ is the scattering angle and λ is the wavelength of the incident X-ray (Cu-Kα = 1.54 Å). The inverse Fourier transform of I(q) gives the pair distance or vector length distribution function, P(r), for the scattering particle and is calculated using indirect Fourier transform methods.18,19,20 The r value at which P(r) goes to 0 gives the maximum linear dimension for the scattering particle, dmax.
As the hydrogels contain highly elongated particles, the scattering data were subjected to Guinier analysis for rod-shaped objects. Roll-over in the low q region of lnqI(q) vs q2 plot suggests the formation of elongated asymmetrical particles with one dimension of the particle (i.e., length) is much larger than the other (i.e., diameter).
More detailed modeling of the cross-sectional shape used a simulated annealing algorithm implemented in a purpose written program that is described elsewhere21 and is a 2D implementation of the 3D spherical dummy atom modeling of Svergun.22 For the gel formed at 5 °C, dummy atoms were arranged in a grid with 25 × 105 dummy atoms, with each dummy atom being 3 Å in diameter. To decrease the simulation time for the more extensive gel formed at 25 °C since the cross-section of this gel appeared to be much larger as compared to the gel formed at 5°C, a grid with 30 × 110 dummy atoms was used, with each dummy atom being 5 Å in diameter. The program evaluates the pair distance distribution function for the cross-section (Pc(r)) from which the corresponding scattering profile is calculated. In the optimization procedure, the program then minimizes the discrepancy between this calculated scattering profile and the experimental scattering profile (i.e., I(q) vs q). Corrections for the instrument slit geometry, scaling and incoherent background are also applied when the calculated scattering profile is compared with experimental scattering data.
Fluorescence Spectroscopy
Sample Preparation
Peptide solutions were prepared as described for the rheological experiments. The just-mixed samples were immediately transferred to quartz cuvettes that were pre-equilibrated in an ice bath or at room temperature and fixed in the cuvette holder of the fluorometer which was maintained at 5°C or 25°C.
Steady-State Fluorescence Measurements and Data Analysis
Steady state fluorescence spectra were obtained using a Varian Cary Eclipse Spectrofluorometer (Varian Inc.) equipped with a Peltier temperature-control unit in 1 mm × 10 mm quartz cuvettes. The short path length for excitation (1mm) and long path length (10 mm) for emission were chosen to avoid absorption of the excitation light and to minimize interference from Raman scattering. Samples were excited at 300 nm, and the emission spectra were collected at 90° to the excitation over a range of 305 nm to 450 nm with 5-nm excitation and emission slits. For fluorescence intensity and anisotropy measurements, vertically oriented excitation polarizer and both vertical (IVV) and horizontal (IVH) positions for emission polarizer were used. Isotropic fluorescence intensity at time t, Iiso(t), corresponding to the intensity observed with the polarizer orientation of 54.7° (magic angle) was calculated using
| (1) |
To average out intensity fluctuation (instrumental noise) during measurement, we define normalized cumulative signal intensity Icum as:
| (2) |
Icum is used as the parameter for monitoring gelation. Icum reflects time-dependent tryptophan fluorescence intensity change induced by the gelation process. Here, λ is the wavelength of tryptophan emission. Iiso(λ, t = 0) is obtained from emission intensity of individual peptide modules as:
| (3) |
Iiso(λ,OAW10) and Iiso(λ,EAW10) refer to tryptophan emission intensity of unmixed positive (OAW10) and negative (EAW10) modules, respectively. Raman scattering is minimized by using 1 mm thick cuvette. To exclude Rayleigh scattering (significant for the gel form), the averaging is performed from 330 nm (λ1) to 395 nm (λ2).
Fluorescence anisotropy23 r for vertically polarized excitation light is defined as:
| (4) |
where, IVV and IVH are vertically and horizontally polarized fluorescence intensities, respectively; g is the correction factor that characterizes relative sensitivity of fluorescence detection channel (detection optics, monochromator, and detector) to vertically and horizontally polarized light. Again, to exclude instrumental fluctuations, the average anisotropy at a given time point of gelation process, <r>, is calculated over the wavelength range as
| (5) |
Here, the Rayleigh scattering interference at short emission wavelengths is also excluded from calculations of the average anisotropy. The wavelength range chosen is the same as for the intensity integration, the averaging takes place over the range from 330 nm (λ1) to 395 nm (λ2).
Results and Discussion
The hydrogels were assembled by mixing 1 % wt/wt of positively-charged OAW10 peptide solution and 1 t% wt/wt negatively-charged EAW10 peptide solution at 5°C and 25°C (see data on the sequences of oligopeptides in Table 1).
In terms of mechanical properties, the rheological data (Figure 1) show that at 5°C there is ∼1 hr delay for the initiation of gelation, after which the elastic modulus (G′) of the hydrogel increases slowly and reaches a plateau by ∼8 hr, whereas, at 25°C, the onset of gelation is immediate and G′ reaches a plateau within ∼1 hr (Figure 1A). A similar delay at 5°C is observed for the decrease of phase angle, δ, an indicator of the viscoelasticity of hydrogels (Figure 1B). The phase angle, defined as δ = arctan(G″/G′), provides a measure of viscoelasticity of the gel with δ = 0° indicating an elastic solid and δ = 90° indicating a viscous liquid. At both 5°C and 25°C, the stabilized phase angle is about 3°, indicative of a solid-like material. In addition to faster gelation, the 25°C gel also has a 7-fold higher plateau G′ value than the 5°C gel. This result becomes even more interesting in light of the fact that substitution of all five Ala with Val does not produce any significant difference in the plateau G′ value or other bulk mechanical properties.10
Figure 1.

Dynamic rheological measurements of hydrogels assembled at 25°C (black) and 5°C (green). Time-sweep measurements (A) and (B); frequency-sweep (C) and strain-sweep (D) measurements. For comparison, the plot in (C) also shows the plateau G′ and G″ values from time-sweep experiments at 1 rad/sec angular frequency from plot (A); closed diamonds show G′ for 25°C (black) and 5°C (green), and open diamonds show G″ for 25°C (black) and 5°C (green). For comparison, solid diamonds in plot (D) also show the plateau G value from time-sweep experiments from plot (A) at 0.2% strain amplitude for gels formed at 25°C (black) and 5°C (green). G′, G″, δ and G are the elastic modulus, viscous modulus, phase angle and shear modulus , respectively.
While the elastic modulus, G′, of both the 5°C gel and the 25°C gel has little frequency-dependency, the viscous modulus, G″, shows greater variation with frequency, especially for the 25°C gel (Figure 1C). Strain-sweep measurements revealed that the 5°C gel is more brittle in comparison to the 25°C gel with yield strain values of 0.2% and 0.8% at 5°C and 25°C, respectively (Figure 1D). Of note, the diamonds in Figure 1C show the plateau values of G′ and G″ observed in time-sweep experiments at corresponding temperatures. Also, in Figure 1D, the diamonds show the plateau value of G detected in time-sweep experiments at corresponding temperatures. These data confirm that at both temperatures, the hydrogels have reached their final plateau values of viscoelastic moduli within ∼ 8 hours.
Fiber morphology probed by SAXS24,25 shows similar temperature effect on gelation kinetics. At 25°C, the scattering intensity, I(q), increases immediately after mixing (Figure 2A). In contrast, at 5°C, I(q) does not increase within the first 1 hr after mixing (Figure 2B), indicating the absence of larger aggregates forming during this period. Consistent with the rheological results, at 25°C, increases in I(q) are not observed after 8 hours of gelation while at 5°C, I(q) continues to increase after 8 hours. In agreement with rheological data, the SAXS data indicate that the gelation is faster at 25°C than at 5°C.
Figure 2.
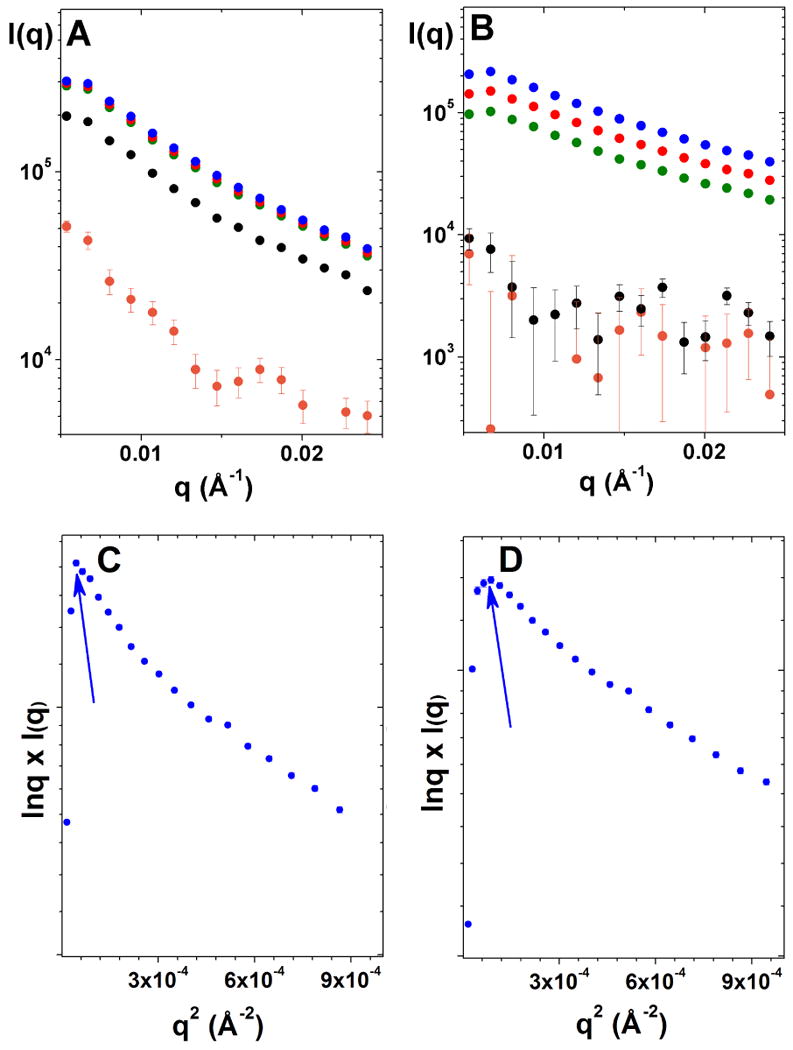
Small angle X-ray scattering of hydrogels at 25°C (A) and 5°C (B)—15 min, orange; 1 hr, black; 5 hr, green; 8 hr, red; 24 hr, blue; and Guinier plots for elongated particles as lnqI(q) vs q2 after 24 hours of gelation: (C) 25°C; (D) 5°C. Arrows show the roll-over position on Guinier plots. q is a scattering length ; I(q) is a scattering intensity.
Guinier analysis in the form of lnqI(q) vs q2 plots for the hydrogels formed at 25°C and 5°C after 24 hr were each linear with a distinctive roll-over at q2 < 10-4 Å-2, as expected for highly asymmetric, elongated particles of finite length (Figure 2C and 2D, respectively). Accurate measurement of the average fiber length is beyond the range of the SAXS instrument (its minimum measurable q-value is 0.006 Å-1, which corresponds to a maximum measurable fiber length of ∼600 Å). Nonetheless, SAXS data are informative of fiber cross-section dimensions. The cross-sectional pair wise distance distribution function (Pc(r)) is narrower at 5°C than at 25°C (Figure 3) with a correspondingly smaller maximum dimension of the cross-section, dmax (300 Å at 5°C vs. 525 Å at 25°C). The inset of Figure 3 shows the general features of fiber cross-sections at 5°C and 25°C obtained from a 2D-dummy atom modeling routine,21 demonstrating that the fibers formed at 25°C are thicker and appear to have a more complex internal structure in the cross-section.
Figure 3.

Pair-wise distance distribution function (Pc(r)) of the cross-section of fibers formed at 25°C (black) and 5°C (green). Inset represents 2-D dummy atom models of fiber cross-sections.
At the molecular level, the isotropic intensity Iiso and the anisotropy r of tryptophan fluorescence emission decreases and increases, respectively, upon gelation, consistent with the formation of higher order aggregates (Figure 4).23 The cumulative tryptophan emission intensity (Icum; 330-395 nm) decreases immediately after mixing at 25°C while at 5°C, the decrease of Icum is delayed for ∼1 hr (Figure 5A). Also, Icum for the 5°C gel reaches a plateau in about 7 hr whereas that for the 25°C gel reaches a plateau in about 2 hr, in agreement with the time-course of G′ values. Steady-state average fluorescence anisotropy (<r>; 330-395 nm) measurements shows distinct assembly patterns for oligopeptides at 5°C and 25°C (Figure 5B). At 5°C, there is no significant increase in <r> until 1 hr, after which it rises steadily from 0.06 to 0.09 in about 5-6 hr. In contrast at 25°C, <r> rises swiftly from 0.02 to 0.1 and then drops back to 0.07, all within the first hour of mixing. Hence, the time-courses of Icum and <r> are in general agreement with gelation kinetics observed by dynamic rheology and SAXS, i.e., gelation initiation at 5°C lags behind that at 25°C by about 1 hr. Further, the initial <r> value of peptides at 5°C (∼0.06) is higher than that at 25°C (∼0.02), indicative of slower rotational diffusion of peptide molecules at lower temperature, consistent with slower initiation of gelation at 5°C, while final equilibrium steady state anisotropy of tryptophan in 5°C gel was significantly higher than in 25°C gel, as it represents the global movement of tryptophan in the assembled fiber (Figure 5B).
Figure 4.

Isotropic fluorescence intensity (Iiso) decay and tryptophan anisotropy (r) upon the gelation of OAW10:EAW10. (A) and (B) show fluorescence emission spectra at different time points, (A) at 25°C, (B) at 5°C; (C) initial anisotropy immediately after mixing; (D) anisotropy after 24 hrs of gelation; black at 25°C and green at 5°C. Rayleigh scattering was very high at lower wavelengths (below 315 nm).
Figure 5.

Steady-state cumulative tryptophan fluorescence intensity Icum (A) and average anisotropy <r> (B) changes in hydrogels formed at 25°C (black) and 5°C (green).
In summary, using techniques ranging from macroscopic to mesoscopic to nano-scale, this study demonstrates that temperature during assembly exerts significant effects not only on gelation kinetics, but also on the mechanical properties and the underlying structure of the resulting hydrogel assembled from a pair of oligopeptides. Whether faster kinetics is concomitant with or the cause of thicker fibers and stronger gels is not clear. However, hydrophobic interaction, which becomes stronger at higher temperature,26 is another possible contributing factor to thicker fibers and stronger gels. Here, we wish to put the present study in the broader context of peptide assembly at different temperatures. First, corresponding to our observation that, in mixing-induced gelation of mutually-complementary peptide pair, a hydrogel becomes stronger at higher temperature, it has been previously observed that, in temperature-induced gelation of a self-complementary peptide, the gelation temperature increases upon hydrophobicity reduction.13 Second, corresponding to our observation that, in mixing-induced gelation of mutually-complementary peptide pair, the peptide fibers becomes thicker as assembly temperature changes from 5°C to 25°C, it has been previously observed that in the yeast prion protein Sup35, the protected stable region of peptide fibers is almost doubled when the incubation temperature changes from 4°C to 37°C.27 The picture emerging from these studies is that temperature has considerable impact on the assembly of peptides.
Conclusions
Rheological, SAXS and fluorescence studies on the gelation of mutually-attractive, self-repulsive peptide pairs at 1% wt/wt total peptide concentration has shown that the onset or initiation of gelation and subsequent co-assembly kinetics at 25°C was significantly faster than at 5°C. Faster onset of gelation at higher temperatures also affects the structural and mechanical properties of the resulting gel. The gel formed at 25°C is mechanically 7-times stronger than the gel formed at 5°C. The underlying fibers formed at 25°C are twice as thick as the fibers formed at 5°C.
Supplementary Material
Acknowledgments
This work is supported by National Institutes of Health under grant EB004416 (Y.B.Y.) and by an Australian Federation Fellowship and U. S. Department of Energy, Office of Science Grant No. DE-FG02-05ER64026 (J.T.). The authors thank Kavita M. Gupta for her help with the operation of AR 550 stress controlled rheometer.
Footnotes
Supporting Information Available. 1H NMR spectrum of the formylation reagent (Figure S1); and full scattering profiles I(q) versus q for the peptide pair under study at both temperatures (Figure S2). This material is available free of charge via the Internet at http://pubs.acs.org.
References
- 1.Kiyonaka S, Sada K, Yoshimura I, Shinkai S, Kato N, Hamachi I. Nature Mater. 2004;3:58–64. doi: 10.1038/nmat1034. [DOI] [PubMed] [Google Scholar]
- 2.Kasiday J, Jin M, Kurz B, Hung H, Semino C, Zhang S, Grodzinsky AJ. Proc Natl Acad Sci USA. 2002;99:9996–10001. doi: 10.1073/pnas.142309999. [DOI] [PMC free article] [PubMed] [Google Scholar]
- 3.Rajagopal K, Ozbas B, Pochan DJ, Schneider JP. Eur Biophys J. 2006;35:162–169. doi: 10.1007/s00249-005-0017-7. [DOI] [PubMed] [Google Scholar]
- 4.Hule RA, Nagarkar RP, Altunbas A, Ramay HR, Branco MC, Schneider JP, Pochan DJ. Faraday Discuss. 2008;139:251–264. doi: 10.1039/b717616c. [DOI] [PMC free article] [PubMed] [Google Scholar]
- 5.Fairman R, Akerfeldt KS. Curr Opin Struct Biol. 2005;15:453–463. doi: 10.1016/j.sbi.2005.07.005. [DOI] [PubMed] [Google Scholar]
- 6.Mitragori S, Lahann J. Nature Mater. 2009;8:15–25. doi: 10.1038/nmat2344. [DOI] [PMC free article] [PubMed] [Google Scholar]
- 7.Holmes TC. Trends Biotechnol. 2002;20:16–21. doi: 10.1016/s0167-7799(01)01840-6. [DOI] [PubMed] [Google Scholar]
- 8.Ramachandran S, Yu YB. BioDrugs. 2006;20:263–269. doi: 10.2165/00063030-200620050-00001. [DOI] [PubMed] [Google Scholar]
- 9.Keyes-Baig C, Duhamel J, Fung SY, Bezaire J, Chen P. J Am Chem Soc. 2004;126:7522–7532. doi: 10.1021/ja0381297. [DOI] [PubMed] [Google Scholar]
- 10.Ramachandran S, Tseng Y, Yu YB. Biomacromolecules. 2005;6:1316–1321. doi: 10.1021/bm049284w. [DOI] [PMC free article] [PubMed] [Google Scholar]
- 11.Ramachandran S, Flynn P, Tseng Y, Yu YB. Chem Mater. 2005;17:6583–6588. [Google Scholar]
- 12.Ramachandran S, Trewhella J, Tseng Y, Yu YB. Chem Mater. 2006;18:6157–6162. [Google Scholar]
- 13.Pochan DJ, Schneider JP, Kretsinger J, Ozbas B, Rajagopal K, Haines L. J Am Chem Soc. 2003;125:11802–11803. doi: 10.1021/ja0353154. [DOI] [PubMed] [Google Scholar]
- 14.Chan WC, White PD. Fmoc Solid Phase Peptide Synthesis: A Practical Approach. Oxford University Press; New York: 2000. pp. 1–75. [Google Scholar]
- 15.Gill SC, von Hippel PH. Anal Biochem. 1989;182:319–326. doi: 10.1016/0003-2697(89)90602-7. [DOI] [PubMed] [Google Scholar]
- 16.Tseng Y, An KM, Esue O, Wirtz D. J Biol Chem. 2004;279:1819–1826. doi: 10.1074/jbc.M306090200. [DOI] [PubMed] [Google Scholar]
- 17.Heidorn DB, Trewhella J. Biochemistry. 1988;27:909–915. doi: 10.1021/bi00403a011. [DOI] [PubMed] [Google Scholar]
- 18.Svergun DI, Semenyuk AV, Feigin LA. Acta Cryst. 1988;A44:244–250. [Google Scholar]
- 19.Svergun DI. J Appl Cryst. 1991;24:485–492. [Google Scholar]
- 20.Svergun DI. J Appl Cryst. 1992;25:495–503. [Google Scholar]
- 21.Whitten AE, Jeffries CM, Harris SP, Trewhella J. Proc Natl Acad Sci USA. 2008;105:18360–18365. doi: 10.1073/pnas.0808903105. [DOI] [PMC free article] [PubMed] [Google Scholar]
- 22.Svergun DI. Biophys J. 1999;76:2879–2886. doi: 10.1016/S0006-3495(99)77443-6. [DOI] [PMC free article] [PubMed] [Google Scholar]
- 23.Lakowicz JR. Principles of Fluorescence Spectroscopy. 3rd. Chapter 16: Protein Fluorescence Springer; New York: 2006. [Google Scholar]
- 24.Glatter O, Kratky O, editors. Small Angle X-Ray Scattering. Academic Press; London: 1982. [Google Scholar]
- 25.Guinier A. Ann Phys. 1939;12:161–237. [Google Scholar]
- 26.Makhatadze GI, Privalov PL. Adv Protein Chem. 1995;47:307–425. doi: 10.1016/s0065-3233(08)60548-3. [DOI] [PubMed] [Google Scholar]
- 27.Toyama BH, Kelly MJS, Gross JD, Weissman JS. Nature. 2007;449:233–237. doi: 10.1038/nature06108. [DOI] [PubMed] [Google Scholar]
Associated Data
This section collects any data citations, data availability statements, or supplementary materials included in this article.