Abstract
Delayed matching to sample is typically a two-alternative forced-choice procedure with two sample stimuli. In this task the effects of varying the probability of reinforcers for correct choices and the resulting receiver operating characteristic are symmetrical. A version of the task where a sample is present on some trials and absent on others is analogous to a yes/no recognition task. We describe data from two experiments where an asymmetry in performance in the yes/no task could be attributed to a change in response bias with increasing retention-interval duration from a matching-law perspective, but not from a signal-detection perspective. Both approaches make explicit assumptions about response bias. The apparent inconsistency between the two approaches to the treatment of response bias is resolved in terms of a model proposed by K. G. White and J. T. Wixted (1999) which predicts asymmetrical matching-law functions and receiver operating characteristics without making any assumptions about response bias.
Keywords: remembering, two-alternative forced-choice procedure, yes/no recognition procedure, matching law, signal detection, asymmetrical remembering, delayed matching to sample, pigeons
Psychophysics began well over a century ago in an endeavor to measure an individual's ability to detect near-threshold stimuli. At an early stage, psychophysicists recognized the influence of response bias—a tendency to say “yes” unrelated to sensory factors. Early studies included “catch trials” where there was no stimulus present so that false alarms (incorrect ‘yes’ responses) could be recorded, and a measure of accuracy could be calculated by correcting the proportion of accurate responses, or hit rate, by the false alarm rate (Egan & Clark, 1966). The classic correction-for-guessing measure, p = (hit rate)/(1- false alarm rate), is still in use, and makes use of responses on both trials when the stimulus was present and on catch trials when it was absent. Thus an important contribution of psychophysics over the last 100 years was the recognition that performance is influenced by response bias, and that accuracy measures can be derived to take account of (and to be independent of) bias.
In the present article we discuss the treatment of response bias in nonhuman remembering, particularly delayed matching to sample. We consider analyses in terms of the modern psychophysical approach (signal detection theory), behavioral approaches based on the matching law, and our own theory which blends the two (White & Wixted, 1999; Wixted & Gaitan, 2002). We do this in the context of two methods used to measure detection and recognition, the Yes/No procedure and the Two-Alternative Forced-Choice (2AFC) procedure (Jang, Wixted, & Huber, 2009). The signal detection and matching law approaches differ in their assumptions about bias, whereas our own model makes no assumptions about bias but can predict it.
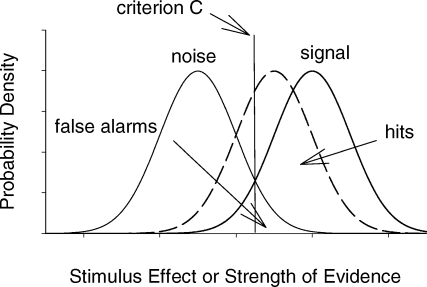
Signal-detection theory was developed to allow the separate measurement of detectability and response bias (Green & Swets, 1966; Macmillan & Creelman, 2005). Figure 1 illustrates the two main assumptions of the theory. First, stimuli vary in their effect from instance to instance. The variation is described by a Gaussian distribution along a dimension of stimulus effect, often described as the evidence variable. The simplest case involves two distributions, one for trials with a signal (technically signal plus noise), and the other for trials without a signal (noise trials). These two distributions are shown in Figure 1 as solid curves.
Fig. 1.
Probability density distributions describing the effect of the stimulus on sample absent (noise) and sample present (signal) trials, according to signal detection theory. The dotted function is the sample-present distribution for less discriminable samples.
The second assumption, following decision theory, is that the observer establishes a cutoff point or criterion c somewhere along the stimulus effect dimension. On each trial, the strength of a stimulus has a value x on the stimulus effect dimension. If the value of x is greater than c, the observer reports “yes, the stimulus was present”, otherwise the observer reports “no, the stimulus was not present”. Thus, the placement of c on the evidence axis defines the observer's decision rule (i.e., report “yes” if x > c, otherwise report “no”).
In Figure 1, the area under the signal curve and to the right of c equals the hit rate —the proportion of ‘yes’ responses given that the signal was present. The area under the no-signal curve in Figure 1 and to the right of c gives the false alarm rate—the proportion of ‘yes’ responses given in the absence of the signal. When correct ‘yes’ responses are associated with a high payoff, it pays to move c to the left in order to maximize hits. When c moves to the left, both the hit rate and the false alarm rate will increase (but discriminability will remain unchanged). By contrast, when incorrect ‘yes’ responses are associated with high costs, it pays to use a value of c to the right end of the stimulus effect dimension. When c moves to the right, both the hit rate and the false alarm rate will decrease. Thus, payoffs can be manipulated to influence the observer's decision rule.
The value of c in Figure 1 is placed where the noise and signal distributions intersect, that is, where the likelihood ratio equals 1.0, and there is an equal tendency to say ‘yes’ or ‘no’. When c is to the right of the intersection of the distributions, the signal/noise likelihood ratio is greater than 1.0, and when c is to the left of the intersection of the distributions, the signal/noise likelihood ratio is less than 1.0. Thus the likelihood ratio can be used as a measure of bias, with one common measure being log β (i.e., the log of the ratio of the height of the signal distribution to the height of the noise distribution at the point where c is placed). Under some conditions, the observer's decision rule (i.e., the location of c) and the observer's measured response bias (e.g., log β) are directly related, but under other conditions they are not. The decision rule and measured response bias are directly related when the distributions are fixed and the location of c changes. Under those conditions, any change in the location of c entails a corresponding change in log β. Under other conditions, however, the decision rule and log β are not related, a point that can be most easily illustrated in context of a memory experiment.
Soon after its advent, signal detection theory was applied to the study of human memory (Murdock, 1965). The same principles were applied as in the study of detection, but the evidence variable was called “memory strength” or “familiarity” (Mickes, Wais, & Wixted, 2009). In recognition paradigms, the observer is required to distinguish words previously seen on a list (old words) from words not previously seen on the list (new words). The signal distribution in this case represents the memory strengths of the old words, and the noise distribution represents the memory strengths of the new words. In this yes/no procedure, a decrease in the memorability of the old words might occur with a long retention interval. This decrease moves the signal distribution to the left (dotted-line distribution in Figure 1), thus decreasing the hit rate. If decreasing the mean strength of the signal distribution is the only effect of the memorability manipulation, the criterion c does not move—that is, the observer's decision rule does not change—and the location of the noise distribution does not move. As such, the false alarm rate remains constant. Because the signal distribution does move leftward (reflecting the decreased memorability of the old words), the hit rate selectively decreases. An important point to make about this situation is that although the location of c (i.e., the observer's decision rule) does not change, log β (i.e., measured bias) does. Thus, a change in log β does not necessarily imply a change in the observer's decision rule (Wixted & Stretch, 2000). Instead, log β provides a descriptive indication of the location of the decision criterion relative to the point where the height of the two distributions is equal. Log β equals 0 if it is placed at the point of intersection, but its value will be positive or negative if the location of the criterion is to the right or left of that point. The key point is that its value will change if the location of c changes or, as in this example, the mean strength of the signal distribution changes (with the observer's decision rule remaining constant). This is an important consideration because, as explained later, Log β is conceptually similar to log b, the widely used measure of response bias in the behavioral detection model (Davison & Tustin, 1978).
Wixted (1993) studied remembering in pigeons in a delayed matching-to-sample task analogous to the yes/no procedure. Normally, delayed matching involves the presentation of either of two sample stimuli, red or green, at the beginning of the trial, and a choice between red and green after a delay that varies from trial to trial. Longer delays result in lower accuracy (White, 1985, 2001; Wixted, 1989). By omitting one of the sample stimuli (e.g., red) on the trials when it was otherwise scheduled, the task in Wixted's study was rendered analogous to the yes/no recognition task in human memory studies. On some trials the green sample was presented for 5 s at the beginning of the trial, and on others, the sample was replaced by a 5-s dark period and the dark intertrial interval continued through to the dark delay before the choice stimuli were presented.
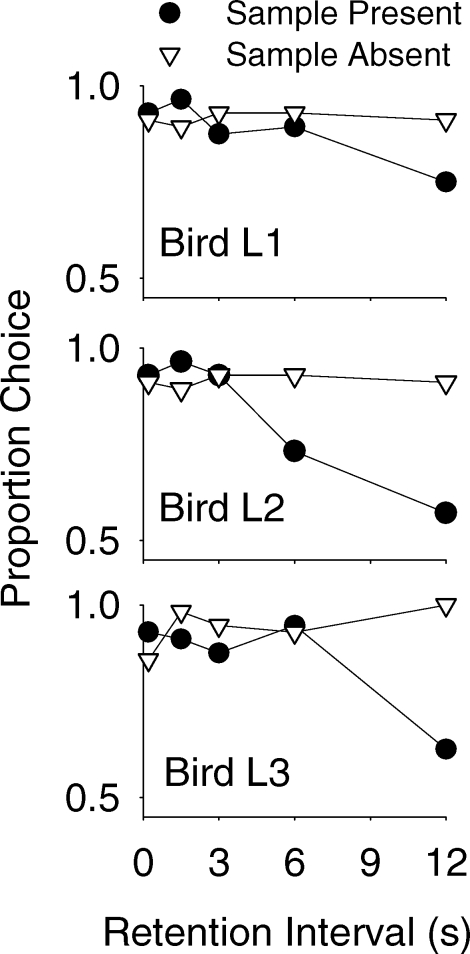
When Wixted (1993) plotted proportion of correct choices as a function of delay (manipulated within session), correct choices of green on sample present (or signal trials) decreased with increasing duration of the delay and correct choices of red on sample absent (or noise) trials remained at a high and constant level across delay. Figure 2 shows this same result for the 3 pigeons in the present Experiment 1. The result has also been reported by others (Dougherty & Wixted, 1996; Gaitan & Wixted, 2000; Grant, 1991; Weaver, Dorrance, & Zentall, 1999). The model shown in Figure 1 provides one simple interpretation of this result. Specifically, the pigeon's decision rule remains constant (i.e., the location of c does not change), but the mean of the signal distribution decreases with increasing retention interval (and log β changes accordingly). The mean of the noise distribution does not change with delay in this interpretation because no event signals the end of the ITI and the onset of a noise trial. Instead, the delay is a measure of the time since a sample would have been presented had this been a sample trial. Unless the pigeon is timing the ITI and taking explicit note of the fact that the sample did not occur at the expected moment, there is no stimulus effect that would diminish with increasing delay. Instead, in the simplest interpretation, no event occurs on no-signal trials, so the noise distribution and the location of c are independent of delay.
Fig. 2.
Proportion correct choices of green following presentation of the green sample (sample present) and red following no sample (sample absent) in the present Experiment 1.
A different interpretation of the result in Figure 2 is that with increasing duration of the retention interval, there is an increasing response bias to report the absence of the sample. This interpretation is based on a matching-law approach developed by Davison and Tustin (1978) and Nevin (1981). In this account, response bias is measured but no separate assumption is made concerning the observer's decision rule. In addition, stimulus bias is assumed to occur on both trial types. That is, the presentation of the green sample on sample trials biases the bird to choose the green choice alternative (an effect that decreases with increasing delay), and the absence of a sample at the expected moment on no-sample trials biases the bird to choose the red alternative (an effect that also decreases with increasing delay). But if the no-sample effect decreases with delay, why does performance remain constant over delay? The answer must be that a change in response bias exactly offsets the change in stimulus bias.
Response bias in this account is given by the geometric mean of the ratios of choices of one comparison stimulus versus the other following the two sample types (sample and no-sample), and it is similar to the log β measure of signal-detection theory. Specifically, log b = 0.5 log((r1a/r2a)(r1p/r2p)) where the subscripts denote choice responses r1 and r2 following absence (a) and presence (p) of the samples. Because there is an increasing tendency to choose the comparison associated with the absent sample with increasing delay, the ratio of the two choices changes over delays and accordingly the measured bias changes. For the data in Figure 2, the mean bias log b increases from −0.07 at 0-s retention interval to 0.62 at the 12-s retention interval. As noted by Davison and Tustin (1978), response bias captures a tendency to choose one alternative over the other due to extraneous factors (i.e., factors extraneous to the effect of the sample and no-sample events). Thus, the interpretation is that an extraneous factor is changing with delay and causing the bird to become more inclined to choose the no-sample alternative as the delay increases. Moreover, this change in bias occurs at a rate that exactly offsets the decreasing effect of stimulus bias that occurs as delay increases on no-sample trials (such that performance on no-sample trials remains constant as a function of delay).
But does bias actually change across retention interval? The change in the bias measure, log b, is consistent with the signal-detection bias measure, log β, but is not consistent with the simplest signal detection analysis in the sense that the position of the criterion c in Figure 1 does not change when discriminability is decreased (by increasing the delay). That is, according to the account summarized in Figure 1, the bird does not become more inclined or less inclined to choose red over green. Instead, the only change is that the mean of the signal distribution (i.e., the effect of the sample event) decreases as the retention interval increases. Thus, in terms of signal detection theory, the observer's decision rule does not change with increasing delay in the yes/no procedure because the mean of the noise distribution remains at zero and the criterion c is set in relation to the noise distribution.
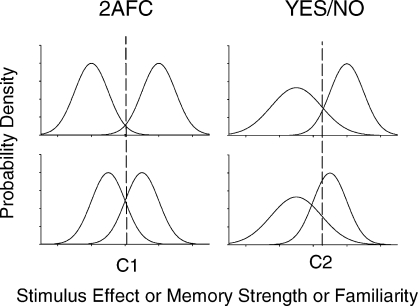
The log b measure suggested by matching law detection theory is based on the assumption that the two types of samples are symmetrical in their effect. In the standard delayed matching-to-sample procedure the samples and choices are symmetrical in that it doesn't matter whether the “signal” is red or green or vice versa. Technically, this procedure is called the two-alternative forced choice procedure (2AFC). The signal-detection analysis for the 2AFC task is illustrated in the left panels of Figure 3.
Fig. 3.
Probability density distributions along the stimulus effect dimension assumed by signal detection theory, for high (top panels) and low (bottom panels) levels of discriminability. Distributions in the left panels are symmetrical and have equal variance for the 2AFC procedure. For the yes/no procedure in the right panels, the sample-absent (noise) distribution has the same mean for high and low discriminability levels and has greater variance than the sample-present distribution. Locations of the criteria, C1 and C2, are assumed to be the same for high and low discriminability levels in each procedure.
The left panels in Figure 3 describe cases where discriminability is high or low, as is the case for short and long retention intervals. The distributions represent the effects of the red and green sample stimuli and are symmetrically located on the stimulus effect dimension. In the classic signal-detection view, an equal-variance model invariably applies to the forced-choice situation because the evidence variable is assumed to be the difference in strength associated with the two alternatives (Macmillan & Creelman, 2005). That is, if, on a given trial, memory for red is greater than memory for green, then the red choice alternative is selected (otherwise the green alternative is selected). Therefore, even if signal strength (i.e., the strength of memory for red on red trials or the strength of memory for green on green trials) is associated with greater or lesser variance than noise (i.e., the strength of memory for green on red trials or the strength of memory for red on green trials), the sample is red on half the trials and green on the other half. As such, the two distributions generated by the difference in strength between memory for red and memory for green on red and green trials, respectively, will have the same variance. Owing to the symmetry, when the retention interval is lengthened (and discriminability decreases), the hit rate decreases and at the same time the false alarm rate increases. This effect is known as the mirror effect and is typical of the 2AFC procedure (Glanzer & Adams, 1985).
The right panels of Figure 3 illustrate the signal detection model applied to cases where there are high and low levels of discriminability in the yes/no procedure. They also illustrate the more usual finding for the yes/no procedure—unequal variances of the signal and noise distributions (Mickes, Wixted, & Wais, 2007; Wixted, 2007). Indeed, in this case, because performance is determined by absolute memory strength (not by the difference in memory strength for red and green), and because the two trials are asymmetrical (one involving a physical sample, the other involving no sample at all), an equal-variance outcome would be a coincidental outcome (not the expected outcome).
In Figure 3, the standard deviation of the signal distribution is 0.33 times that of the noise distribution, although the usual result in studies with humans (estimated from the slopes of receiver operating characteristics) is that it is 1.25 times greater (Yonelinas & Parks, 2007; Wixted, 2007). In Figure 3 we have assumed that the variance of the signal distribution is smaller than that of the noise distribution in order to reflect the result reported by Wixted (1993) and to anticipate the result of the present Experiment 2. The unequal-variance signal detection model helps to explain asymmetries in the Receiver Operating Characteristic (a traditional method of analysis in the signal detection literature) as well as asymmetries in the linear matching law functions (i.e., log ratios of the choice responses following each of the two samples vs. log ratios of reinforcers obtained in different reinforcement conditions) that we report in Experiment 2. These asymmetries have a common origin according to the signal-detection account (namely, unequal signal- and noise-distribution variances), but they are much harder to explain in terms of the matching-law analysis of signal detection offered by Davison and Tustin (1978). Although the unequal-variance model can account for the observed asymmetries, it offers no specific account of why variations in relative reinforcer probabilities have the effect they do. The White and Wixted (1999) model integrates the matching law with the unequal-variance signal-detection account and adds that missing dimension to the traditional signal-detection interpretation. In so doing, it eliminates the traditional notion of a decision criterion, replacing it with a learned reinforcer ratio.
EXPERIMENT 1
In Experiment 1, we compared the results for a yes/no procedure similar to the one used by Wixted (1993), to the results for the corresponding 2AFC procedure. The 2AFC procedure was the standard delayed matching-to-sample task with red and green samples presented on a center response key. Following a retention interval which varied across trials within each session, red and green choice stimuli were presented on side keys. The yes/no version of the procedure simply omitted the red sample at the beginning of the trial. The focus of Experiment 1 was the signal detection analysis illustrated in Figure 3, where variation in the retention interval was expected to yield a mirror effect in the 2AFC task, and a constant false alarm rate in the yes/no task.
Method
Subjects and Apparatus
Three adult homing pigeons with previous training in delayed matching to sample were maintained at between 80 and 85 percent of their free-feeding weights. Experimental chambers measuring 31 × 34 × 32 cm contained a panel with a centrally mounted food hopper and three 2-cm diameter response keys which could be lit red or green.
Procedure
In daily experimental sessions with the 2AFC procedure, each of 80 trials began with the center response key lit red or green. The fifth of five responses on the key darkened it. Following a dark retention interval of .2, 1.5, 3, 6, or 12 s, the side keys were illuminated red and green. The center-key sample, retention intervals, and left–right location of side-key colors were varied within each session accordingly to balanced quasirandom orders. Correct choice responses produced 3-s access to grain with a probability of 0.5, followed by a dark 20-s intertrial interval. Incorrect responses or unreinforced responses produced a 3-s blackout followed by the intertrial interval. The procedure for the yes/no task was identical except that the red sample was replaced by a 5-s period of darkness followed by the retention interval without a response requirement. Sessions in the yes/no task were completed after the four conditions of the 2AFC task in Experiment 2. Data analysis was based on response and reinforcer frequencies summed over the last seven sessions of each condition.
Results and Discussion
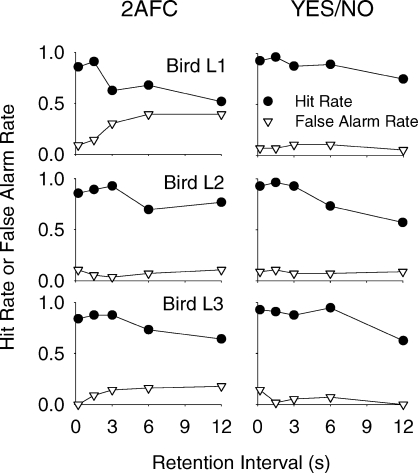
In the 2AFC task, the hit rate was calculated by dividing total choices of green by total choices of both red and green following the green sample. The false alarm rate was calculated by dividing the total choices of green by total choices of both red and green following the red sample. In the yes/no task the measures were the same except that the red sample was replaced by ‘sample absent’. Figure 4 shows hit rates and false alarm rates for each of the 3 pigeons plotted as a function of retention interval. For the 2AFC task, the hit rate declined whereas the false alarm rate increased, albeit at a minimal level for subject L2 which showed a very high level of discrimination. For the yes/no task, the hit rate declined whereas the false alarm rate remained low and relatively constant across retention intervals. This result is consistent with the pattern illustrated in Figure 3.
Fig. 4.
Proportion of hits and false alarms as a function of retention interval duration for 3 pigeons in the 2AFC (left panels) and yes/no (right panels) procedures of Experiment 1.
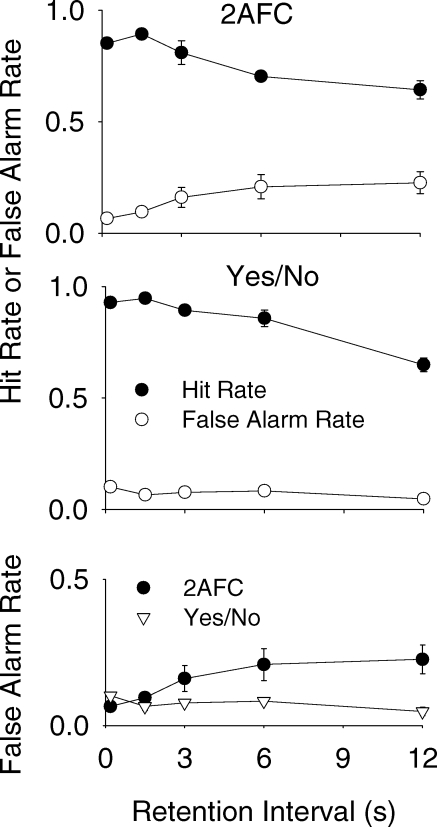
Figure 5 summarizes the same result for the mean hit rate or false alarm rate for the 3 pigeons in the two tasks. In the 2AFC task (top panel), there was a mirror effect with hit rate decreasing and false alarm rate increasing as the retention interval lengthened. In particular, the bottom panel of Figure 5 compares the mean false alarm rates in the two procedures. Whereas the false alarm rate in the 2AFC task increased with increasing retention-interval duration, consistent with the mirror effect, the mean false alarm rate in the yes/no task remained constant across retention intervals. The result in Figure 5 is consistent with the signal detection analysis summarized by Figure 3—hit rate in the yes/no task decreased with lengthening retention interval whereas the false alarm rate remained constant. In terms of signal detection analysis, the result of Experiment 1 shown in Figure 2 is not associated with a change in the decision criterion.
Fig. 5.
Proportions of hits and false alarms averaged over subjects in the 2AFC and yes/no procedures (top two panels) and false alarm rates compared between the two procedures (bottom panel).
EXPERIMENT 2
In Experiment 1, the relative reinforcer rate was the same for correct choices in the two procedures. The receiver operating characteristic (ROC) in signal detection theory, and the linear functions predicted by the matching-law approach to detection (Baum, 1974; Davison & Tustin, 1978) depend, however, on variation of the relative payoff. In Experiment 2, the ratio of reinforcers for correct choices was varied across four conditions, thus generating different levels of bias owing to the reinforcer-ratio variation. The ROC is a plot of the hit rate versus the false alarm rate across the four biasing conditions, and the linear matching law functions are plots of log response ratios versus log reinforcer ratios for the four biasing conditions (with separate functions plotted for sample trials and no-sample trials). For both the 2AFC task and the yes/no procedures, the matching-law analysis predicts parallel linear functions for choices following the two sample types when the log choice response ratio is plotted against the log reinforcer ratio for each retention interval. The reason is that this account has no provision for anticipating (or for dealing with) nonparallel functions. According to the signal detection analysis illustrated in Figure 3, the ROCs should differ between the two procedures, with the 2AFC procedure generating symmetrical ROCs, and the yes/no procedure generating asymmetrical ROCs. Although the signal-detection account can accommodate an asymmetrical ROC, it lacks any provision for accommodating linear matching law functions (whether they are parallel or nonparallel).
Method
Two of the same pigeons (L1 and L2), apparatus, and procedure were used as in Experiment 1, except that four conditions were arranged in each of the 2AFC and yes/no tasks, each lasting for about 20 sessions. (Subject L3 was not included in Experiment 3 owing to an apparatus problem in the differential reinforcement conditions.) For each task, four different ratios of probabilities of reinforcers for correct choices were arranged —.8 versus .2; .2 versus .8; .6 versus .4; .4 versus .6, in that order and for correct red versus green choices, with the conditions for 2AFC conducted before the conditions for the yes/no task. Following completion of the yes/no conditions, a further two conditions were conducted in the 2AFC task with .8/.2 and .2/.8 ratios of reinforcer probabilities. (Subject L1 did not complete the .2/.8 replication.) As in Experiment 1, analyses were based on correct and error responses summed over the last seven sessions of each condition. When logarithms (base 10) of response ratios were calculated, 0.25 was added to the response total in each cell in order to avoid indeterminate values, following the recommendation of Brown and White (2005).
Results and Discussion
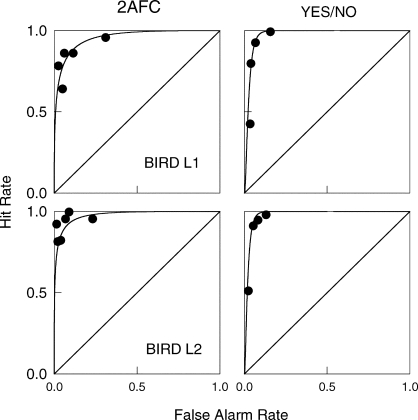
Signal detection analysis relied on ROC plots of hit rates versus false alarm rates for the different reinforcer probability ratios. These were averaged over data for the different retention intervals. The data points in Figure 6 are hit and false alarm rates for the different ratios of reinforcer probability. Hits were correct choices of green in each procedure. The ROC curves plotted in Figure 6 were based on equal variances of Gaussian distributions in the 2AFC task, and variances of 2.0 and 1.0 respectively for the sample-absent and sample-present distributions in the yes/no task. (These variances were chosen for consistency with the illustration in Figure 3.) Distances between the means of the distributions (d′) were chosen so that the ROC curves were consistent with the data. Values for d′ and the ratio of variances obtained from maximum likelihood estimations approximated the values used to plot the ROC curves in Figure 6. The asymmetrical ROC curve in the yes/no procedure, which assumes that the sample-absent distribution has larger variance than the sample-present distribution, is opposite to the usual result for humans (where the variance of the signal distribution is larger) but confirms the result reported by Wixted (1993).
Fig. 6.
Receiver operating characteristics for individual pigeons in the 2AFC and yes/no procedures. Smooth curves are theoretical ROC functions with variances of 1.0 for the 2AFC task and 2.0 and 1.0 respectively for signal absent and signal present distributions in the yes/no task.
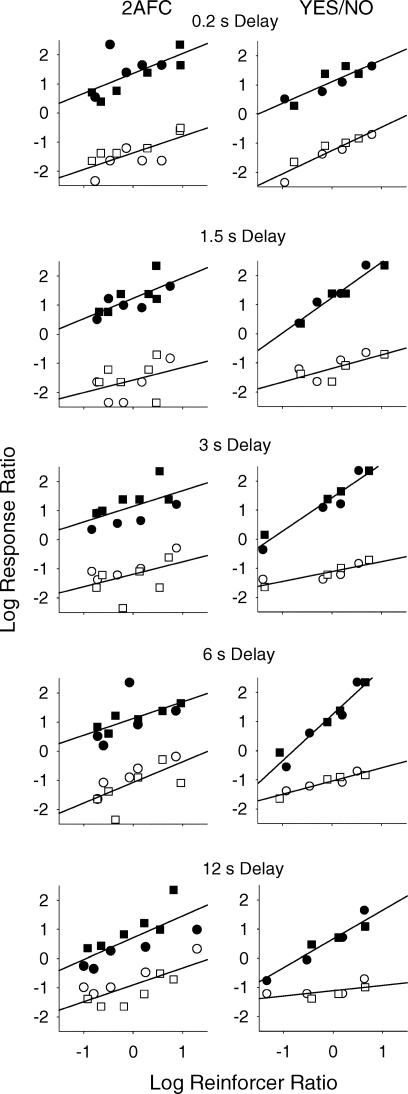
The matching law analysis involves plotting two linear functions—log ratios of the choice responses following each of the two samples, both plotted against the log of the ratio of reinforcers obtained in the different reinforcement conditions. These two functions are expected to be parallel. The vertical distance between the functions reflects the level of discriminability at the different retention intervals. Response bias is indicated by an asymmetry in the intercepts of the two functions.
Figure 7 shows the matching-law functions for Experiment 2. The plots for subjects L1 and L2 are combined because they behaved similarly. The functions of each pair have similar slopes in the 2AFC procedure, and apart from the functions at the 0.2-s delay, different slopes in the yes/no procedure. In particular, the slope for the signal-absent trials is flatter than for signal-present trials. In the matching-law analysis of signal detection, bias is measured by summing the intercepts, which in Figure 7 demonstrate a clear bias towards choosing sample absent. The matching-law analysis, however, assumes that the slopes of the functions in Figure 7 are parallel for the yes/no procedure because the derivation of the bias assumes that the effects of the sample-present and sample-absent trials are symmetrical, just as are the effects of the two samples in the 2AFC task (Davison & Tustin, 1978; McCarthy & Davison, 1980). It may be possible for a recent matching-law analysis proposed by Nevin, Davison, Odum, and Shahan (2007) to predict the slope difference, but such an account may require an assumption of differential attention on sample-present and sample-absent trials.
Fig. 7.
Logarithms of response ratios following the green sample in the 2AFC and yes/no tasks (filled symbols) for pigeons L1 (circles) and L2 (squares), and logarithms of response ratios following red samples in the 2AFC task and sample-absent in the yes/no task (unfilled symbols), plotted as a function of logarithms of ratios of obtained reinforcers. Straight lines are the least squares fits to the data for each retention interval for both birds.
GENERAL DISCUSSION
We began by noting that a fundamental contribution of modern psychophysics is the measurement of response bias. We also noted that in the delayed matching-to-sample analog of the yes/no recognition procedure, the false alarm rate does not change, consistent with the assumption of signal detection theory that the criterion on the stimulus effect axis does not change. That is, response bias, measured by criterion location, does not change in the yes/no procedure. This result was first reported by Wixted (1993) and was confirmed by our Experiment 1.
We noted that this conclusion, however, seems inconsistent with a matching law approach to signal detection according to which a response bias to choose the choice stimulus associated with “sample-absent” increases with increasing retention-interval duration (cf. Figure 2). The inconsistency may be the result of the assumption of the matching law approach that sample-present versus sample-absent discriminations (i.e., yes/no tasks) can be treated in the same way as red–green discriminations (i.e., 2AFC tasks). Our Experiment 2 suggests that this is not the case. The signal-detection analysis indicates that the theoretical distributions of stimulus effect have different variances. That is, whereas the distributions for the 2AFC task are symmetrical, consistent with the finding of a “mirror effect”, the distributions for the yes/no task are asymmetrical. Further, in Experiment 2 the slopes of the matching-law lines were different for the sample-present and sample-absent trials, whereas the matching-law analysis of signal detection (Davison & Tustin, 1978) assumes that they are the same. It seems likely that the asymmetry in the matching law analysis of the data for the yes/no task (Figure 7) is related to the asymmetry in the signal detection analysis (Figure 6), yet neither the matching law detection analysis nor the traditional signal detection account can simultaneously accommodate these results.
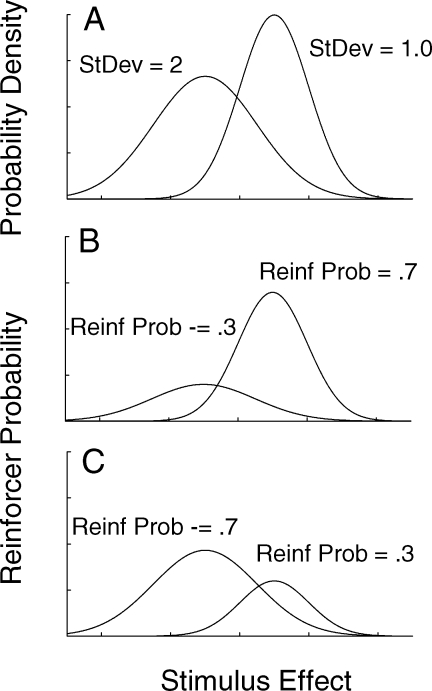
A decade ago we described a theory for delayed matching-to-sample performance that offers a reconciliation and clear account for the data in the present Experiments 1 and 2 (White & Wixted, 1999). The original version of the theory was based on a simulation in which reinforcers obtained (by the computer program) determined the (computer) subject's choices. It is possible, however, to generate predictions by using arranged reinforcer probabilities and equations describing Gaussian distributions (Brown & White, 2009; Wixted & Gaitan, 2002). (The NORMDIST function in Excel is especially useful in this regard.) The main assumption of the White-Wixted model is that the individual chooses between two alternatives according to the proportion or ratio of reinforcers previously obtained for prior choices given the value of stimulus effect, x, present at the time of remembering. The value of x varies from trial to trial, and over trials is associated with distributions of reinforcer probabilities. These reinforcer probability density distributions, illustrated in panels B and C of Figure 8 for arranged probabilities of .3 and .7 in one condition, and .7 and .3 in another, are derived by multiplying distributions of stimulus effect (Figure 8, Panel A) by the arranged reinforcer probabilities. The proportion of reinforcers that would be obtained at each value of stimulus effect x is the proportion of the heights of the reinforcer distributions at x. By summing the areas under the curves in Panels B and C of Figure 8 it is possible to calculate the proportion of each of the choice responses following presentation of the two sample stimuli, as well as the proportion of reinforcers. The main assumption is that following the matching law, the choice proportion at any value of stimulus effect x is determined by the proportion of reinforcers at x. Response and reinforcer proportions can then be used to predict levels of discriminability and bias, or other measures (White & Wixted, 1999).
Fig. 8.
Illustration of the model described by White and Wixted (1999) where distributions of reinforcer probability (Panels B and C) are determined by multiplying the probability density distributions of stimulus effect for two samples (Panel A) by arranged reinforcer probabilities. At any value x on the stimulus effect dimension, the choice between response alternatives is determined by the proportion of the heights of the two reinforcer distributions at x.
Unlike signal detection theory, the model does not assume that decisions are based on a criterion at a fixed location on the stimulus effect dimension. The only correspondence to signal detection theory is the assumption that the samples are associated with distributions of stimulus effect, and it allows for the possibility that these distributions will not have the same variance. Unlike the matching law analysis of signal detection, the model does not assume that choice proportions following each sample are determined by overall reinforcer proportions. That is, the model is not premised on a 2 × 2 matrix of sample stimuli and choice alternatives. Instead, the matching law is used to predict choice on any one trial given the past history of reinforcement associated with the value of x that prevails on the current trial. That history is given by the ratio of the heights of the signal and noise distributions for each value of x. In many ways, this account is like the traditional likelihood ratio model of signal detection theory. The difference is that, in our model, the likelihood ratio is not the ratio of the signal versus noise stimulus likelihoods associated with x but is instead the ratio of reinforcers previously obtained for choosing red versus green for that value of x.
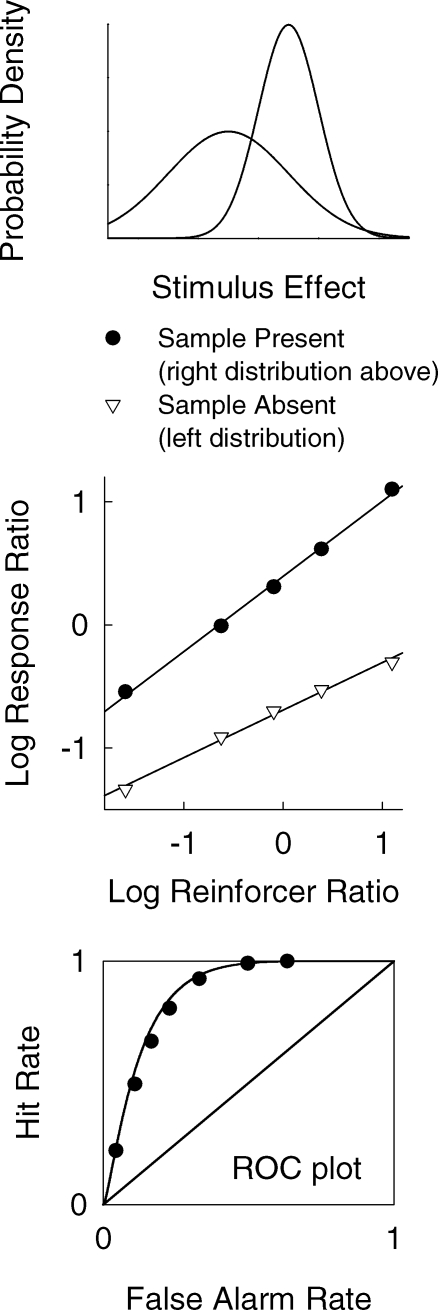
Analysis of the 2AFC procedure, where there is symmetry between the effects of the two sample stimuli, was explored by White and Wixted (1999), Wixted and Gaitan (2002), and Brown and White (2009). Analysis of the yes/no task, where there is an asymmetry between the effects of sample-absent and sample-present trials, is explored below by generating predictions from the model. For the yes/no task, we assume that the stimulus-absent distribution has a variance of 2.0, and the stimulus-present distribution has a variance of 1.0 (Figure 9, top panel, and also Figure 8). These values correspond to those from the signal detection analysis of the Experiment 2 result. The only other assumption we made in order to generate the predictions in Figure 9 was that the distance between the distributions was three Z-score units. (The actual value could be found by fitting the model to data, although we do not describe the results of fits of the model here.) By running the model in an Excel spreadsheet for pairs of arranged reinforcer probabilities ranging from 0.1/0.9 to 0.9/0.1, we generated a set of response and reinforcer proportions for sample-absent and sample-present trials. (Two extreme reinforcer proportions were also used to generate the far right data points on the ROC curve in Figure 9.) These measures were used to calculate logarithms of response and reinforcer ratios (cf. Figure 7) and hit and false alarm rates (cf. Figure 6). The middle panel of Figure 9 shows predictions from the model for the matching-law analysis, with straight lines fitted to the predicted data points. Importantly, the functions fitted to the predicted data points have different slopes, like those for the data in Experiment 2 (Figure 7). The bottom panel of Figure 9 shows the predicted hit and false alarm rates. The ROC curve drawn through the predicted data points was based on signal detection theory with an assumption that the variances of the sample-absent and sample-present distributions were 2.0 and 1.0 respectively (cf. Figure 9, top panel). The ROC curve is asymmetrical, like those in Figure 6.
Fig. 9.
Data points predicted from the White and Wixted (1999) model, based on stimulus-effect distributions with different variances (top panel). Straight lines were fitted to the predicted data points for matching law functions (middle panel) and ROC curves were drawn through predicted pairs of hit and false alarm rates (bottom panel).
In summary, by assuming that the stimulus-effect distributions in the White and Wixted (1999) model can have different variances, we are able to predict matching law functions with different slopes, and asymmetrical ROC curves, both of which characterize behavior in the yes/no delayed matching task. The model has only two or three parameters (for the distance between the stimulus effect distributions and their variances), and yet can predict quite complex functions usually studied in the context of elaborate theories.
Acknowledgments
Thanks to Glenn Brown for valuable assistance with Excel at different stages of the research.
REFERENCES
- Baum W.M. On two types of deviation from the matching law: Bias and undermatching. Journal of the Experimental Analysis of Behavior. 1974;22:231–242. doi: 10.1901/jeab.1974.22-231. [DOI] [PMC free article] [PubMed] [Google Scholar]
- Brown G.S, White K.G. The optimal correction for estimating extreme discriminability. Behavior Research Methods. 2005;37:436–449. doi: 10.3758/bf03192712. [DOI] [PubMed] [Google Scholar]
- Brown G.S, White K.G. Reinforcer probability, reinforcer magnitude, and the reinforcement context for remembering. Journal of Experimental Psychology: Animal Behavior Processes. 2009;35:238–249. doi: 10.1037/a0013864. [DOI] [PubMed] [Google Scholar]
- Davison M.C, Tustin R.D. The relation between the generalized matching law and signal-detection theory. Journal of the Experimental Analysis of Behavior. 1978;29:331–336. doi: 10.1901/jeab.1978.29-331. [DOI] [PMC free article] [PubMed] [Google Scholar]
- Dougherty D.H, Wixted J.T. Detecting a nonevent: Delayed presence-versus-absence discrimination in pigeons. Journal of the Experimental Analysis of Behavior. 1996;65:81–92. doi: 10.1901/jeab.1996.65-81. [DOI] [PMC free article] [PubMed] [Google Scholar]
- Egan J.P, Clarke F.R. Psychophysics and signal detection. In: Sidowski J.B, editor. Experimental methods and instrumentation in psychology. New York: McGraw-Hill; 1966. pp. 211–246. (Ed.) [Google Scholar]
- Gaitan S.C, Wixted J.T. The role of “nothing” in memory for event duration in pigeons. Animal Learning & Behavior. 2000;28:147–161. [Google Scholar]
- Glanzer M, Adams J.K. The mirror effect in recognition memory. Memory & Cognition. 1985;13:8–20. doi: 10.3758/bf03198438. [DOI] [PubMed] [Google Scholar]
- Grant D.S. Symmetrical and asymmetrical coding of food and no-food samples in delayed matching in pigeons. Journal of Experimental Psychology: Animal Behavior Processes. 1991;17:186–193. [Google Scholar]
- Green D.M, Swets J.A. Signal detection theory and psychophysics. New York: Wiley; 1966. [Google Scholar]
- Jang Y, Wixted J.T, Huber D.E. Testing signal-detection models of yes/no and two-alternative forced-choice recognition memory. Journal of Experimental Psychology: General. 2009;138:291–306. doi: 10.1037/a0015525. [DOI] [PMC free article] [PubMed] [Google Scholar]
- Macmillan N.A, Creelman C.D. Detection theory: A user's guide (2nd ed.) New York: Cambridge University Press; 2005. [Google Scholar]
- McCarthy D.C, Davison M. Independence of sensitivity to relative reinforcement and discriminability in signal detection. Journal of the Experimental Analysis of Behavior. 1980;34:273–284. doi: 10.1901/jeab.1980.34-273. [DOI] [PMC free article] [PubMed] [Google Scholar]
- Mickes L, Wais P.E, Wixted J.T. Recollection is a continuous process: Implications for dual-process theories of recognition memory. Psychological Science. 2009;20:509–515. doi: 10.1111/j.1467-9280.2009.02324.x. [DOI] [PubMed] [Google Scholar]
- Mickes L, Wixted J.T, Wais P.E. A direct test of the unequal-variance signal detection model of recognition memory. Psychonomic Bulletin & Review. 2007;14:858–865. doi: 10.3758/bf03194112. [DOI] [PubMed] [Google Scholar]
- Murdock B.B. Signal-detection theory and short-term memory. Journal of Experimental Psychology. 1965;70:443–447. doi: 10.1037/h0022543. [DOI] [PubMed] [Google Scholar]
- Nevin J.A. Psychophysics and reinforcement schedules. In: Commons M.L, Mazur J.E, Nevin J.A, Rachlin H, editors. Quantitative analyses of behavior: Vol.1. Discriminative properties of reinforcement schedules. Hillsdale, NJ: Erlbaum; 1981. pp. 3–27. (Eds.) [Google Scholar]
- Nevin J.A, Davison M, Odum A.L, Shahan T.A. A theory of attending, remembering, and reinforcement in delayed matching to sample. Journal of the Experimental Analysis of Behavior. 2007;88:285–317. doi: 10.1901/jeab.2007.88-285. [DOI] [PMC free article] [PubMed] [Google Scholar]
- Weaver J.E, Dorrance B.R, Zentall T.R. Present/absent sample matching in pigeons: Is comparison choice controlled by the sample stimulus or by differential sample responding. Animal Learning & Behavior. 1999;27:288–294. [Google Scholar]
- White K.G. Characteristics of forgetting functions in delayed matching to sample. Journal of the Experimental Analysis of Behavior. 1985;44:15–34. doi: 10.1901/jeab.1985.44-15. [DOI] [PMC free article] [PubMed] [Google Scholar]
- White K.G. Forgetting functions. Animal Learning & Behavior. 2001;29:193–207. [Google Scholar]
- White K.G, Wixted J.T. Psychophysics of remembering. Journal of the Experimental Analysis of Behavior. 1999;71:91–113. doi: 10.1901/jeab.1999.71-91. [DOI] [PMC free article] [PubMed] [Google Scholar]
- Wixted J.T. Nonhuman short-term memory: A quantitative reanalysis of selected findings. Journal of the Experimental Analysis of Behavior. 1989;52:409–426. doi: 10.1901/jeab.1989.52-409. [DOI] [PMC free article] [PubMed] [Google Scholar]
- Wixted J.T. A signal detection analysis of memory for nonoccurrence in pigeons. Journal of Experimental Psychology: Animal Behavior Processes. 1993;19:400–411. [Google Scholar]
- Wixted J.T. Dual-process theory and signal-detection theory of recognition memory. Psychological Review. 2007;114:152–176. doi: 10.1037/0033-295X.114.1.152. [DOI] [PubMed] [Google Scholar]
- Wixted J.T, Gaitan S.C. Cognitive theories as reinforcement history surrogates: The case of likelihood ratio models of human recognition memory. Animal Learning & Behavior. 2002;30:289–305. doi: 10.3758/bf03195955. [DOI] [PubMed] [Google Scholar]
- Wixted J.T, Stretch V. The case against a criterion-shift account of false memory. Psychological Review. 2000;107:368–376. doi: 10.1037/0033-295x.107.2.368. [DOI] [PubMed] [Google Scholar]
- Yonelinas A.P, Parks C.M. Receiver operating characteristics in recognition memory: A review. Psychological Bulletin. 2007;133:800–832. doi: 10.1037/0033-2909.133.5.800. [DOI] [PubMed] [Google Scholar]


