

Abstract
Detection of somatic mutations in clinical cancer specimens is often hampered by excess wild-type DNA. The aim of this study was to develop a simple and economical protocol without using fluorescent probes to detect low-level mutations. In this study, we combined peptide nucleic acid (PNA)-clamping PCR with asymmetric primers and a melting curve analysis using an unlabeled detection probe. PNA-clamping PCR, which suppressed amplification of the wild-type allele, was more sensitive for KRAS codon 12 mutation detection than nonclamping PCR in 5 different mutant cell lines. Three detection probes were tested (a perfectly matched antisense, a mismatched antisense, and a mismatched sense), and the mismatched sense detection probe showed the highest sensitivity (0.1% mutant detection) under clamping conditions. With this probe, we were able to detect not only the perfectly matched KRAS mutation, but also 4 other mismatched mutations of KRAS. We then applied this protocol to 10 human colon cancer tissues with KRAS codon 12 mutations, successfully detecting the mutations in all of them. Our data indicate that the combination of perfectly matched antisense PNA and a mismatched sense detection probe can detect KRAS mutations with a high sensitivity in both cell lines and human tissues. Moreover, this study might prove an easily applicable protocol for the detection of low-level mutations in other cancer genes.
The need to detect somatic mutations in the presence of excess wild-type sequences (low-level mutation detection) is frequently encountered in cancer genetics. Cancer biopsies often consist of inhomogeneous mixtures of stromal cells and cancer cells, and thus “pure” tumor biopsies are, themselves, genetically heterogeneous. Also, early detection of mutant DNA in body fluids, including blood and urine, requires a “needle in a haystack” approach to mutation detection.1
Excess wild-type DNA exhausts essential reagents during polymerase chain reaction (PCR) and tends to mask mutation sequence signals during the detection process. To date, a general strategy to overcome this difficulty has been to suppress wild-type amplification or enrich the mutant allele, followed by a detection procedure that provides a sufficient resolution to disclose mutant signals.2,3,4,5,6,7 However, most of the methods currently used are not convenient for use in clinical laboratories because of multiple procedural manipulations that are both time-consuming and cost-ineffective. Most importantly, the risk of contamination during multiple transfers is high. Therefore, it is necessary to develop more convenient and simpler methods for clinical application of low-level mutant detection.
Recently, peptide nucleic acid (PNA) has been used to improve mutation detection in clinical specimens by suppressing wild-type allele amplification.8,9,10 There are two crucial features of PNA that make it a PCR clamp for specific alleles: PNA cannot function as a primer for DNA polymerase or serve as a substrate for the exonuclease activities of Taq polymerase. Melting curve analysis is a technique for identifying single nucleotide polymorphisms or mutations.8,9,10 Recently, a high-saturation intercalating dye called LCGreen was introduced for the melting curve analysis, and this dye has been used in genotyping for monitoring the melting of small amplicons by unlabeled probes instead of fluorescence probes.11,12 In the present study, we combined PNA clamping–based asymmetric PCR with a melting curve analysis using unlabeled probe in a single step and detected different types of KRAS mutant templates in a ratio of 1:1000 wild-type alleles.
Materials and Methods
Primers and Probes
Forward (F7S) and reverse (R6) primers were designed to amplify a KRAS fragment in exon 2, and the resulting amplicon size was 154 bp. An antisense PNA and 3 types of DNA detection probes were designed to span the codon 12 of the KRAS gene where most of KRAS mutations occur in cancers.4,6 The antisense PNA complementary to the wild-type sequence was designed to clamp PCR for the wild-type allele but not the mutant allele. For the detection of the amplicons, we used the three unlabeled DNA probes (detection probes) that had C-6 amino–modified block. The detection probes included a perfectly matched antisense (D2), a mismatched antisense (D9), and a mismatched sense (DCM2) probe and were compared for the sensitivity of probing melting curve analysis. The two mismatched probes, D9 and DCM2, contained a single mismatch at the second base of codon 12 (c.35G>T). Sequences of the primers and probes used in this study are listed in Table 1. Also, the principle of this design is depicted in Figure 1, A–C.
Table 1.
Primers and Probes Used in this Study
| Name | Sequence* (5′−3′ for DNA or N to C for PNA) | Position† |
|---|---|---|
| Primers | ||
| F7S | 5′-GATAGTGTATTAACCTTATGTGTGAC-3′ | −78 to −53 |
| R6 | 5′-TCTGAATTAGCTGTATCGTCAA-3′ | 76 to 55 |
| PNA | N-CCTACGCCACCAGCTCC-C | 44 to 28 |
| Unlabeled DNA probes (detection probe) | ||
| DCM2 (mismatched sense) | 5′-TAGTTGGAGCTGTTGGCGTAGGC-3AmM‡−3′ | 23 to 45 |
| D2 (perfectly matched antisense) | 5′-GCCTACGCCACCAGCTCCAACTA-3AmM-3′ | 45 to 23 |
| D9 (mismatched antisense) | 5′-CCTACGCCAACAGCTCCAACTAC-3AmM-3′ | 44 to 22 |
Mismatch is underlined and in bold.
A of the ATG start codon is designated as position 1.
C-6 amino block.
Figure 1.
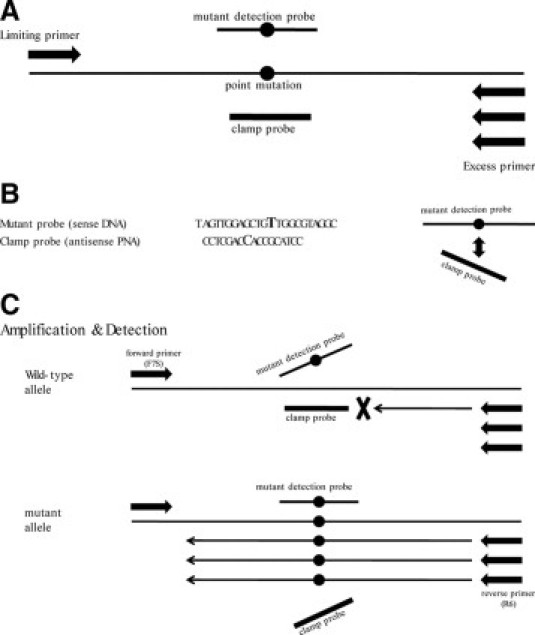
PNA-mediated asymmetric PCR clamping system. A: Primer and probe positions. B: Point mutation: Both the sense mutant detection probe and antisense clamp probe are located on the mutation site of KRAS (c.35G>T). The sense mutant detection probes are designed to fail to bind to the antisense clamp probes because of the mismatches. C: Schematic presentation of the reactions to detect point mutations. In the amplification step, the clamp probe cannot bind to the mutation types but binds to the wild-type, resulting in preferential amplification of single-strand mutant sequences by an asymmetric PCR. In the detection step, the mutant probes bind to the single-strand mutant sequences. The signals are detected by a melting curve analysis.
Templates
We used six cancer cell lines that have wild-type KRAS (K-562) and mutant KRAS (SW480, A549, MIA PaCa-2, LS174T, and SW1116; Table 2). DNA from these cell lines was purified using a QIAamp DNA Mini kit (Qiagen, Hilden, Germany), quantified by UV spectrophotometry, and stored at −20°C until use. We also included 10 formalin-fixed paraffin-embedded colon adenocarcinoma tissues with KRAS codon 12 mutations. KRAS codon 12 sequences of the cancer tissues were directly sequenced using a capillary automatic sequencer (ABI Prism Genetic Analyzer, Applied Biosystem, Carlsbad, CA). They originated from sigmoid colon (N = 5) and rectum (N = 5). Malignant cells and normal cells were selectively procured from hematoxylin and eosin–stained slides using a 301/2-gauge hypodermic needle.13,14 DNA from the microdissected tissues was also purified with QIAamp DNA Mini Kit.
Table 2.
KRASMutations of Cell Line Controls Used in this Study and Their Melting Temperature (Tm) by DCM2 Probe
| Cell line | Origin | Mutation | Genotype | DCM2 Tm (°C)* |
|---|---|---|---|---|
| K-562 | Leukemia | Wild-type | 70 | |
| SW480 | Colon carcinoma | c.35G>T (p.G12V) | Homozygous | 74.7 |
| A549 | Lung carcinoma | c.34G>A (p.G12S) | Homozygous | 67 |
| MIA PaCa-2 | Pancreas carcinoma | c.34G>T (p.G12C) | Homozygous | 67.5 |
| LS174T | Colon carcinoma | c.35G>A (p.G12D) | Heterozygous | 69.7 |
| SW1116 | Colon carcinoma | c.35G>C (p.G12A) | Heterozygous | 71 |
The melting temperatures (Tm) of DCM2 probe for the KRASmutations are measured in the current study using melting curve analysis instrument, LightScanner.
PCR and Melting Curve Analysis
PCR was performed in a 20-μl reaction volume with a master hybridization mixture (Roche Diagnostics, Mannheim, Germany). LCGreen plus in a final concentration of 1× was added for the labeling between the detection probe and PCR products, along with 100 ng of template DNA per reaction. To obtain optimal mutant signals, we combined asymmetric PCR and PNA clamping. The concentrations of the detection probes and the PNA were adjusted by changing the concentrations.
PCR conditions were adjusted by changing cycles, durations, and temperatures, and the following conditions were used in the experiments: an initial denaturation at 95°C for 5 minutes followed by 75 cycles at 95°C for 10 seconds, then 70°C for 20 seconds for PNA binding and 60°C for 30 seconds for primer annealing and extension. The purpose of primer extension at the lower extension temperature (60°C) was for PNA to suppress PCR of wild-type but not mutant templates.3 After PCR, melting curve analysis was performed using a LightScanner (Idaho Technology, Salt Lake City, UT). During melting, data were acquired from 60°C to 90°C at a thermal transition rate of 0.1°C and analyzed using Idaho Technology's high-resolution software version 1.1. Genotypes were identified by the melting temperatures of peaks on derivative plots (Table 2).
Results
The concentrations of the forward primer (F7S) and reverse primer (R6) varied depending on the detection probes. With the detection probe DCM2, the concentrations of F7S and R6 were adjusted to 0.05 μmol/L and 1 μmol/L, respectively. With the other two sense detection probes, D2 and D9, the final concentrations of F7S and R6 were 1 μmol/L and 0.05 μmol/L, respectively. In these conditions, we analyzed melting temperatures (Tm) of the three detection probes with wild-type and mutant templates. Among them, the DCM2 probe revealed the most discrete mutant peak under both nonclamping and clamping conditions in all of the mutant templates. Thus, most of the following experiments were performed with the DCM2 detection probe. The Tm of the DCM2 probe with the mutants was between 67.0°C and 74.7°C (Table 2).
When the melting curve analysis with the DCM2 detection probe was performed under nonclamping conditions, the assay was able to detect 30%, 20% and 10% of the mutant KRAS diluted in normal DNA (Figure 2, B–D), but could detect 5% of KRAS mutated DNA (Figure 2E). The melting peaks of the wild-type and mutant detected by the DCM2 detection probe were seen around 70°C and 75°C, respectively (Figure 2, A–E). In addition to the wild-type and mutant peaks by the DCM2 detection probe, two other peaks (around 82°C and 87°C) were also seen (Figure 2). These peaks were still seen in the reaction without the detection probe (data not shown), indicating that they originated from amplicon itself, not from the binding of the probe.
Figure 2.
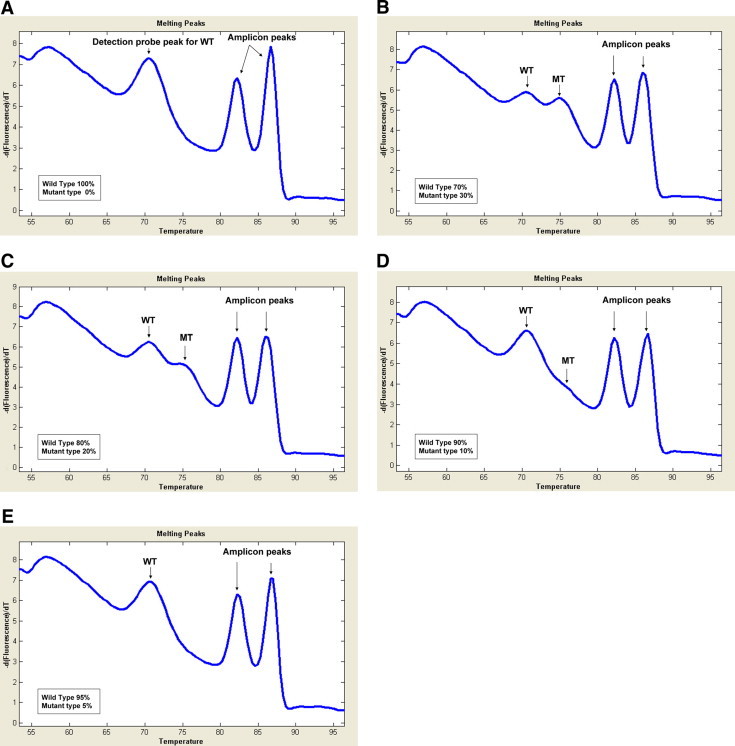
Melting curve assay under the nonclamping condition. Melting curve analysis with DCM2 detection probe was performed under nonclamping condition with 100 ng genomic DNA of SW480 cells with KRAS mutation and K562 cells without KRAS mutation by varying the ratio of the 2 types (A, 100% wild-type, 0% mutant; B, 70% wild-type, 30% mutant; C, 80% wild-type, 20% mutant; D, 90% wild-type, 10% mutant; E, 95% wild-type, 5% mutant). WT indicates wild-type melting peak; MT, mutant melting peak.
After adjustment, we used the detection probes and the PNA in the concentrations of 0.5 μmol/L and 0.25 μmol/L, respectively. We first analyzed the mutant KRAS from SW480 cells that had the exactly matched sequences with the DCM2 detection probe (Tables 1and 2). With PNA clamping, the melting curve analysis was able to detect 50%, 1%, and 0.1% of the KRAS mutant diluted in the wild-type DNA (Figure 3, B–D). There was no visible noise of the mutant peak with the pure wild-type DNA (Figure 3A). There was not any visible peak with the no template control, either (Figure 3A). We then compared sensitivities of clamping and nonclamping for the mutant detection. The sensitivity with the PNA-clamping condition (up to 0.1%) was superior to that without the clamping (up to 20%) for the KRAS mutation (c.35G>T) detection (Figure 3). With SW480 cell DNA (c.35G>T), we compared the efficiencies for the mutant detection among the three detection probes, DCM2, D2, and D9, in the clamping condition. The sensitivities of D2 and D9 were lower and less stable than that with the DCM2 (data not shown). In the clamping condition, we analyzed the sensitivity of this assay with the DCM2 detection probe in cell lines with different KRAS mutations (Table 2). The DCM2 detection probe readily detected not only the perfectly matched KRAS mutant (SW480) but also mismatched mutants (A549, MIA PaCa-2, LS174T, and SW1116; Figure 4).
Figure 3.
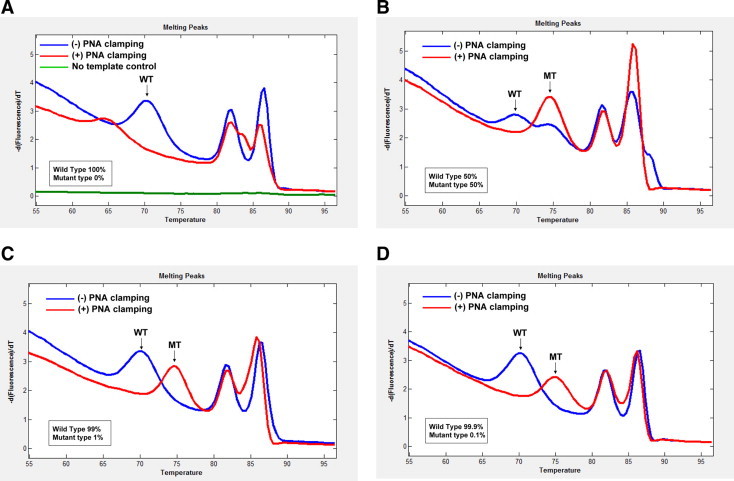
Comparison of sensitivity of KRAS mutation detection between clamping and nonclamping conditions. Melting curve analysis with the DCM2 detection probe under nonclamping (blue line) and clamping (red line) conditions using 100-ng genomic DNAs, which consist of 100% wild-type DNA (A), 50% mutant DNA from SW480 cells (B), 1% mutant DNA from SW480 cells (C), and 0.1% mutant DNA from SW480 cells (D). WT indicates wild-type melting peak; MT, mutant melting peak.
Figure 4.
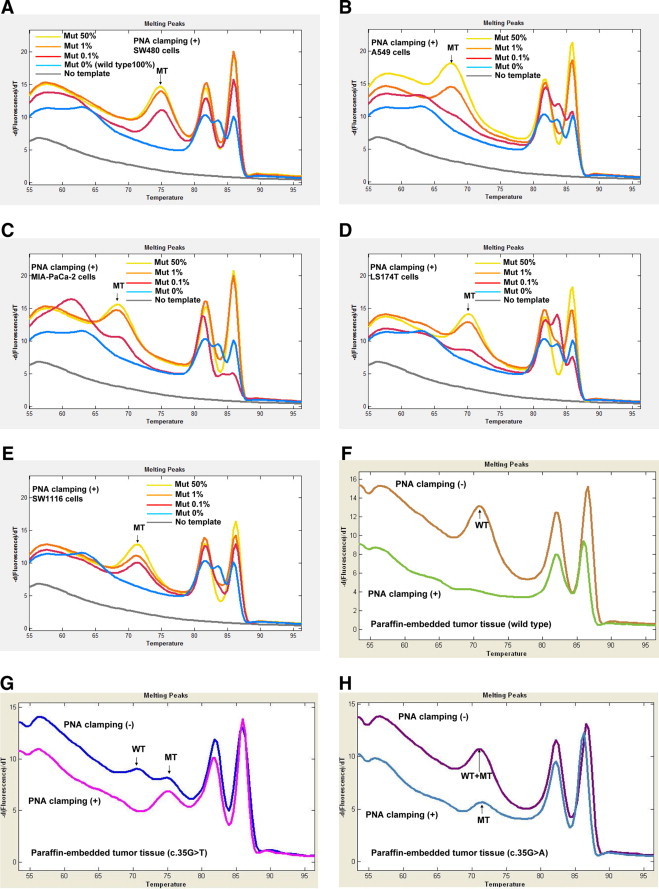
Application of the clamping assay to cell lines and paraffin-embedded tumor tissues with different KRAS mutations. Melting curve analysis (A–E) with the DCM2 detection probe under clamping condition using 100 ng genomic DNAs with varying ratio of the mutant DNA (100% wild-type DNA, 50% mutant DNA, 1% mutant DNA, and 0.1% mutant DNA). Melting curve analysis (F–H) under clamping and nonclamping conditions with paraffin-embedded tumor tissue DNA. SW480 cells (A), A549 cells (B), MIA PaCa-2 cells (C), LS174T cells (D), SW1116 cells (E), wild-type tumor tissue (F), c.35G>T mutant tumor tissue (G), and c.35G>A mutant tumor tissue (H). Mut indicates mutant DNA; MT, mutant melting peak; WT, wild-type melting peak.
Under PNA-clamping condition with wild-type 100% or low-level (0.1%) mutant DNA (Figures 3A and 4, A–E), there were additional melting peaks at the low temperature zone (60- 65°C) and at the high temperature zone between the biphasic amplicon peak temperatures (82- 87°C). These additional melting peaks did not match the wild-type or mutant peaks that were found under nonclamping conditions. Because these additional peaks were seen only under clamping conditions with wild-type 100% or low-level mutant DNA, this finding suggests that PNA-clamping might produce prematurely terminated wild-type PCR product during the extension step and that the truncated PCR product might cause additional probe and amplicon peaks with lower a Tm than expected.
To see whether this assay is capable of detecting KRAS mutations in formalin-fixed paraffin-embedded cancer tissues as well, we analyzed 10 colon cancers (five with c.35G>T heterozygous mutation and five with c.35G>A heterozygous mutation). We detected the mutations in all of the specimens with the DCM2 detection probe in the PNA-clamping conditions (Figure 4, F–H).
Discussion
The purpose of this study was to develop a PCR-based procedure combining PNA-clamping PCR and unlabeled detection probe for the detection of low-level KRAS mutations. The uniqueness of our method is that PCR amplification, mutant enrichment, and mutation detection can be accomplished in a single-tube format on a high-throughput melting instrument, the LightScanner, without having to go through several laborious procedures including electrophoresis, hybridization, and enzymatic reactions. Furthermore, because this method uses a simple design consisting of an unlabeled detection probe and a saturating DNA dye (LCGreen), and proper positioning of the unlabeled detection probe at mutation sites makes it possible to genotype the mutations according to Tm of probe melting peaks without sequencing as described in Table 2, the cost and time involved in either synthesizing commonly used fluorescently labeled probes or sequencing analysis could be eliminated. Finally, our procedure could detect as low as 0.1% of mutant genomic DNA against a background of 99.9% of wild-type DNA (1:1000 ratio).
Although direct DNA sequencing is considered a gold standard for mutation detection, its low sensitivity may lead to false-negative results for detecting mutations, especially in clinical specimens.15,16 To improve sensitivity in the mutation detections, PNA clamping, melting curve analysis, and asymmetric PCR with fluorescence-labeled probe or unlabeled detection probe have been used in various combinations.8,9,10,11,12,16,17 We chose to use a strategy of PNA-clamping PCR with asymmetric primers and unlabeled probe signal detection followed by a melting curve analysis. Previous PNA clamping-based mutation detections have provided sensitivities of 1% to 0.01% of tumor DNA.8,9,16 Although our method is less sensitive than the most sensitive one reported by one order of magnitude,9 it is comparable with the sensitivities of most methods for detecting low-level mutations.8,9,10,11,12,16,17 Also, instead of a symmetric PCR, we used an asymmetric PCR to produce higher levels of the antisense strand,17 which could bind with the unlabeled detection probe (DCM2), and found that it was more sensitive than that with a symmetric PCR (data not shown).
According to an earlier study using fluorescent-labeled PNA as both clamping and sensor (detection) probes,9 a high ramping rate (20°C/sec) of capillary PCR and a low-extension temperature (60°C) were critical for successful clamping. Because we used a plate PCR instead of a capillary PCR, a slower ramping rate (3°C/sec) in the plate PCR might explain the lower sensitivity of our assay (0.1% of mutant DNA) because of less efficient clamping than that of the previous study (0.01% of mutant DNA) with a capillary PCR machine (LightCycler).
When PNA in combination with a oligonucleotide hybridization probe is used, the PNA not only suppresses PCR but also competes with the hybridization probe.9,18,19 In the current study, we developed a strategy to combine a perfectly matched antisense PNA and a mismatched sense detection probe. This strategy may prevent possible competition for hybridization targets between the two oligonucleotides, and the mismatch may destabilize the hybrids between them. The perfectly matched antisense/mismatched sense strategy of our study agrees with our finding that the mismatched sense probe (DCM2) provided more sensitive and stable data than the other two DNA probes (a perfectly matched antisense and a mismatched antisense probe).
Although somatic mutations of tumor suppressor genes occur in a wide range of DNA sequences, those of proto-oncogenes occur recurrently at specific sequences.20,21 Because PNA clamping PCR-based mutation detection covers only a short range of gene sequences, it is suitable for detection of recurrent proto-oncogene mutations but not for the detection of tumor suppressor gene mutations. Not only KRAS mutations, but also other proto-oncogene mutations or recurrent mutations such as EGFR, BRAF, JAK2, PIK3CA, and IDH114,22,23,24,25,26 could possibly be detected by our strategy. Also, it is clinically important to detect such recurrent mutations in free circulating DNA (serum or plasma) derived from solid tumors. However, as the free circulating DNA is usually fragmented and short in size, another strategy to detect the mutations in blood may be required. With the same approach used here with a shorter PCR product, we could detect KRAS and EGFR mutations in cancer patients' plasma (unpublished data).
In summary, the combination of PNA clamping and unlabeled detection probe melting has provided a simple method for detection of low-level mutations in this study. Because our protocol requires no fluorescent labeling nor sophisticated procedures, it may have great potential for clinical use in cancer screening and could be adapted for detection of trace mutants pertinent to other diseases.
Footnotes
Supported by a grant from Ministry for Health, Welfare, and Family Affairs (A080083) and a grant from National Research Foundation (R01-2008-000-10014-0).
References
- 1.Parsons BL, Heflich RH. Genotypic selection methods for the direct analysis of point mutations. Mutat Res. 1997;387:97–121. doi: 10.1016/s1383-5742(97)00026-4. [DOI] [PubMed] [Google Scholar]
- 2.Iinuma H, Okinaga K, Adachi M, Suda K, Sekine T, Sakagawa K, Baba Y, Tamura J, Kumagai H, Ida A. Detection of tumor cells in blood using CD45 magnetic cell separation followed by nested mutant allele-specific amplification of p53 and K-ras genes in patients with colorectal cancer. Int J Cancer. 2000;89:337–344. doi: 10.1002/1097-0215(20000720)89:4<337::aid-ijc4>3.0.co;2-r. [DOI] [PubMed] [Google Scholar]
- 3.Jacobson DR, Mills NE. A highly sensitive assay for mutant ras genes and its application to the study of presentation and relapse genotypes in acute leukemia. Oncogene. 1994;9:553–563. [PubMed] [Google Scholar]
- 4.Norheim Andersen S, Breivik J, Løvig T, Meling GI, Gaudernack G, Clausen OP, Schjölberg A, Fausa O, Langmark F, Lund E, Rognum TO. K-ras mutations and HLA-DR expression in large bowel adenomas. Br J Cancer. 1996;74:99–108. doi: 10.1038/bjc.1996.322. [DOI] [PMC free article] [PubMed] [Google Scholar]
- 5.Nickerson DA, Kaiser R, Lappin S, Stewart J, Hood L, Landegren U. Automated DNA diagnostics using an ELISA-based oligonucleotide ligation assay. Proc Natl Acad Sci U S A. 1990;87:8923–8927. doi: 10.1073/pnas.87.22.8923. [DOI] [PMC free article] [PubMed] [Google Scholar]
- 6.Nishikawa T, Maemura K, Hirata I, Matsuse R, Morikawa H, Toshina K, Murano M, Hashimoto K, Nakagawa Y, Saitoh O, Uchida K, Katsu K. A simple method of detecting K-ras point mutations in stool samples for colorectal cancer screening using one-step polymerase chain reaction/restriction fragment length polymorphism analysis. Clin Chim Acta. 2002;318:107–112. doi: 10.1016/s0009-8981(01)00806-3. [DOI] [PubMed] [Google Scholar]
- 7.Toyooka S, Tsukuda K, Ouchida M, Tanino M, Inaki Y, Kobayashi K, Yano M, Soh J, Kobatake T, Shimizu N, Shimizu K. Detection of codon 61 point mutations of the K-ras gene in lung and colorectal cancers by enriched PCR. Oncol Rep. 2003;10:1455–1459. doi: 10.3892/or.10.5.1455. [DOI] [PubMed] [Google Scholar]
- 8.Orum H, Nielsen PE, Egholm M, Berg RH, Buchardt O, Stanley C. Single base pair mutation analysis by PNA directed PCR clamping. Nucleic Acids Res. 1993;21:5332–5336. doi: 10.1093/nar/21.23.5332. [DOI] [PMC free article] [PubMed] [Google Scholar]
- 9.Luo JD, Chan EC, Shih CL, Chen TL, Liang Y, Hwang TL, Chiou CC. Detection of rare mutant K-ras DNA in a single-tube reaction using peptide nucleic acid as both PCR clamp and sensor probe. Nucleic Acids Res. 2006;34:e12. doi: 10.1093/nar/gnj008. [DOI] [PMC free article] [PubMed] [Google Scholar]
- 10.Karkare S, Bhatnagar D. Promising nucleic acid analogs and mimics: characteristic features and applications of PNA. LNA, and morpholino. Appl Microbiol Biotechnol. 2006;71:575–586. doi: 10.1007/s00253-006-0434-2. [DOI] [PubMed] [Google Scholar]
- 11.Zhou L, Wang L, Palais R, Pryor R, Wittwer CT. High-resolution DNA melting analysis for simultaneous mutation scanning and genotyping in solution. Clin Chem. 2005;51:1770–1777. doi: 10.1373/clinchem.2005.054924. [DOI] [PubMed] [Google Scholar]
- 12.Erali M, Voelkerding KV, Wittwer CT. High resolution melting applications for clinical laboratory medicine. Exp Mol Pathol. 2008;85:50–58. doi: 10.1016/j.yexmp.2008.03.012. [DOI] [PMC free article] [PubMed] [Google Scholar]
- 13.Lee SH, Shin MS, Park WS, Kim SY, Kim HS, Han JY, Park GS, Dong SM, Pi JH, Kim CS, Kim SH, Lee JY, Yoo NJ. Alterations of Fas (Apo-1/CD95) gene in non-small cell lung cancer. Oncogene. 1999;18:3754–3760. doi: 10.1038/sj.onc.1202769. [DOI] [PubMed] [Google Scholar]
- 14.Lee JW, Soung YH, Kim SY, Lee HW, Park WS, Nam SW, Kim SH, Lee JY, Yoo NJ, Lee SH. PIK3CA gene is frequently mutated in breast carcinomas and hepatocellular carcinomas. Oncogene. 2005;24:1477–1480. doi: 10.1038/sj.onc.1208304. [DOI] [PubMed] [Google Scholar]
- 15.Benlloch S, Payá A, Alenda C, Bessa X, Andreu M, Jover R, Castells A, Llor X, Aranda FI, Massutí B. Detection of BRAF V600E mutation in colorectal cancer: comparison of automatic sequencing and real-time chemistry methodology. J Mol Diagn. 2006;8:540–543. doi: 10.2353/jmoldx.2006.060070. [DOI] [PMC free article] [PubMed] [Google Scholar]
- 16.Beau-Faller M, Legrain M, Voegeli AC, Guérin E, Lavaux T, Ruppert AM, Neuville A, Massard G, Wihlm JM, Quoix E, Oudet P, Gaub MP. Detection of K-Ras mutations in tumour samples of patients with non-small cell lung cancer using PNA-mediated PCR clamping. Br J Cancer. 2009;100:985–992. doi: 10.1038/sj.bjc.6604925. [DOI] [PMC free article] [PubMed] [Google Scholar]
- 17.Willmore-Payne C, Holden JA, Wittwer CT, Layfield LJ. The use of EGFR exon 19 and 21 unlabeled DNA probes to screen for activating mutations in non-small cell lung cancer. J Biomol Tech. 2008;19:217–224. [PMC free article] [PubMed] [Google Scholar]
- 18.Däbritz J, Hänfler J, Preston R, Stieler J, Oettle H. Detection of Ki-ras mutations in tissue and plasma samples of patients with pancreatic cancer using PNA-mediated PCR clamping and hybridisation probes. Br J Cancer. 2005;92:405–412. doi: 10.1038/sj.bjc.6602319. [DOI] [PMC free article] [PubMed] [Google Scholar]
- 19.Chen CY, Shiesh SC, Wu SJ. Rapid detection of K-ras mutations in bile by peptide nucleic acid-mediated PCR clamping and melting curve analysis: comparison with restriction fragment length polymorphism analysis. Clin Chem. 2004;50:481–489. doi: 10.1373/clinchem.2003.024505. [DOI] [PubMed] [Google Scholar]
- 20.Downward J. Targeting RAS signalling pathways in cancer therapy. Nat Rev Cancer. 2003;3:11–22. doi: 10.1038/nrc969. [DOI] [PubMed] [Google Scholar]
- 21.Levine AJ. p53, the cellular gatekeeper for growth and division. Cell. 1997;88:323–331. doi: 10.1016/s0092-8674(00)81871-1. [DOI] [PubMed] [Google Scholar]
- 22.Paez JG, Jänne PA, Lee JC, Tracy S, Greulich H, Gabriel S, Herman P, Kaye FJ, Lindeman N, Boggon TJ, Naoki K, Sasaki H, Fujii Y, Eck MJ, Sellers WR, Johnson BE, Meyerson M. EGFR mutations in lung cancer: correlation with clinical response to gefitinib therapy. Science. 2004;304:1497–1500. doi: 10.1126/science.1099314. [DOI] [PubMed] [Google Scholar]
- 23.Davies H, Bignell GR, Cox C, Stephens P, Edkins S, Clegg S, Teague J, Woffendin H, Garnett MJ, Bottomley W, Davis N, Dicks E, Ewing R, Floyd Y, Gray K, Hall S, Hawes R, Hughes J, Kosmidou V, Menzies A, Mould C, Parker A, Stevens C, Watt S, Hooper S, Wilson R, Jayatilake H, Gusterson BA, Cooper C, Shipley J, Hargrave D, Pritchard-Jones K, Maitland N, Chenevix-Trench G, Riggins GJ, Bigner DD, Palmieri G, Cossu A, Flanagan A, Nicholson A, Ho JW, Leung SY, Yuen ST, Weber BL, Seigler HF, Darrow TL, Paterson H, Marais R, Marshall CJ, Wooster R, Stratton MR, Futreal PA. Mutations of the BRAF gene in human cancer. Nature. 2002;417:949–954. doi: 10.1038/nature00766. [DOI] [PubMed] [Google Scholar]
- 24.Kralovics R, Passamonti F, Buser AS, Teo SS, Tiedt R, Passweg JR, Tichelli A, Cazzola M, Skoda RC. A gain-of-function mutation of JAK2 in myeloproliferative disorders. N Engl J Med. 2005;352:1779–1790. doi: 10.1056/NEJMoa051113. [DOI] [PubMed] [Google Scholar]
- 25.Samuels Y, Wang Z, Bardelli A, Silliman N, Ptak J, Szabo S, Yan H, Gazdar A, Powell SM, Riggins GJ, Willson JK, Markowitz S, Kinzler KW, Vogelstein B, Velculescu VE. High frequency of mutations of the PIK3CA gene in human cancers. Science. 2004;304:554. doi: 10.1126/science.1096502. [DOI] [PubMed] [Google Scholar]
- 26.Parsons DW, Jones S, Zhang X, Lin JC, Leary RJ, Angenendt P, Mankoo P, Carter H, Siu IM, Gallia GL, Olivi A, McLendon R, Rasheed BA, Keir S, Nikolskaya T, Nikolsky Y, Busam DA, Tekleab H, Diaz LA, Jr, Hartigan J, Smith DR, Strausberg RL, Marie SK, Shinjo SM, Yan H, Riggins GJ, Bigner DD, Karchin R, Papadopoulos N, Parmigiani G, Vogelstein B, Velculescu VE, Kinzler KW. An integrated genomic analysis of human glioblastoma multiforme. Science. 2008;321:1807–1812. doi: 10.1126/science.1164382. [DOI] [PMC free article] [PubMed] [Google Scholar]