

Abstract
Analysis of the movement of a complex visual stimulus is expressed in the responses of pattern-direction-selective neurons in area MT, which depend in turn on directionally selective inputs from area V1. How do MT neurons integrate their inputs? Pattern selectivity in MT breaks down when the gratings comprising a moving plaid are presented to non-overlapping regions of the (monocular) receptive field. Here we ask an analogous question, is pattern selectivity maintained when the component gratings are presented dichoptically to binocular MT neurons? We recorded from single units in area MT, measuring responses to monocular gratings and plaids, and to dichoptic plaids in which the components are presented separately to each eye. Neurons that are pattern selective when tested monocularly lose this selectivity when stimulated with dichoptic plaids. When human observers view these same stimuli, dichoptic plaids induce binocular rivalry. Yet motion signals from each eye can be integrated despite rivalry, revealing a dissociation of form and motion perception. These results reveal the role of monocular mechanisms in the computation of pattern motion in single neurons, and demonstrate that the perception of motion is not fully represented by the responses of individual MT neurons.
Introduction
Superimposing two gratings that drift in different directions creates a plaid drifting in a direction different from either of the component gratings (Adelson and Movshon, 1982). The analysis of this “pattern motion” results from at least two stages of motion computation. The first stage analyzes the motion of contours normal to their orientation, and is believed to occur in primary visual cortex (V1). The second stage combines signals from the first stage to compute pattern motion, and is thought to occur in area MT (V5), where neurons that show invariant direction tuning for one- and two-dimensional stimuli (gratings and plaids, respectively) are first encountered (Movshon et al., 1985). This suggests that the responses of pattern-selective neurons in MT might be the basis for the perception of pattern motion (Clark et al., 2008).
Neurons in MT have large receptive fields, and almost all are driven strongly by stimuli presented to either eye (Zeki, 1974; Maunsell and Van Essen, 1983). How are motion signals arriving from different sources integrated within the large binocular receptive fields of MT neurons? Recently we showed that pattern-direction selectivity in MT breaks down when the component gratings of a plaid are presented to non-overlapping regions of the monocular receptive field (Majaj et al., 2007b). Here we ask an analogous question, is pattern selectivity maintained when gratings drifting in different directions are presented dichoptically to binocular MT neurons?
We measured responses of single units in area MT to monocular gratings and plaids, and to dichoptic plaids in which the components are presented separately to each eye. Neurons that were pattern selective when tested monocularly lost this selectivity when stimulated with dichoptic plaids. We showed comparable stimuli to human observers. Subjects experienced binocular rivalry (Blake and Logothetis, 2002) when viewing dichoptic plaids. Despite this, motion signals from each eye were often integrated during rivalry, revealing a dissociation of form and motion perception, as first demonstrated by Andrews and Blakemore (1999). These results reveal the role of monocular mechanisms in the computation of pattern motion in single neurons, and demonstrate that the perception of motion is not always consistent with the responses of individual MT neurons.
Materials and Methods
Electrophysiology.
We recorded extracellularly from single units in area MT of two cynomolgus monkeys (Macaca fascicularis) and one pig-tailed macaque (Macaca nemestrina), ranging in weight from 3 to 4.8 kg. The techniques used in our laboratory for recording from the visual cortex of anesthetized, paralyzed monkeys have been reported in detail previously (Smith et al., 2005; Solomon and Lennie, 2005). All procedures complied with guidelines approved by the New York University Animal Welfare Committee.
Stimulus generation and data acquisition.
Visual stimuli were generated by the same Macintosh computer that recorded spikes. They were displayed on a calibrated Eizo T966 monitor at a resolution of 1280 by 960 pixels and a video frame rate of 120 Hz. The monitor was placed 57 cm from the animal's eye, where it subtended 40° by 30° of visual angle. We initially determined the location and size of the left and right eye receptive fields on a tangent projection screen, after which they were independently positioned onto separate halves of the video monitor using mirrors. The two fields were separated by ∼15° on the monitor, and arranged such that each eye could not see the half of the screen viewed by the other eye. All MT cells had receptive fields centered within 15° of the fovea, the great majority near 10°.
We presented luminance modulated grating and plaid stimuli, windowed through circular apertures, on a gray background. The space- and time-averaged luminance of the stimuli was 33 cd/m2, and matched that of the background. For each cell, we determined—using monocularly presented stimuli—the direction, spatial frequency, temporal frequency, and size of the luminance-modulated sine wave that evoked the strongest response from the cell. All stimuli, including a blank (mean gray) interval, were presented for 333 ms, interleaved in pseudorandom order with no interstimulus interval, and centered over the measured receptive field center in each eye. To remove the influence of any neuronal sensitivity to the relative phase of the components of the plaids, we separately randomized the spatial phase of each component grating comprising the monocular and dichoptic plaid stimuli. The fact that the two gratings presented separately to each eye differed in orientation by 60° ensured that the binocular correspondence between the two gratings was limited to very small local regions and that the dichoptic plaid stimuli contained no meaningful (global) interocular disparity. Each stimulus was typically repeated 25 times, though the actual number of presentations was chosen for each cell based on the variability of its response (range 15–50). In early experiments, this initial characterization was done exclusively through the dominant eye (21 of 67 recorded cells); in later experiments, both eyes were mapped concurrently using interleaved monocular stimulus presentations (46 of 67 recorded cells). Tuning in each eye was usually very similar; in the few cases where there was some interocular discrepancy, we chose stimulus parameters that evoked robust responses through either eye for subsequent experiments.
We studied each cell's direction selectivity using three patterns: gratings, monocular plaids, and dichoptic plaids. The Michelson contrast of the component gratings was 0.5. For gratings and monocular plaids, we tested each eye separately. Plaids were composed of two superimposed gratings whose direction and orientation differed by 120°. For dichoptic plaids, we presented the separate components of the plaid to either eye (the orientation of right eye stimulus always equaled the orientation of the left eye stimulus +120°). The stimuli—usually 5° in diameter—were always positioned on the mapped locations of the receptive field centers for each eye. We did not establish whether these positions corresponded exactly on the left and right retinae, but given the precision with which the targets were placed monocularly, any misalignment would have been only a small fraction of the receptive field diameter. All five patterns (left and right eye gratings, left and right eye plaids, and dichoptic plaids) were presented drifting in 12 directions of motion, along with 12 blank intervals (used to estimate the spontaneous discharge) in which the screen was held at the mean luminance. These 72 stimuli were all interleaved in a single experimental block according to the temporal procedure described above.
Analysis of neuronal responses.
We determined response latency as described previously (Smith et al., 2005). Briefly, for each neuron, we computed the mean firing rate for each of the 72 stimuli in a sliding window of duration 333 ms (the stimulus duration) beginning Δt ms after stimulus onset. Latency was estimated as the Δt value that maximized the variance of the resulting spike rates across stimulus conditions. Our analysis of directional selectivity was conventional (Movshon et al., 1985; Smith et al., 2005). Using each cell's directional tuning for gratings, we constructed predictions of responses to plaids for idealized pattern-direction-selective and component-direction-selective cells. For dichoptic plaids, the predictions were based on the separate grating tuning curves measured for each eye (Fig. 1a). We computed partial correlations of the actual responses with the predicted tuning curves (Movshon et al., 1985; Smith et al., 2005) and transformed them into normal deviates using Fisher's r-to-Z transformation (Smith et al., 2005).
Figure 1.
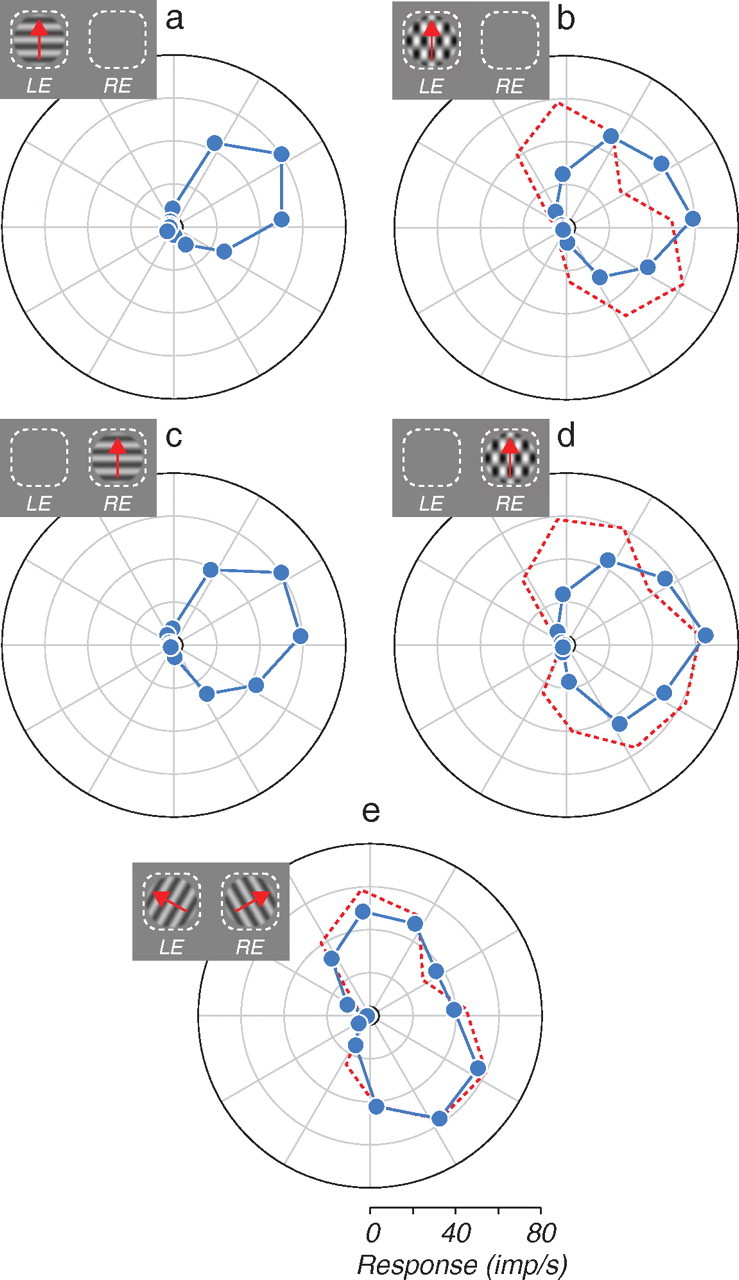
Polar plots of the responses of an example MT cell to monocular gratings and plaids, and to dichoptic plaids. Insets indicate the stimulus configuration; dashed white lines indicate the left and right eye receptive fields. Small black circles indicate spontaneous firing rate. a, c, Monocular direction tuning curves for gratings. b, d, Monocular direction tuning curves for plaids. e, Direction tuning curves for dichoptic plaids. The dashed red curves in b, d, and e indicate the predicted response for a component-selective cell.
Psychophysics.
We presented gratings and plaids on a calibrated Iiyama HD514 monitor at a resolution of 800 by 600 pixels and a video frame rate of 200 Hz. Mean luminance was 30 cd/m2. The stimuli were viewed dichoptically via a stereoscope at a distance of 57 cm; each eye's view of the monitor subtended 19° by 28°. Gratings and plaids (component gratings: contrast 0.5, spatial frequency 1 c/deg, drift rate 2 Hz; plaid angle: 120°) were vignetted by soft-edged circular apertures of 4° diameter, centered at an eccentricity of 4°. A fixation cross was presented continuously, as were four white bars (0.1° by 0.4°) arranged concentrically around the stimulus region to identify the stimulus location and to ensure correct alignment of the eyes (see Fig. 3). Each trial began with an audible tone, followed 250 ms later by presentation of a drifting monocular or dichoptic plaid. Stimuli were presented for 250 ms, and contrast was modulated with a raised-cosine temporal envelope. The direction of motion on each trial was selected randomly from a uniform distribution through 360°. Subjects indicated the perceived direction of motion by rotating, via the mouse wheel, a subsequently presented arrow, and then initiated the next trial via a key press. Monocular and dichoptic plaids were randomly interleaved throughout a given experimental block. This procedure is essentially a modification of the dichoptic plaid experiment first performed by Andrews and Blakemore (1999), adapted to more closely parallel the physiological methods used here. All subjects (two of the authors and one naive observer) completed at least 80 trials each of monocular and dichoptic plaids.
Figure 3.

The distribution of the perceived direction of motion reported by human observers viewing monocular and dichoptic plaids (see Materials and Methods). a, c, Distribution of the perceived direction of motion for monocular plaids (see icons), expressed relative to the true pattern direction, for individual subjects (a) and averaged across subjects (c). b, d, Distribution of the perceived direction of motion for dichoptic plaids for individual subjects (b) and averaged across subjects (d).
Results
Electrophysiology
We made extracellular recordings from 67 MT neurons in three anesthetized macaque monkeys. We classified cells as pattern- or component-direction selective by comparing direction tuning curves for monocularly presented gratings and plaids (see Materials and Methods) (Movshon et al., 1985; Smith et al., 2005). For a canonical pattern cell, direction tuning curves are the same for gratings and plaids. If, however, a cell is selective for the direction of motion of the one-dimensional gratings comprising the plaid (component selective), it will respond well when either component of the plaid is moving in the cell's preferred direction. For such a cell the predicted tuning curve for plaids is the sum of the responses to the two components separately, and typically has two peaks that straddle the direction of pattern motion (Fig. 1, dashed curves).
The monocularly measured tuning curves for an example MT neuron (Fig. 1a–d) show similar selectivity for gratings (Fig. 1a,c) and 120° plaids (Fig. 1b,d, blue lines), measured through either eye. The cell was therefore pattern-direction selective in each eye. To test the binocular integration properties of the neuron, we measured responses to dichoptic plaids (Fig. 1e). The pattern-direction selectivity observed monocularly broke down under dichoptic conditions—the dichoptic plaid tuning curve (Fig. 1e, blue lines) has two peaks separated by 120°, conforming closely to the prediction of component-direction selectivity (dashed red lines).
We quantified the degree of pattern selectivity in individual cells by calculating the Z-transformed partial correlation coefficients between the observed plaid responses and the predictions for “component” and “pattern” selectivity (Movshon et al., 1985; Smith et al., 2005). The distribution of these correlation values measured with monocular plaids for all the cells in our sample reveals a distribution of pattern and component selectivity similar to those previously reported (Movshon et al., 1985; Rodman and Albright, 1989; Smith et al., 2005; Rust et al., 2006; Majaj et al., 2007b) (Fig. 2a). We plot the means of the values for each eye, which were always very similar. The plot is divided into three regions by the thick gray lines. Points falling in the blue region label “component” cells whose component correlation coefficient significantly exceeded either zero or the pattern correlation coefficient, whichever was larger. Similarly, points falling in the red region label “pattern” cells. Cells falling in between these regions are unclassified by this method (black symbols). The data point with the heavy yellow outline, which lies within the “pattern” region, identifies the example cell (Fig. 1). For monocular plaids (Fig. 2a), 27% of cells (18/66) were classified as pattern selective and 47% of cells (31/66) as component selective; 26% of cells (17/66) were unclassified.
Figure 2.
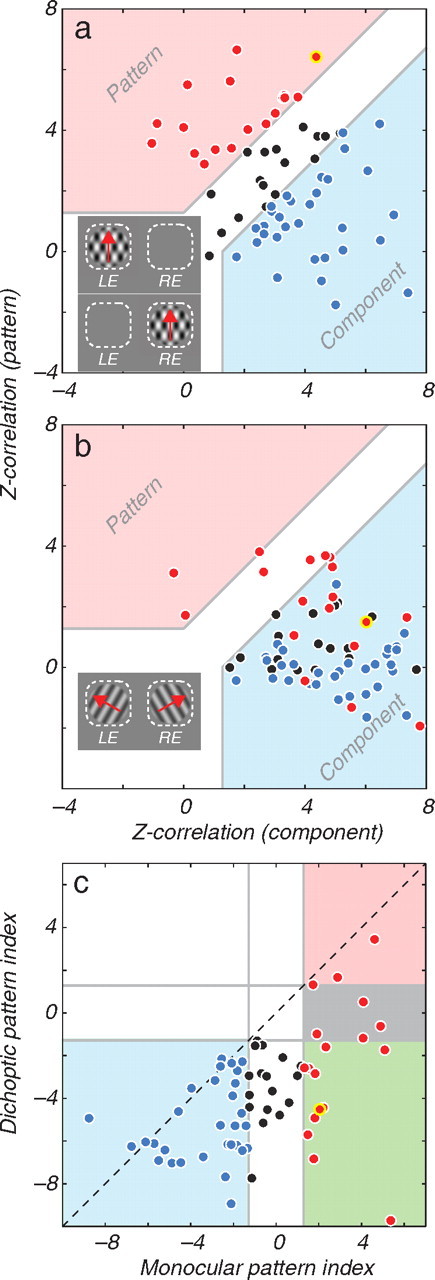
Summary of the result across the population. a, The degree to which cells are selective for the direction of pattern motion or of the individual components as determined with monocular stimuli. The Z-transformed partial correlations between the data and the “component” and “pattern” predictions are plotted against one another. The space is divided into regions in which cells are classified as pattern selective (red region and symbols) or component selective (blue region and symbols). Cells falling outside of these regions remain unclassified by this method (black symbols). b, Pattern selectivity measured with dichoptic plaids, for the cells shown in a. Each datum retains its color according to its classification in a. c, The distribution of pattern indices measured with monocular and dichoptic plaids. Cells plotting at lower left (shaded blue) or upper right (shaded red) are classified as component selective or pattern selective, respectively, for both types of stimuli. Cells in the green and gray regions were pattern selective monocularly, but become component selective or unclassified, respectively, with dichoptic stimuli. Each datum retains its color according to its classification in a.
The breakdown of pattern selectivity under dichoptic stimulation shown by the example (Fig. 1) was typical. The Z-transformed partial correlation values obtained for dichoptic plaids for our population (Fig. 2b) reveal this shift; the datum for each cell retains the color code given by the classification with monocular plaids. Separating the components of the plaid between the eyes resulted in a dramatic shift in the distribution of the data points toward the component region in this space.
To characterize the relative component and pattern selectivity, we used a pattern index, given by the difference between the Z-transformed pattern and component correlation coefficients (Zp − Zc) (Smith et al., 2005); this is the distance of each datum from the identity diagonal in Figure 2, a and b. The change in neuronal selectivity under dichoptic conditions is readily visualized by plotting the dichoptic pattern index against the mean monocular pattern index for each cell (Fig. 2c). The cloud of data lies below the diagonal, indicating that virtually all cells became more component-like with dichoptic stimulation. The percentage of cells classified as component selective increased to 89% (59 of 66 cells) when dichoptic plaids were used, compared with 47% for monocular plaids. Eleven of eighteen cells classified monocularly as pattern selective became component selective dichoptically, but only three of these eighteen remained pattern selective dichoptically.
Dichoptic stimuli that rival at high contrasts sometimes fuse at low contrasts (Liu et al., 1992). We wondered whether the rivalrous conditions at high contrast contributed to the failure of our neurons to integrate motion information binocularly. In 17 cells, we therefore performed the same measurements again using gratings and plaids constructed from components of low contrast (mean 0.17), chosen to reduce the responses of each cell by ∼50%. Six of these cells were monocularly pattern selective, and all became component selective when tested with the low contrast dichoptic plaids.
Most cells in MT are sensitive to binocular disparity (Maunsell and Van Essen, 1983), and we wondered whether sensitivity to the relative interocular phase of the component gratings comprising the dichoptic plaids contributed to the breakdown of pattern selectivity we observed. For each cell, we identified the dichoptic plaid direction evoking the largest response, recovered the response and interocular phase on each trial for that particular direction, and calculated the binocular interaction index (BII), a measure of the strength of a neuron's sensitivity to binocular phase disparity (Ohzawa and Freeman, 1986). An index of 0 indicates that the interocular phase-tuning function is flat; an index of 1 indicates that response fell to 0 at the interocular phase 180° away from that evoking the maximal response. Across all cells, the geometric mean BII for dichoptic plaids was 0.14; among the subset of cells classified monocularly as pattern selective, the geometric mean BII was 0.13. By the criteria of Ohzawa and Freeman (1986), none of the cells in our sample was classified as (interocular) phase specific for the dichoptic plaid stimulus. This was doubtless due to the large (120°) difference in the direction of the two gratings—when we measured BII with gratings of optimal direction, half of the cells in our sample (and half the pattern-selective cells) were classified as phase specific. The reduction in binocular interaction for stimuli whose orientations differed in the two eyes has also been observed in V1 (Smith et al., 1997). We conclude that the failure of binocular motion integration observed here is not due to interocular phase sensitivity to the dichoptic plaids.
Psychophysics
Under many conditions, neuronal activity in MT is closely associated with the perception of visual motion (Newsome and Pare, 1988; Salzman et al., 1990; Britten et al., 1996). We therefore wondered whether the breakdown of pattern selectivity observed in MT under dichoptic stimulus conditions has a parallel in the perceptual experience of human observers viewing comparable stimuli (Andrews and Blakemore, 1999).
We presented brief (250 ms) monocular and dichoptic plaids to three observers. The stimulated eye(s) and the directions of motion were assigned randomly on each trial (see Materials and Methods). Subjects judged the direction of stimulus motion after each trial. As expected, the distributions of the reported directions of motion with respect to the true direction of pattern motion for monocular plaids were tightly concentrated near the true pattern direction (individual subjects, Fig. 3a; mean of all subjects, Fig. 3c), and subjects always reported seeing complete plaid patterns. With dichoptic plaids subjects reported rivalry, perceiving either a single grating throughout a given trial or, less often, a grating “patchwork” comprised of contiguous regions of the two monocular stimuli; in no case was a fused plaid perceived (Andrews and Blakemore, 1999, 2002). If the motion percept depended on the perceived form, the perceived direction distribution would have been bimodal, with peaks at ±60° (the direction of motion of the component gratings). These directions were reported on approximately one-third of the trials (individual subjects, Fig. 3b; mean of all subjects, Fig. 3d), but more than half the reports were close to 0°, showing that on most trials subjects perceived motion in the pattern direction despite seeing only one grating. So, while monocular form signals compete for perceptual awareness, monocular motion signals are integrated to yield perceived motion in the “pattern” direction (Andrews and Blakemore, 1999; Cobo-Lewis et al., 2000).
Discussion
The pattern selectivity of single neurons in area MT breaks down under dichoptic conditions (Figs. 1, 2), indicating that the computations that underlie pattern selectivity depend on monocular mechanisms. Psychophysical observations show that dichoptically presented motion signals can be integrated to compute pattern motion, even under rivalrous conditions (Andrews and Blakemore, 1999; Cobo-Lewis et al., 2000; Andrews and Blakemore, 2002) (Fig. 3). These results are important for two reasons: they throw further light on the neuronal mechanisms of motion integration, and they call into question the widely held assumption that the activity of MT neurons forms the basis for our perceptual experience of motion (Block, 2005).
Signal integration in MT
How are component motion signals integrated to yield pattern selectivity in the large, binocular receptive fields of MT neurons? According to a recent model (Rust et al., 2006), pattern selectivity arises in MT through the combined action of four elemental computations: two localized contrast gain controls—one isotropic and the other selective for orientation and direction, opponent motion suppression, and the broad convergence of signals from cells with differing preferred directions. These computations take place in a distributed neuronal circuit, involving elements both within and afferent to MT.
The breakdown of pattern selectivity under dichoptic conditions (Fig. 2) indicates that some, if not all, of these computations are monocular. For a computation to be monocular, it must be implemented at a level of the visual system where monocular neurons (or their axons) are present. Essentially all cells in MT are binocular (Maunsell and Van Essen, 1983), as are the V1 neurons that project to MT (Movshon and Newsome, 1996). So even though pattern selectivity first emerges in MT, it seems likely that at least some of the machinery on which it depends lies earlier in the visual pathway.
Monocular gain controls are present as early as the M cells in primate retina (Benardete and Kaplan, 1999), which project, via layers IVcα and IVb of V1, to MT (Sawatari and Callaway, 1996). The isotropic contrast gain control measured in V1 (DeAngelis et al., 1994; Carandini et al., 1997) is principally monocular, even in binocular neurons (Truchard et al., 2000; Kraft et al., 2001). The selective gain control may correspond to the suppressive surround observed in many V1 neurons (Cavanaugh et al., 2002), and surround suppression is strongest under monocular stimulus conditions, though it can also act dichoptically (DeAngelis et al., 1994; Webb et al., 2005). Single-unit recordings in MT show that motion opponency, which is first expressed in strongly direction-selective V1 neurons (Rust et al., 2002), is monocular (Majaj et al., 2007a), so the suppressive influence of inputs from neurons tuned to nonpreferred directions would act monocularly as well (Simoncelli and Heeger, 1998; Rust et al., 2006). Thus three of the four elements that by their concerted action generate pattern selectivity (Rust et al., 2006) are at least partly monocular. Attenuation of these suppressive mechanisms would therefore be expected to break down pattern selectivity, and that is what we observed when we appropriately modify the parameters of the model (Fig. 4). The dependence of these suppressive mechanisms on monocular processing explains why a property that first emerges in MT, a strongly binocular area, is disrupted under dichoptic viewing.
Figure 4.
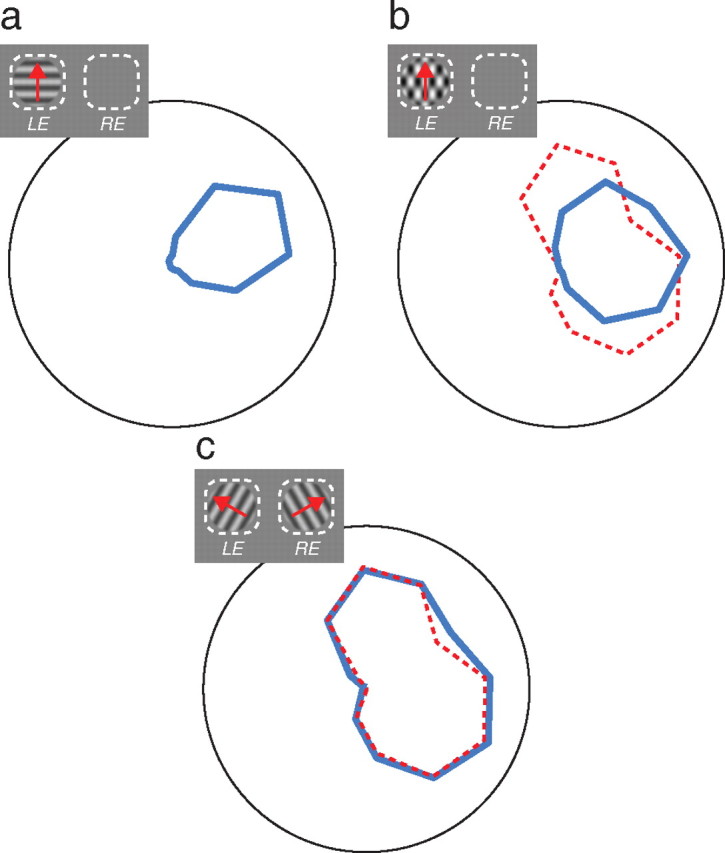
Pattern selectivity in simulated neurons breaks down with monocular gain controls and attenuation of opponent mechanisms. We fit all of the tuning curves from the example cell of Figure 1 with the model presented in Rust et al. (2006) using a single set of parameters, assuming strictly monocular gain controls and reduced inhibitory weights (opponency) under dichoptic stimulation (40% of their monocular weight). a, The mean (across eyes) of the model fits to the monocular grating responses of the example cell. b, The mean (across eyes) of the model fits to the monocular plaid responses of the example cell. The predicted response of a component-direction-selective cell is shown in red. c, The model fit to the dichoptic plaid responses of the example cell. The component cell prediction is again shown in red.
The loss of pattern selectivity under dichoptic conditions is analogous to that observed when the components of pattern motion are confined to separate regions of the MT receptive field (Majaj et al., 2007b). Together, these results demonstrate that important elements of the computation of pattern motion—a computation that is first expressed in MT, and constitutes a fundamental elaboration within the motion processing system—depend on operations performed by monocular neurons with small receptive fields, presumably in areas such as the LGN, V1, and V2 that process information before it reaches MT.
Physiological correlates of motion perception
There is substantial evidence that the responses of directionally selective neurons in area MT support many aspects of visual motion perception, including the perception of coherent motion in plaid patterns (Newsome and Pare, 1988; Salzman et al., 1990; Britten et al., 1996; Block, 2005; Clark et al., 2008). Our results, however, suggest that this close relationship is not inviolable—under dichoptic viewing conditions, motion can be clearly seen that is not directly reflected in the activity of MT neurons.
While previous studies have documented dissociations between perception and neural activity in MT for different stimulus configurations (Shadlen et al., 1993; Churan and Ilg, 2001; Hedges et al., 2004; Pack et al., 2004), the dissociation that we report stands out because it bears directly on the pattern computation, a computation thought to be central to what MT neurons contribute to the dorsal stream.
One might argue that the conditions of our experiments, with recordings made under anesthesia, prevent the expression of dichoptic pattern motion selectivity by MT cells. This seems unlikely, given that pattern selectivity was discovered and described in MT neurons recorded from anesthetized cortex (Movshon et al., 1985), and given that the prevalence of pattern selectivity in MT is very similar in anesthetized and awake animals (Movshon et al., 1985; Stoner and Albright, 1992; Clark et al., 2008). It is, however, clear that MT responses can be modulated in relation to an animal's perceptual state (Logothetis and Schall, 1989; Stoner and Albright, 1992; Duncan et al., 2000; Clark et al., 2008), presumably by signals from areas involved in higher levels of perceptual analysis. We cannot exclude the possibility that such “top-down” signals would be observed under our viewing conditions in alert animals, but our results suggest that the basic “bottom-up” combination of monocular component motion signals to yield dichoptic pattern motion does not occur in area MT.
Footnotes
This work was supported by grants from National Institutes of Health (EY 2017 and EY 4440). We are grateful to N. Dhruv, S. Sokol, and Y. El-Shamayleh for assistance during experiments.
References
- Adelson EH, Movshon JA. Phenomenal coherence of moving visual patterns. Nature. 1982;300:523–525. doi: 10.1038/300523a0. [DOI] [PubMed] [Google Scholar]
- Andrews TJ, Blakemore C. Form and motion have independent access to consciousness. Nat Neurosci. 1999;2:405–406. doi: 10.1038/8068. [DOI] [PubMed] [Google Scholar]
- Andrews TJ, Blakemore C. Integration of motion information during binocular rivalry. Vision Res. 2002;42:301–309. doi: 10.1016/s0042-6989(01)00286-3. [DOI] [PubMed] [Google Scholar]
- Benardete EA, Kaplan E. The dynamics of primate M retinal ganglion cells. Vis Neurosci. 1999;16:355–368. doi: 10.1017/s0952523899162151. [DOI] [PubMed] [Google Scholar]
- Blake R, Logothetis NK. Visual competition. Nat Rev Neurosci. 2002;3:13–21. doi: 10.1038/nrn701. [DOI] [PubMed] [Google Scholar]
- Block N. Two neural correlates of consciousness. Trends Cogn Sci. 2005;9:46–52. doi: 10.1016/j.tics.2004.12.006. [DOI] [PubMed] [Google Scholar]
- Britten KH, Newsome WT, Shadlen MN, Celebrini S, Movshon JA. A relationship between behavioral choice and the visual responses of neurons in macaque MT. Vis Neurosci. 1996;13:87–100. doi: 10.1017/s095252380000715x. [DOI] [PubMed] [Google Scholar]
- Carandini M, Heeger DJ, Movshon JA. Linearity and normalization in simple cells of the macaque primary visual cortex. J Neurosci. 1997;17:8621–8644. doi: 10.1523/JNEUROSCI.17-21-08621.1997. [DOI] [PMC free article] [PubMed] [Google Scholar]
- Cavanaugh JR, Bair W, Movshon JA. Selectivity and spatial distribution of signals from the receptive field surround in macaque v1 neurons. J Neurophysiol. 2002;88:2547–2556. doi: 10.1152/jn.00693.2001. [DOI] [PubMed] [Google Scholar]
- Churan J, Ilg UJ. Processing of second-order motion stimuli in primate middle temporal area and medial superior temporal area. J Opt Soc Am A Opt Image Sci Vis. 2001;18:2297–2306. doi: 10.1364/josaa.18.002297. [DOI] [PubMed] [Google Scholar]
- Cobo-Lewis AB, Gilroy LA, Smallwood TB. Dichoptic plaids may rival, but their motions can integrate. Spat Vis. 2000;13:415–429. doi: 10.1163/156856800741298. [DOI] [PubMed] [Google Scholar]
- DeAngelis GC, Freeman RD, Ohzawa I. Length and width tuning of neurons in the cat's primary visual cortex. J Neurophysiol. 1994;71:347–374. doi: 10.1152/jn.1994.71.1.347. [DOI] [PubMed] [Google Scholar]
- Duncan RO, Albright TD, Stoner GR. Occlusion and the interpretation of visual motion: perceptual and neuronal effects of context. J Neurosci. 2000;20:5885–5897. doi: 10.1523/JNEUROSCI.20-15-05885.2000. [DOI] [PMC free article] [PubMed] [Google Scholar]
- Hedges JH, Kohn A, Saint TC, Rust NC, Shadlen MN, Movshon JA. Neurons in macaque MT signal local but not global motion. Soc Neurosci Abstr. 2004;30:526–522. [Google Scholar]
- Kraft JM, Peirce JW, Forte JD, Krauskopf J, Lennie P. Nonlinear combination of binocular signals in macaque cortex. J Vis. 2001;1:274a. [Google Scholar]
- Liu L, Tyler CW, Schor CM. Failure of rivalry at low contrast: evidence of a suprathreshold binocular summation process. Vision Res. 1992;32:1471–1479. doi: 10.1016/0042-6989(92)90203-u. [DOI] [PubMed] [Google Scholar]
- Logothetis NK, Schall JD. Neuronal correlates of subjective visual perception. Science. 1989;245:761–763. doi: 10.1126/science.2772635. [DOI] [PubMed] [Google Scholar]
- Majaj NJ, Tailby C, Movshon JA. Motion opponency in area MT of the macaque is mostly monocular. J Vis. 2007a;7:96a. [Google Scholar]
- Majaj NJ, Carandini M, Movshon JA. Motion integration by neurons in macaque MT is local, not global. J Neurosci. 2007b;27:366–370. doi: 10.1523/JNEUROSCI.3183-06.2007. [DOI] [PMC free article] [PubMed] [Google Scholar]
- Maunsell JH, Van Essen DC. Functional properties of neurons in middle temporal visual area of the macaque monkey. II. Binocular interactions and sensitivity to binocular disparity. J Neurophysiol. 1983;49:1148–1167. doi: 10.1152/jn.1983.49.5.1148. [DOI] [PubMed] [Google Scholar]
- Movshon JA, Newsome WT. Visual response properties of striate cortical neurons projecting to area MT in macaque monkeys. J Neurosci. 1996;16:7733–7741. doi: 10.1523/JNEUROSCI.16-23-07733.1996. [DOI] [PMC free article] [PubMed] [Google Scholar]
- Movshon JA, Adelson EH, Gizzi MS, Newsome WT. The analysis of visual moving patterns. In: Chagas C, Gattass R, Gross C, editors. Pattern recognition mechanisms. New York: Springer; 1985. pp. 117–151. [Google Scholar]
- Newsome WT, Paré EB. A selective impairment of motion perception following lesions of the middle temporal visual area (MT) J Neurosci. 1988;8:2201–2211. doi: 10.1523/JNEUROSCI.08-06-02201.1988. [DOI] [PMC free article] [PubMed] [Google Scholar]
- Ohzawa I, Freeman RD. The binocular organization of simple cells in the cat's visual cortex. J Neurophysiol. 1986;56:221–242. doi: 10.1152/jn.1986.56.1.221. [DOI] [PubMed] [Google Scholar]
- Pack CC, Gartland AJ, Born RT. Integration of contour and terminator signals in visual area MT of alert macaque. J Neurosci. 2004;24:3268–3280. doi: 10.1523/JNEUROSCI.4387-03.2004. [DOI] [PMC free article] [PubMed] [Google Scholar]
- Rodman HR, Albright TD. Single-unit analysis of pattern-motion selective properties in the middle temporal visual area (MT) Exp Brain Res. 1989;75:53–64. doi: 10.1007/BF00248530. [DOI] [PubMed] [Google Scholar]
- Rust NC, Majaj N, Simoncelli E, Movshon JA. Gain control in macaque area MT is directionally selective. Soc Neurosci Abstr. 2002;28:657–610. [Google Scholar]
- Rust NC, Mante V, Simoncelli EP, Movshon JA. How MT cells analyze the motion of visual patterns. Nat Neurosci. 2006;9:1421–1431. doi: 10.1038/nn1786. [DOI] [PubMed] [Google Scholar]
- Salzman CD, Britten KH, Newsome WT. Cortical microstimulation influences perceptual judgements of motion direction. Nature. 1990;346:174–177. doi: 10.1038/346174a0. [DOI] [PubMed] [Google Scholar]
- Sawatari A, Callaway EM. Convergence of magno- and parvocellular pathways in layer 4B of macaque primary visual cortex. Nature. 1996;380:442–446. doi: 10.1038/380442a0. [DOI] [PubMed] [Google Scholar]
- Shadlen MN, Newsome WT, Zohary E, Britten KH. Integration of local motion signals in area MT. Soc Neurosci Abstr. 1993;19:1282. [Google Scholar]
- Simoncelli EP, Heeger DJ. A model of neuronal responses in visual area MT. Vision Res. 1998;38:743–761. doi: 10.1016/s0042-6989(97)00183-1. [DOI] [PubMed] [Google Scholar]
- Smith EL, 3rd, Chino YM, Ni J, Ridder WH, 3rd, Crawford ML. Binocular spatial phase tuning characteristics of neurons in the macaque striate cortex. J Neurophysiol. 1997;78:351–365. doi: 10.1152/jn.1997.78.1.351. [DOI] [PubMed] [Google Scholar]
- Smith MA, Majaj NJ, Movshon JA. Dynamics of motion signaling by neurons in macaque area MT. Nat Neurosci. 2005;8:220–228. doi: 10.1038/nn1382. [DOI] [PubMed] [Google Scholar]
- Solomon SG, Lennie P. Chromatic gain controls in visual cortical neurons. J Neurosci. 2005;25:4779–4792. doi: 10.1523/JNEUROSCI.5316-04.2005. [DOI] [PMC free article] [PubMed] [Google Scholar]
- Stoner GR, Albright TD. Neural correlates of perceptual motion coherence. Nature. 1992;358:412–414. doi: 10.1038/358412a0. [DOI] [PubMed] [Google Scholar]
- Truchard AM, Ohzawa I, Freeman RD. Contrast gain control in the visual cortex: monocular versus binocular mechanisms. J Neurosci. 2000;20:3017–3032. doi: 10.1523/JNEUROSCI.20-08-03017.2000. [DOI] [PMC free article] [PubMed] [Google Scholar]
- Webb BS, Dhruv NT, Solomon SG, Tailby C, Lennie P. Early and late mechanisms of surround suppression in striate cortex of macaque. J Neurosci. 2005;25:11666–11675. doi: 10.1523/JNEUROSCI.3414-05.2005. [DOI] [PMC free article] [PubMed] [Google Scholar]
- Zeki SM. Functional organization of a visual area in the posterior bank of the superior temporal sulcus of the rhesus monkey. J Physiol. 1974;236:549–573. doi: 10.1113/jphysiol.1974.sp010452. [DOI] [PMC free article] [PubMed] [Google Scholar]