Abstract
Recently, we have proposed a novel strategy for a cell-specific gene therapy system based on responses to intracellular signals. In this system, an intracellular signal that is specifically and abnormally activated in the diseased cells is used for the activation of transgene expression. In this study, we used protein kinase C (PKC)α as a trigger to activate transgene expression. We prepared a PKCα-responsive polymer conjugate [PPC(S)] and a negative control conjugate [PPC(A)], in which the phosphorylation site serine (Ser) was replaced with alanine (Ala). The phosphorylation for polymer/DNA complexes was determined with a radiolabel assay using [γ-32P]ATP. PPC(S)/DNA complexes were phosphorylated by the addition of PKCα, but no phosphorylation of the PPC(A)/DNA complex was observed. Moreover, after microinjection of polymer/GFP-encoding DNA complexes into HepG2 cells at cation/anion (C/A) ratios of 0.5 to 2.0, significant expression of GFP was observed in all cases using PPC(S)/DNA complexes, but no GFP expression was observed in the negative control PPC(A)/DNA complex-microinjected cells at C/A ratios of 1.0 and 2.0. On the other hand, GFP expression from PPC(S)/DNA complexes was completely suppressed in cells pretreated with PKCα inhibitor (Ro31-7549). These results suggest that our gene regulation system can be used for tumor cell-specific expression of a transgene in response to PKCα activity.
Keywords: Intracellular signal, Protein kinase C, Gene delivery, Nanoparticle, Tumor
Introduction
Gene therapy is recognized as a medical approach for the treatment of diseases that are difficult to cure, such as tumors. Several viral and non-viral carriers for gene transfer have been developed for either in vivo or ex vivo/in vitro use [1-4]. The most important viral carriers, characterized in laboratory studies and clinical trials, have been inactivated retroviruses, adenoviruses, adeno-associated viruses, and herpes viruses. These viruses show relatively high transfection efficiency, but have some clinical safety problems. On the other hand, non-viral methods of gene delivery, including cationic lipofection, calcium phosphate precipitation, gene guns, and injection of naked DNA, generally show low transfection efficiency but are not pathogenic [1-4]. However, there is another serious issue regarding the present gene delivery methodologies. Almost all the gene delivery methods currently developed have insufficient ability to specifically recognize and target diseased cells and to distinguish them from normal cells, especially in the same tissue or organ. Thus a number of strategies that address the issue of target-selective gene delivery have been reported. These systems generally involve the use of various ligands that selectively bind to a cell-surface marker on the target cell [5,6].
Living cells contain numerous signal transduction pathways that respond to extracellular signals and regulate or modulate gene expression. Extracellular signals either penetrate the cellular membrane or bind to the extracellular domain of cell surface receptors. The activated receptors are subsequently able to change the amount or intracellular distribution of second messengers through effectors. The second messengers then activate protein targets that finally control gene expression by acting on further downstream targets. In these intracellular signal transduction pathways, phosphorylation by protein kinases plays an important role and functions through the activation of target proteins [7,8].
Protein kinase C (PKC) is a calcium- and phospholipid-dependent serine/threonine kinase. The PKC isozymes are classified into three subfamilies based on structural and activational characteristics: conventional or classic PKCs (cPKCs: α, βI, βII, and γ), novel or non-classic PKCs (nPKCs: δ, ε, η, and θ), and atypical PKCs (ζ, ι, and λ). The activation of cPKCs requires diacylglycerol (DAG) as an activator and phosphatidylserine (PS) and Ca2+ as activation cofactors. The nPKCs are regulated by DAG and PS, but do not require Ca2+ for activation. In the case of atypical PKCs, their activity is stimulated only by PS, and not by DAG and Ca2+[7-10]. Among these PKC families, PKCα is widely expressed in many tissues and plays key roles in the differentiation and proliferation of tumors such as melanoma, hepatoma, and breast cancer. Upon stimulation, PKCα is translocated from the cytosol to the cellular membrane where its subsequent activation by DAG and PS occurs. Increases in the Ca2+ concentration increase PKCα translocation to the cellular membrane, leading to activation of proteins that trigger cellular responses, such as proliferation and differentiation. Extraordinary activation of PKCα has been identified in transformed cell lines and in several cancers [7-10]. If such hyperactivated PKCα can be used for the activation of transgene expression, cancer cell-specific gene regulation becomes possible.
Recently, we have proposed a novel strategy for cell-specific gene therapy. In this strategy, an intracellular signal that is specifically and abnormally activated in the target diseased cells is used for the activation of transgene expression [11,12].
In this study, we prepared two polymers, a PKCα-responsive polymer [PPC(S)] and a negative control polymer [PPC(A)]. Phosphorylation of polymer/DNA complexes was detected using a radiolabel assay. Moreover, polymer/DNA complexes, microinjected into HepG2 cells, were shown to regulate gene expression.
Materials and Methods
Synthesis of the Peptide Substrate
Two peptide substrates, FKKQGSFAKKK and FKKQGAFAKKK, each with a methacryloyl group at the amino-terminus, were synthesized using an automatic peptide synthesizer according to standard Fmoc-chemistry procedures. After treatment with trifluoroacetic acid (TFA), peptides were purified on an Inertsil ODS-3 column (250 × 20 mm, 3.5 μm; GL Sciences Inc., Tokyo, Japan) using a BioCAD Perfusion Chromatography system (Ikemoto Scientific Technology Co., Tokyo, Japan) and a linear A-B gradient at a flow-rate of 8 mL/min, where eluent A was 0.1% TFA in water and eluent B was 0.1% TFA in acetonitrile.
Synthesis of Peptide-Pendant Polymer
Polymers were synthesized as described previously [11,12]. Briefly, acrylamide (8.9 mg, 125 μmol) and N-methacryloylpeptide (7.5 mg, 5.5 μmol), in which the methacryloyl group was attached at the amino terminus of the peptide, were dissolved in water, degassed with nitrogen for 5 min and then polymerized using ammonium persulfate (0.86 mg, 3.74 mmol) and N,N,N′,N′-tetramethylethylenediamine (1.1 μL, 7.38 mmol) as a redox couple at room temperature for 90 min. The synthesized sample was dialyzed against water overnight in a semi-permeable membrane bag with a molecular weight cutoff of 50,000. The dialyzed sample was lyophilized and the final sample was obtained as a white powder. The concentration of the peptide was estimated by elemental analysis.
Phosphorylation Assay for Polymer/DNA Complexes
The phosphorylation reaction of the polymer/DNA complex was quantified by measuring32P transfer from [γ-32P]ATP into the substrate peptide of the polymer, according to the manufacture’s recommendations (Sigma, Louis, MO). The PPC/DNA complexes were prepared by incubation of the PPC with GFP-encoding DNA (pEGFP-C1, Clontech Laboratories, Inc., Mountain View, CA) in 20 mM Tris–HCl buffer solution (pH 7.5) for 15 min at room temperature. Phosphorylation reactions were carried out in 70 μL of buffer {20 mM Tris–HCl, pH 7.5, 10 mM MgCl2, 0.1 mM CaCl2, a mixture of 100 μM ATP and [γ-32P]ATP (1.0 μCi; 6,000 Ci/mmol, GE Healthcare, Buckinghamshire, UK), 100 μg/mL PS, and 20 μg/mL DAG} containing polymer/DNA complexes at cation/anion (C/A) ratios of 1.0 and/or 2.0, and 2 ng/mL recombinant human PKCα (Sigma) for 8 h at 37 °C. The reaction mixture (20 μL) was spotted onto polyvinylidene difluoride transfer membranes (2 × 2 cm2Hybond-P, Amersham Biosciences, Piscataway, NJ). The membranes were washed three times with 5% TCA and the radioactivity on each membrane was determined by liquid scintillation counting.
Western Blot Analysis
HepG2 cells (5 × 10⁵cells) (JCRB1054) were plated in a 100 mm dish and were cultured in Dulbecco’s modified Eagle’s medium (Gibco Invitrogen Co., Grand Island, NY) supplemented with 10% fetal bovine serum, 100 U/mL penicillin, 100 μg/mL streptomycin, and 0.25 μg/mL amphotericin B. The cells were incubated in a humidified atmosphere containing 5% CO2and 95% air at 37 °C. Three days after incubation, the cells were lysed in lysis buffer containing 50 mM Tris–HCl (pH 7.5), 0.15 M NaCl, 1% Nonidet P-40, 2 mM EDTA, 50 mM NaF, and 0.2 mM Na3VO4, supplemented with Complete™ protease inhibitor cocktail (Roche Diagnostics GmbH, Mannheim, Germany) on ice for 15 min. The cell lysate was centrifuged to remove insoluble materials and the lysate was then immunoblotted with anti-PKCα serum (Cell Signaling, Danvers, MA) and anti-phosphoPKCα (Ser657) serum (UPSTATE, Lake Placid, NY). Bound antibodies were visualized by chemiluminescence. A recombinant active human PKCα (1 ng/lane) was used as a positive control.
Cytotoxicity of the Polymer Toward Cells
To identify cytotoxicity of the polymer toward cells, HepG2 cells were incubated in the presence or absence of the polymer (0–30 μg/mL) for 48 h in a 24-well plate. Staining with Trypan Blue (0.4%; Gibco Invitrogen Co.) was used to calculate the percentage of viable cells. A 0.2 mL aliquot of cell suspension in Hanks’ balanced salt solution (Gibco) was added to Trypan Blue Mix (0.5 mL of 0.4% Trypan Blue and 0.3 mL of Hanks’ balanced salt solution) and incubated for 5 min at room temperature. The number of unstained cells and the total number of cells were counted in a hemocytometer. The percent cell viability was calculated by normalizing the cell viability of the treated cells to that of untreated cells.
Microinjection Study
Cells were microinjected at day 1 post-plating using a Cellinjector CI-2000 system (Fujitsu limited, Kanagawa, Japan) with 0.5 ± 0.2 μm injection pipettes (Femtotips, Eppendorf, NSW). Cytoplasmic microinjections were performed under conditions ofPi = 30–50 hPa,Pc = 8 hPa, and an injection time of 180–250 ms. Plasmids were diluted in TE buffer to final concentrations of 100–250 ng/μL. PPCs were mixed with plasmid DNA at several C/A ratios (0.5, 1.0, and 2.0) for 10 min at room temperature. After adding Dextran-Texas Red in PBS (1 mg/mL) to the reaction mixture, the solution was transferred to Femtotips and injected into 300 cells. Twenty-four hours after injection, GFP expression was monitored by fluorescence microscopy, and the ratio of cells expressing GFP to Texas Red positive cells was calculated.
Results and Discussion
The peptide (FKKQGSFAKKK) used in this study is a PKCα-specific substrate. The Km and Vmax of the peptide are 17.4 μM and 138 nmol/min/mg, respectively [13].
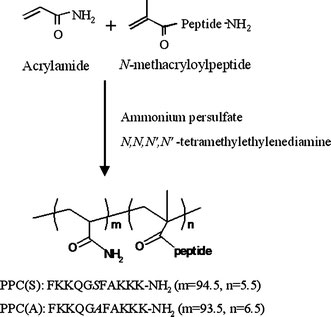
We prepared a PKCα-responsive conjugate [PPC(S)] and a negative control conjugate [PPC(A)], in which the phosphorylation site serine (Ser) was changed to alanine (Ala), using radical copolymerization (Fig. 1). The content of the peptide, as the side chain of the polymer, was estimated to be 5.5 mol% for PPC(S) and 6.5 mol% for PPC(A). Since the substrate peptide has five cationic amino acids (lysine), the PPCs are able to condense with anionic DNA.
Figure 1.

Synthetic scheme and chemical structure of the polymer. The polymer was synthesized by polymerization of acrylamide andN-methacryloylpeptide using ammonium persulfate andN,N,N′,N′-tetramethylethylenediamine
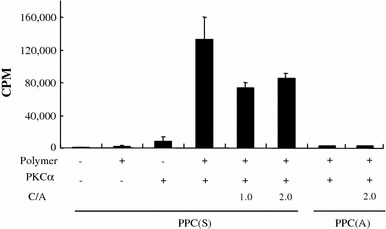
The phosphorylation reaction of the polymers or the polymer/DNA complexes was determined with a radiolabel assay using [γ-32P]ATP. PPC(S) only and PPC(S)/DNA complex at C/A ratios of 1.0 and 2.0 were phosphorylated by the addition of PKCα, but no phosphorylation of PPC(A) only or of PPC(A)/DNA complex at a C/A ratio of 2.0 was observed (Fig. 2). These results suggest that PKCα can recognize the substrate peptide in the PPC(S)/DNA complex and that PPC(A) is a suitable control polymer.
Figure 2.

Phosphorylation of PPCs by PKCα in the presence or absence of DNA. The phosphorylation of the polymers or polymer/DNA complexes was determined by the radiolabel assay using [γ-32P]ATP. Data show mean ± SD (n = 3).CPMcount per minute;C/Acation/anion charge ratio
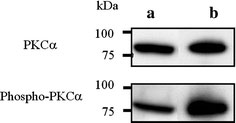
Several studies have reported that PKCα was significantly over-expressed in HepG2 cells, whereas other PKC isozymes (βI, βII, δ, ε, θ, ζ, λ, and ι) were expressed at low levels or were not detected [14,15]. We detected the level of endogenous PKCα and the activated form of PKCα, phospho-PKCα, in HepG2 cells using Western blot analysis. As shown in Fig. 3, endogenous PKCα and phospho-PKCα were identified in the lysate of HepG2 cells.
Figure 3.

The level of endogenous PKCα and the activated form of PKCα, phospho-PKCα, in HepG2 cells.aHepG2 cell lysates andbrecombinant PKCα (1 ng/lane) were immunoblotted with anti-PKCα serum or anti-phosphoPKCα (Ser657) serum. Bound antibodies were visualized using a chemiluminescence assay
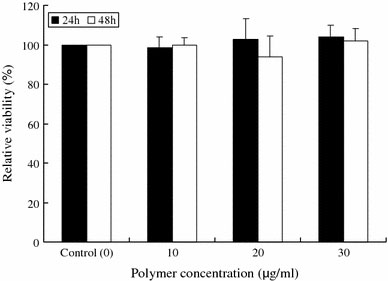
We examined the cytotoxicity of the polymer toward HepG2 cells. The polymer [PPC(S)] concentrations used for the cytotoxicity test at C/A ratios of 0.5 to 2.0 were below 10 μg/mL. The assay results revealed that the polymer hardly affected cell viability (>90%) in the concentration range of 10 to 30 μg/mL over 48 h (Fig. 4); similar results were obtained from the PPC(A) polymer (data not shown). These results indicate no or very low toxicity of the polymer toward cells.
Figure 4.

Toxicity of the polymer toward HepG2 cells. Cells were incubated in the presence or absence of the polymer (0–30 μg/mL) for 48 h in a 24-well plate. The cell viability (%) was calculated as the ratio of the number of unstained cells to the total number of cells
For a gene regulation system that responds to intracellular PKCα activation, the PPC/DNA complex has to be phosphorylated by PKCα in cells and gene expression has to be identified. To prove our concept, the PPC/DNA complexes were microinjected into HepG2 cells. When the PPC(S)/GFP-gene complex was microinjected with C/A ratios of 0.5 to 2.0, significant expression of GFP was observed in all cases. However, no GFP expression was found from the negative control PPC(A)/DNA complex-microinjected cells at C/A ratios of 1.0 and 2.0 (Fig. 5).
Figure 5.

GFP expression after polymer/DNA complex was microinjected into HepG2 cells. Naked DNA, polymer only, and polymer/DNA complexes (C/A = 0.5, 1.0, and 2.0) were microinjected into HepG2 cells and GFP expression was detected 24 h after injection. PPC(S) contained a Ser phosphorylation site for PKCα, but the phosphorylation site was changed to Ala in PPC(A), leading to no phosphorylation by PKCα. Ro31-7549, a PKCα inhibitor
Our polymer consists of a neutral polymer, polyacrylamide in this case, and a cationic peptide, which is a substrate of PKCα. This polymer forms a complex with DNA through an electrostatic interaction. DNA transcription from the complex is totally suppressed, probably due to the steric effect of the neutral polymer main chain. However, in target HepG2 cells, in which PKCα is hyperactivated, the pendant substrate peptides become phosphorylated. This event leads to the introduction of phosphate anionic charges into the polymer, thereby attenuating the polymer/DNA interaction. Transcription factors and polymerases are then able to access the DNA, resulting in GFP expression.
GFP expression was suppressed completely in cells pretreated with PKCα inhibitor (Ro31-7549). Ro-31-7549 is an inhibitor with greatest specificity toward PKCα (>90% at 5 μM) [16,17]. These results show that PPC(S) can mediate PKCα-responsive transgene activation.
Thus we suggest that our polymer/DNA complex can be used for the cell-specific expression of a transgene responding to PKCα activity, and can be developed into a functional gene regulation system in response to PKCα activation.
Misc
Daisuke Asai and Jeong-Hun Kang contributed equally to this work.
Acknowledgments
We are grateful to Mr Kouki Miyamoto (Fujitsu limited) for his suggestion and technical assistances in the microinjection study, and to Ms Sigemi Terakubo, Ms Satomi Yamazaki, and Ms Nami Masumoto for their technical assistance. This research was performed with funding support from CREST, Japan Science and Technology Corporation. This work was also supported in part by Grants-in-Aid for Scientific Research from the Ministry of Education, Science, Sports and Culture of Japan (to D.A., T.N., and Y.K.).
References
- Ferber D. Science. 2001. p. 1638. COI number [1:CAS:528:DC%2BD3MXosleqtLw%3D] [DOI] [PubMed]
- Kang JH, Toita R, Niidome T, Katayama Y. Cancer Lett. 2008. p. 281. COI number [1:CAS:528:DC%2BD1cXmtlWhsbo%3D] [DOI] [PubMed]
- Vähä-Koskela MJ, Heikkilä JE, Hinkkanen AE. Cancer Lett. 2007. p. 178. [DOI] [PMC free article] [PubMed]
- Kaneda Y, Tabata Y. Cancer Sci. 2006. p. 348. COI number [1:CAS:528:DC%2BD28XksVWluro%3D] [DOI] [PMC free article] [PubMed]
- Kasahara N, Dozy AM, Kan YW. Science. 1994. p. 1373. COI number [1:CAS:528:DyaK2MXitlOgtbg%3D]; Bibcode number [1994Sci...266.1373K] [DOI] [PubMed]
- Varga CM, Wichham TJ, Lauffenbruger DA. Biotechnol. 2000. p. 593. COI number [1:CAS:528:DC%2BD3cXoslajt7Y%3D] [DOI] [PubMed]
- Hug H, Sarre TF. Biochem. 1993. p. 329. [DOI] [PMC free article] [PubMed]
- Newton AC. Curr. 1997. p. 161. COI number [1:CAS:528:DyaK2sXisVWnsbg%3D] [DOI] [PubMed]
- Hofmann J. Curr. Cancer Drug Targets. 2004. p. 125. COI number [1:CAS:528:DC%2BD2cXis1eitLs%3D] [DOI] [PubMed]
- O’Brian CA, Chu F, Bornmann WG, Maxwell DS. Expert Rev Anticancer Ther. 2006. p. 175. COI number [1:CAS:528:DC%2BD28XitVClur4%3D] [DOI] [PubMed]
- Oishi J, Kawamura K, Kang JH, Kodama K, Sonoda T, Murata M, Niidome T, Katayama Y. J. Control. Release. 2006. p. 431. COI number [1:CAS:528:DC%2BD2MXhtlert7bP] [DOI] [PubMed]
- Kang JH, Asai D, Kim JH, Mori T, Toita R, Tomiyama T, Asami Y, Oishi J, Sato YT, Niidome T, Jun B, Nakashima H, Katayama Y. J. 2008. p. 14906. COI number [1:CAS:528:DC%2BD1cXht1Kiu7%2FN] [DOI] [PubMed]
- Kang JH, Asai D, Yamada S, Toita R, Oishi J, Mori T, Niidome T, Katayama Y. Proteomics. 2008. p. 2006. COI number [1:CAS:528:DC%2BD1cXmvFWkt7g%3D] [DOI] [PubMed]
- Ducher L, Croquet F, Gil S, Davy J, Feger J, Brehier A. Biochem. 1995. p. 546. COI number [1:CAS:528:DyaK2MXpvFemtr0%3D] [DOI] [PubMed]
- Osaki F, Ikeda Y, Suehiro T, Ota K, Tsuzura S, Arii K, Kumon Y, Hashimoto K. Atherosclerosis. 2004. p. 279. COI number [1:CAS:528:DC%2BD2cXnslGgtrw%3D] [DOI] [PubMed]
- Murphy CT, Westwick J. Biochem. 1992. p. 159. COI number [1:CAS:528:DyaK38XitFWktrc%3D] [DOI] [PMC free article] [PubMed]
- Wilkinson SE, Parker PL, Nixon JS. Biochem. 1993. p. 335. COI number [1:CAS:528:DyaK3sXms1GitL4%3D] [DOI] [PMC free article] [PubMed]


