Abstract
2-D arrays for 3-D rectilinear imaging require very large element counts (16,000–65,000). The difficulties in fabricating and interconnecting 2-D arrays with a large number of elements (>5,000) have limited the development of suitable transducers for 3-D rectilinear imaging. In this paper, we propose an alternative solution to this problem by using a dual-layer transducer array design. This design consists of two perpendicular 1-D arrays for clinical 3-D imaging of targets near the transducer. These targets include the breast, carotid artery, and musculoskeletal system. This transducer design reduces the fabrication complexity and the channel count making 3-D rectilinear imaging more realizable. With this design, an effective N × N 2-D array can be developed using only N transmitters and N receivers. This benefit becomes very significant when N becomes greater than 128, for example. To demonstrate feasibility, we constructed a 4 × 4 cm prototype dual-layer array. The transmit array uses diced PZT-5H elements, and the receive array is a single sheet of undiced P[VDF-TrFE] copolymer. The receive elements are defined by the copper traces on the flexible interconnect circuit. The measured −6 dB fractional bandwidth was 80% with a center frequency of 4.8 MHz. At 5 MHz, the nearest neighbor crosstalk of the PZT array and PVDF array was −30.4 ± 3.1 dB and −28.8 ± 3.7 dB respectively. This dual-layer transducer was interfaced with an Ultrasonix Sonix RP system, and a synthetic aperture 3-D data set was acquired. We then performed off-line 3-D beamforming to obtain volumes of nylon wire targets. The theoretical lateral beamwidth was 0.52 mm compared to measured beamwidths of 0.65 mm and 0.67 mm in azimuth and elevation respectively. 3-D images of an 8 mm diameter anechoic cyst phantom were also acquired.
I. Introduction
In recent years, ultrasound system and transducer developers have implemented 3-D imaging using 2-D arrays [1–4]. Commercially available, fully connected 2-D phased arrays for cardiology and obstetrics have emerged in the past several years [1]. Most of these 2-D arrays use piezoceramics such as lead zirconate titanate (PZT) as the active material [1–3]. Capacitive micromachined ultrasonic transducers (cMUTs) are also an attractive alternative due to the use of standard silicon integrated circuit technology and the potential for electronic integration [4]. Most of these 2-D arrays have less than 5,000 elements. These probes use custom integrated circuits in the handle to funnel thousands of elements from a fully connected 2-D phased array to 128 system channels. In contrast, 2-D arrays analogous to 1-D linear arrays with 128 to 256 elements would need 1282 to 2562, or 16,384 to 65,536 elements to scan a rectilinear, box-shaped volume. A 3-D system having this type of 2-D linear array could improve guidance of breast biopsies, assessment of disease in the carotid artery, and evaluation of musculoskeletal injuries [5–7]. Currently, it has not been demonstrated whether the same technology used to develop fully sampled 2-D phased arrays with less than 5,000 elements can be realistically applied to 2-D transducer arrays with significantly larger element counts. Alternative solutions for 3-D imaging requiring as many as 65,000 2-D array elements should be explored.
Previous attempts to develop arrays for 3-D rectilinear imaging mainly focused on suppressing clutter through unique sparse array designs. The designs included a Mills cross, vernier, and staggered patterns [8–10]. However, due to the extreme sparseness of these arrays where the number of elements greatly exceeds the number of system channels, some clutter is unavoidable. As another potential solution, Lockwood presented a crossed-electrode scheme using a hemispherically shaped array to scan a pyramidal volume [11]. Focusing would be done electronically, while steering would be accomplished mechanically due to the shape of the array. In similar work, we presented a row-column addressing technique to simplify interconnections of a 4 × 4 cm 2-D transducer array and verified its performance through simulations and experiments [12]. This transducer array is essentially a 1–3 composite with vertical and horizontal electrodes on the top and bottom respectively. Transmit and receive switching between the respective vertical and horizontal electrodes were accomplished with a simple diode circuit.
Dual-layer or multilayer transducers have been proposed for other diagnostic applications. Merks et al. investigated a multilayer approach to develop a piston-like transducer for acoustic bladder volume assessment using nonlinear wave propagation [13]. Operating in the 2 MHz range, this transducer uses a 29 mm diameter PZT piston for transmit and a PVDF film for receive. Saitoh developed a dual frequency probe multilayer ceramic for simultaneous B-mode and Doppler duplex imaging [14]. Using two wafers of PZT with polarities pointing in opposite directions, a dual frequency response probe was developed. The lower frequency range would be used for Doppler and the high frequency range would be used for B-mode imaging. Similar to Saitoh’s work, Hossack proposed using a dual-layer design for harmonic imaging [15]. This design used two piezoceramic layers of equal thickness. Both layers of piezoceramic were used together as a single transducer to transmit a pulse at the fundamental frequency. Only the top layer was used for receiving the second harmonic giving increased sensitivity at the second harmonic.
As a new realization of the aforementioned row-column method, we propose a dual-layer design for 3-D imaging. This dual-layer design uses one piezoelectric layer for transmit and another separate piezoelectric layer for receive. The receive layer is closer to the target, and the transmit layer is underneath the receive layer. Each layer is an elongated 1-D array with the transmit and receive elements oriented perpendicular to each other. To some extent, the choice of material for each layer can be optimized separately for transmit and for receive. Furthermore, transmit and receive electronics can be isolated. However, one potential hurdle is to develop an appropriate acoustic stack and manufacturing process to minimize reverberations between layers. In this paper, we present a dual-layer PZT/P[VDF-TrFE], 5 MHz transducer array for 3-D rectilinear imaging. A 4 × 4 cm prototype dual-layer transducer composed of 256 PZT elements and 256 P[VDF-TrFE] elements was developed. We describe the fabrication, test, and initial imaging experiments with this transducer design.
II. Methods
A. 3-D Rectilinear Scanning
For illustrative purposes, Figure 1 is a simplified schematic of the rectilinear 3-D scanning process using a dual-layer design with only 8 elements in each layer. The transmit layer contains a 1-D linear array with elements along the azimuth direction. This transmit array performs beamforming, or focusing, in the azimuth direction using the gray subaperture elements (Fig 1A). In receive, a second layer contains a 1-D linear array with elements oriented perpendicular with respect to the transmit array. This receive layer is located directly in front of the transmit layer. This allows the receive layer to perform beamforming in the elevation direction using the elements shaded in gray (Fig. 1B). By moving the locations of transmit and receive subapertures in azimuth and elevation respectively, a rectilinear volume can be scanned. This design can be viewed as an array with multiple Mills cross arrays for 3-D imaging [8, 16].
Figure 1.
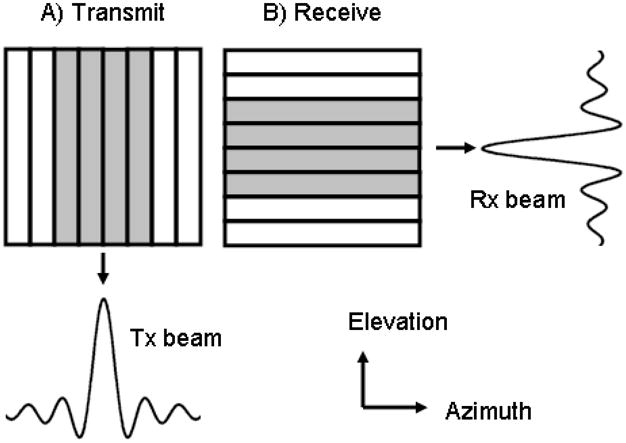
3-D scanning process of the dual-layer transducer array in (a) transmit and (b) in receive. Shaded elements indicate the active subaperture.
To evaluate the theoretical imaging performance, simulated on-axis beamplots were acquired using Field II [17]. The transmit aperture is a 1-D array with an azimuthal element pitch of one wavelength, or 0.15 mm, and an elevational height of 128 wavelengths, or 38.4 mm. The receive aperture has an elevational element pitch of 0.15 mm and an azimuthal length of 38.4 mm. A Gaussian pulse with a center frequency of 5 MHz and 50% −6 dB fractional bandwidth was used. For the beamplot, a 128-element subaperture was used in both transmit and receive and focused on-axis to (x,y,z) = (0,0,30) mm (Figure 2). The −6 dB and −20 dB beamwidths are 0.55 mm and 2.39 mm respectively. The highest clutter levels, around −30 to −40 dB, are seen along the azimuth and elevation axes. The clutter levels drop off dramatically in regions away from the principal azimuth and elevation axes.
Figure 2.
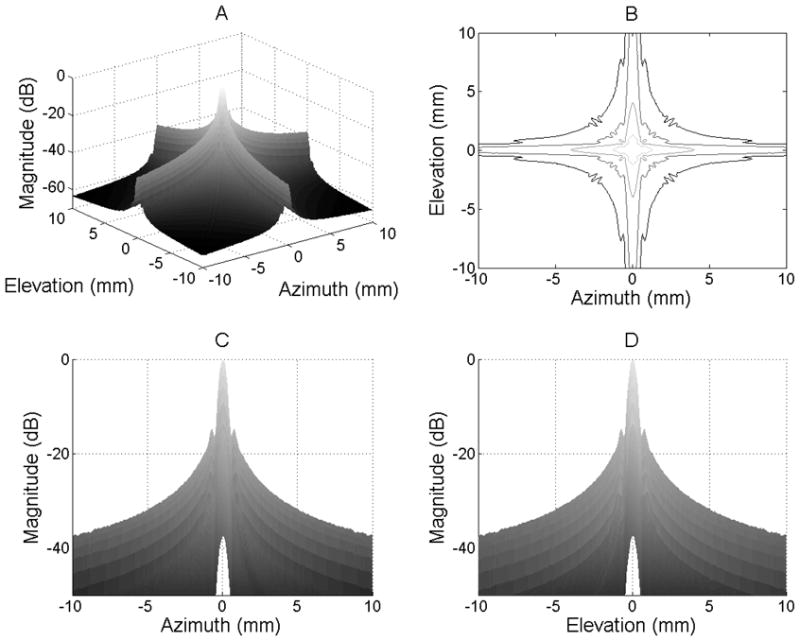
Simulated on-axis beamplots of the dual-layer transducer with focus (x,y,z) = (0,0,30) mm: a) 3-D beamplot, b) Contour plot with lines at −10, −20, −30, −40, and −50 dB, c) azimuthal beamplot, and d) elevational beamplot.
Figure 3 shows simulated off-axis beamplots when the focus is located at (x,y,z) = (15,15,30) mm. The −6 and −20 dB beamwidths are 0.97 and 4.01 mm respectively. Similar to the on-axis case, the main sources of clutter lie parallel to the azimuthal and elevational axes.
Figure 3.
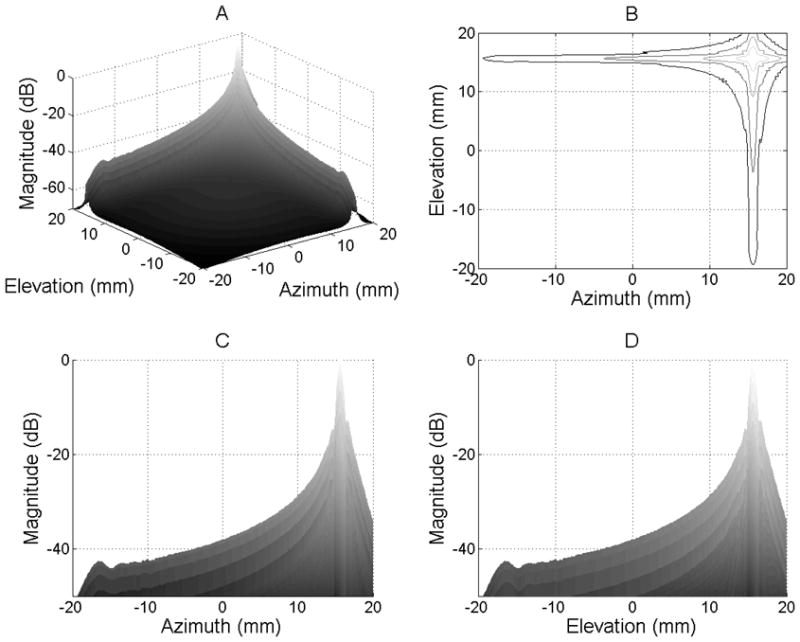
Simulated off-axis beamplots of the dual-layer transducer with focus (x,y,z) = (15,15,30) mm: a) 3-D beamplot, b) Contour plot with lines at −10, −20, −30, −40, and −50 dB, c) azimuthal beamplot, and d) elevational beamplot.
B. Dual-Layer Transducer Design and Fabrication
Figure 4A shows the acoustic stack of the dual-layer transducer array using PZT and P[VDF-TrFE]. This acoustic stack consists of a 9.3 MRayl acoustic impedance backing, a 300 μm thick PZT-5H layer for transmit, a 25 μm thick prototype flexible circuit (Flex1) (Microconnex, Snoqualmie, WA), a 25 μm thick P[VDF-TrFE] copolymer, and another 25 μm thick flexible circuit (Flex2). The two flexible circuits are identical (Fig. 4B). These flexible circuits are made of polyimide with 2 μm thick copper traces. Originally designed for a center frequency near 10 MHz, these copper traces have a center-to-center pitch of 145 μm in the active area. A Samtec connector (Samtec USA, New Albany, IN) serves as the interface between the transducer and a printed circuit board with a mating connector.
Figure 4.
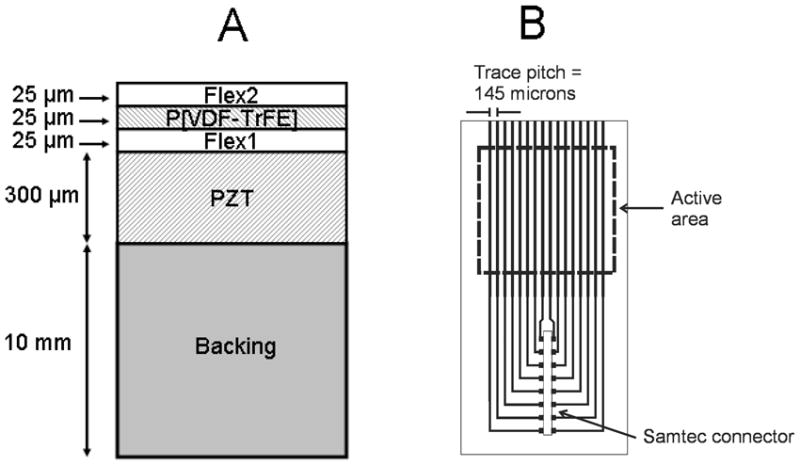
A) Acoustic stack of the dual-layer transducer (not drawn to scale) and B) schematic of flexible circuits.
A 9.3 MRayl acoustic backing was used to suppress reverberations between transducer layers. This backing was produced using 85% 1 μm tungsten powder (Atlantic Equipment Engineers, Bergenfield, NJ) by weight and 15% Epotek 301 epoxy (Epoxy Technology, Billerica, MA). The tungsten/epoxy mixture was then centrifuged at 3000 revolutions per minute (rpm) in a Beckman-Coulter Allaegra 6 centrifuge (Fullerton, CA). After lapping to achieve planar surfaces, one side was sputtered with 500 angstroms of chrome and 3000 angstroms of gold to provide a ground plane for all PZT elements.
To build the PZT layer, a flexible circuit (Flex1 in Figure 4) was first mounted to a 5 × 5 cm glass plate using wax. A 40 × 40 mm wafer of gold-plated 300 μm thick PZT was then bonded to the flex circuit using nonconductive epoxy. The PZT elements were diced with a 25 μm blade at a pitch of 145 μm. After dicing, the PZT array was bonded to the gold-sputtered side of the backing using Epotek 301, and the glass plate was then removed by melting the wax. Next, a 40 × 40 mm sheet of copolymer was bonded to another prototype 25 μm thick flex circuit (Flex2 in Figure 4). This copolymer/flex module was then bonded to the top of Flex1 such that the PZT and copolymer elements were perpendicular to each other. In all bonding steps, the applied pressure was approximately 100 psi.
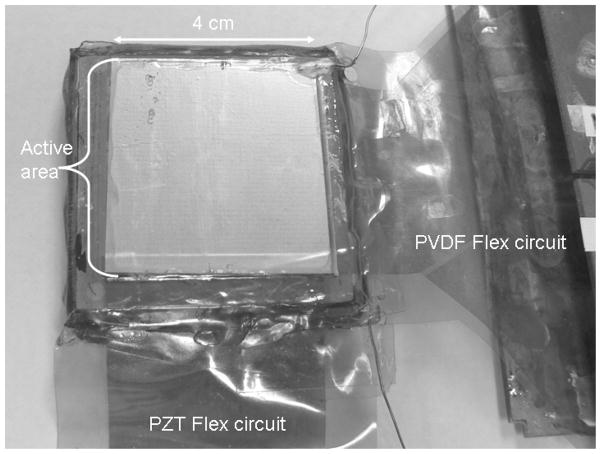
The copolymer chosen was 25 μm thick, which translates to a half wavelength resonance frequency of 48 MHz. This copolymer thickness was chosen because it has a significantly lower electrical impedance than a thicker copolymer with resonance frequency at 5 MHz [18]. A higher electrical impedance would lower system signal-to-noise ratio (SNR) due to signal loss across the coaxial cable [22]. While a copolymer material thinner than 25 μm could have been used to achieve even lower impedance, this desire was balanced by concerns over handling thinner materials during the transducer fabrication process. Using a 25 μm thickness will give an element impedance roughly equivalent to a PZT 2-D array element. We have had reasonable success performing 3-D imaging with prototype 2-D arrays with similar electrical impedance [23]. A single copolymer element is 75 μm wide and 40 mm long. These dimensions are defined by the copper trace sizes on the flexible circuit. No dicing was done to the co-polymer layer. Overly high crosstalk is not expected since this copolymer has low lateral coupling [19]. The copolymer combines with the two flex circuits to serve as a simple matching layer, although not optimal, for the PZT transmit layer. A photo of the finished prototype transducer is shown in Figure 5.
Figure 5.
Photo of the prototype dual-layer transducer.
After transducer fabrication, electrical impedance measurements were made using an Agilent 4294A (Santa Clara, CA) impedance analyzer. Pulse-echo measurements were made in a water tank using a Panametrics 5072PR pulser/receiver (Waltham, MA) with an aluminum plate reflector. To mimic imaging conditions, the excitation pulse was applied to a PZT element and a copolymer element was used as the receiver. Crosstalk measurements of the copolymer and PZT layers were also made using an Agilent 33250A (Santa Clara, CA) function generator. A 200 mVp-p, 5 MHz, 20-cycle burst on one element was applied to one element while measuring the voltage on the neighboring element with 1 MΩ coupling on the oscilloscope.
C. Data acquisition
After performing electrical impedance, pulse-echo, and crosstalk experiments, the dual-layer transducer array was interfaced with a Sonix RP ultrasound system (Ultrasonix, Vancouver, Canada) using a custom printed circuit board. This ultrasound system allows the researcher to control imaging parameters such as transmit aperture size, transmit frequency, receive aperture, filtering, and time-gain compensation. In these experiments, one PZT element was connected to one channel of the Sonix system. This channel was used in transmit mode only, and a two-cycle, 5 MHz transmit pulse was used. Sixty-four copolymer elements were each connected to individual system channels configured to operate in receive mode only. With a 40 MHz sampling frequency, data from each receive channel was collected 100 times and averaged to minimize effects of random noise. A different set of 64 receive elements was used until data from all 256 receive elements were collected. This process is repeated until all transmit and receive element combinations were acquired.
D. Beamforming, Signal Processing, and Display
The acquired data was then imported into Matlab (Mathworks, Natick, MA) for offline 3-D delay-and-sum beamforming, signal processing, and image display. After averaging, dynamic transmit (azimuth) and receive (elevation) focusing was done with 0.5 mm increments with a constant subaperture size of 128 elements, or 18.56 mm. Beamformed RF data was filtered with a 64-tap bandpass filter with frequency range 3.75 – 6.25 MHz. A 3-D volume was acquired by selecting the appropriate transmit subapertures in azimuth and receive subapertures in elevation to focus a beam directly ahead. The rectilinear volume contained 255 × 255 = 65,025 image lines with a line spacing of 145 μm in both lateral directions. The dimensions of the acquired volume were 37 (azimuth) × 37 (elevation) × 45 (axial) mm. After 3-D beamforming, envelope detection was done using the Hilbert transform. Images were then log-compressed and displayed with a dynamic range of 20 to 30 dB. Azimuth and elevation B-scans are displayed along with C-scans which are parallel to the transducer face.
We acquired 3-D volumes of home-made 70 × 70 × 70 mm gelatin phantoms containing 5 pairs of nylon wire targets with axial separation of 0.5, 1, 2, 3, and 4 mm. The bottom wire in each pair was laterally shifted by 1 mm with respect to the top wire. This background material of the wire phantom consisted of 400 g DI water, 36.79 g n-propanol, 0.238 g formaldehyde, and 24.02 g gelatin (275 Bloom). These ingredients and quantities are based on recipes given in the literature for evaluating strain imaging techniques [20]. The second phantom imaged had an 8 mm diameter cylindrical anechoic cyst phantom located at a depth of 27 mm from the transducer face. The background of this cyst used the same ingredients as the wire target phantom but with 3.89 g of graphite powder added to provide scattering. For each phantom, two rectilinear volumes were acquired: one with the short axis of the target in the azimuth direction and one with the short axis of the target in the elevation direction.
III. Experimental results
Figure 6 shows the electrical impedance in air of the dual-layer transducer experimentally using an impedance analyzer and by simulation using the 1-D KLM model [21]. For the PZT, the simulated impedance magnitude was 70 Ohms at a series resonance frequency of 4.4 MHz while the experimental impedance curve showed a series resonance of 78 Ohms at 5 MHz. The phase plots peak at 5.5 MHz for the KLM simulation and at 6.04 MHz in the experimental case. The additional resonance in the 8–9 MHz range is most likely due to the flex and copolymer layers. In the simulation, the impedance magnitude of the copolymer was 1.6 kΩ at 5 MHz while the measured impedance magnitude was 1.3 kΩ. No resonance peaks are seen in the impedance magnitudes, and the phase remains near 80° to 85°.
Figure 6.
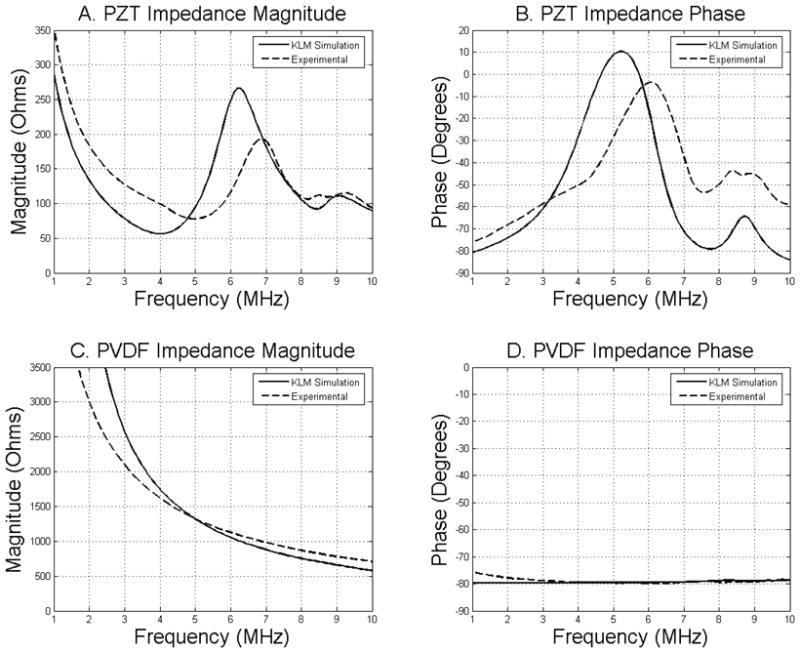
Simulated (solid lines) and experimental (dashed lines) impedance measurements of PZT and PVDF layers.
Figure 7 shows the simulated and experimental time and frequency responses of the pulse-echo signals. In simulation, the center frequency was 5.7 MHz with a −6 dB fractional bandwidth of 90%. Experimentally, the center frequency was 4.8 MHz with a −6 dB fractional bandwidth of 80%. Low amplitude reverberations after the pulse peak are seen in both the simulation and experimental pulses in the time domain. A notch in the 7–8 MHz range is seen in both simulation and experimental spectra. For the PZT layer, the average nearest-neighbor crosstalk at 5 MHz was −30.4 ± 3.1 dB, and the average crosstalk for the copolymer layer was −28.8 ± 3.7 dB. The copolymer layer showed only slightly higher crosstalk than the PZT layer even though no dicing of the copolymer layer was done.
Figure 7.
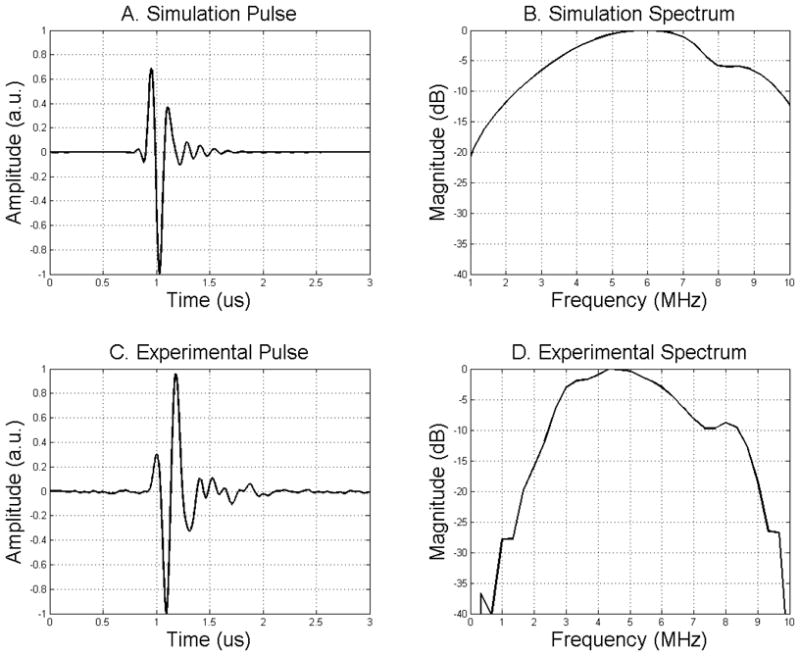
Simulated and experimental pulse and spectra of the dual-layer transducer.
Figure 8A–C show the azimuth B-scan, elevation B-scan, and C-scan respectively when the short axis of the wires is in the azimuth direction. All images are log-compressed and shown on a 20 dB dynamic range. The elevation B-scan (Fig. 8B) shows the pair of wires with 0.5 mm axial separation. The two wires are discernible. The C-scan, taken at a depth of 35 mm, is parallel to the transducer face. Here, one can also see the presence of sidelobes along side the wires. Figures 8D–F show the axial wire target phantom with the short axis of the wires in the elevation direction. The pair of wires with 0.5 mm axial separation is discernible in the azimuth B-scan while the short-axis view is shown in Figure 8E. Figure 8F shows the C-scan where sidelobes are again present.
Figure 8.
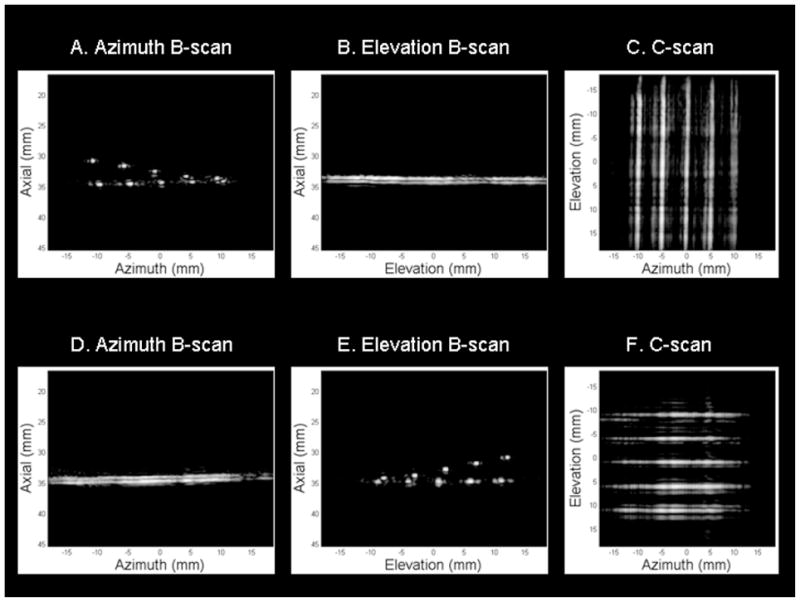
Experimental axial wire target images with short-axis in azimuth (A–C) and short axis in elevation (D–F). All images are log-compressed and shown with 20 dB dynamic range.
Figure 9 shows the lateral wire target responses in azimuth (Fig. 9A) and elevation (Fig. 9B). In both cases, the wire closest to the transducer was used. The −6 dB beamwidth in azimuth was 0.65 mm and 0.67 mm in elevation compared to a theoretical beamwidth of 0.52 mm in both directions. In both cases, there is a sidelobe above −15 dB and some clutter below −20 dB.
Figure 9.
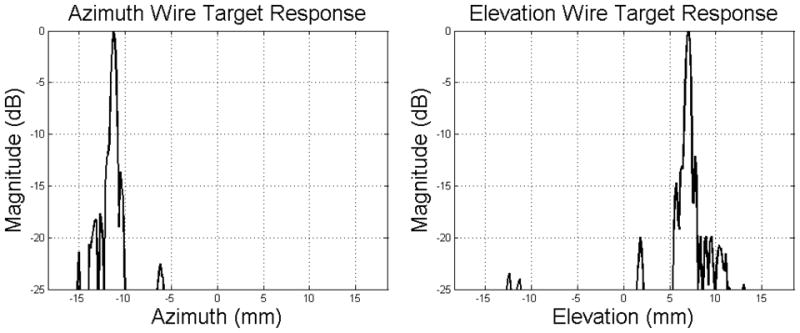
Azimuthal and elevational lateral wire target responses.
Figure 10 contains images of the 8 mm diameter cyst phantom. Figures 10A–C show two perpendicular B-scans and a C-scan with the short axis of the cyst in azimuth and Figures 10D–F show two perpendicular B-scans and a C-scan with the short axis of the cyst in elevation. All images in Figure 10 are log-compressed and are shown with 30 dB dynamic range. Figure 10A shows the cyst in cross-section. The cyst is not perfectly circular because of mechanical compression of the phantom to prevent motion during the data acquisition process. In the elevational B-scan and C-scan, the cylindrical cyst appears as a rectangle. Figures 10D–F show the cyst with short axis in elevation. Although some clutter is present, the cyst is visible in all images.
Figure 10.
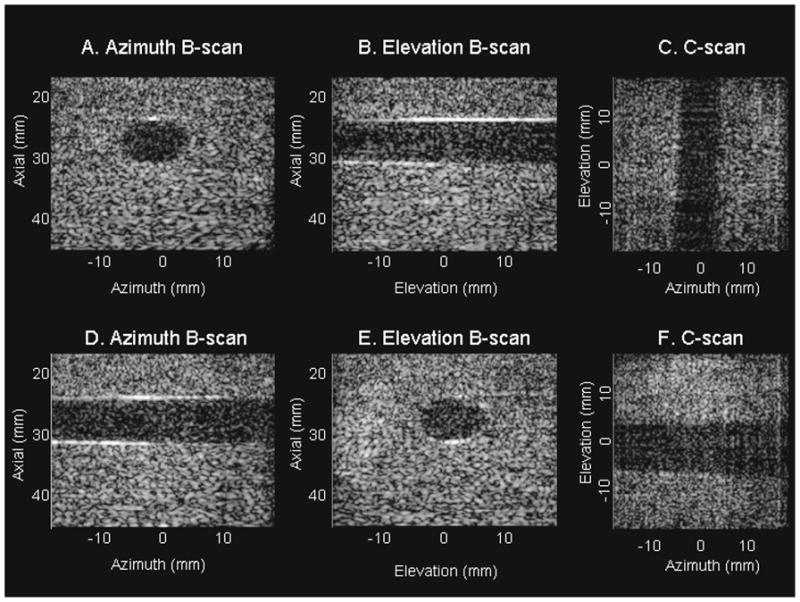
Experimental cyst images with the cyst short-axis in azimuth (A–C) and the cyst short axis in elevation (D–F). All images are log-compressed and shown with 30 dB dynamic range.
IV. Discussion and conclusions
In this paper, we described the design, test, and fabrication of a prototype dual-layer transducer array using PZT/P[VDF-TrFE] for transmit and receive respectively. Our experimental results indicate the feasibility of 3-D imaging using a dual-layer transducer array with reduced fabrication complexity and a decreased number of channels compared to a fully sampled 2-D array of comparable size. We also measured transducer performance and compared it to 1-D simulation results. The impedance measurements showed good agreement between simulation and experiment, and the pulse-echo results showed wide bandwidth. The small differences may be partially due to additional parasitic cable capacitance not included in the KLM model. The lower experimental bandwidth is believed to be a result of variation in bond thickness; it is quite difficult to achieve uniform pressure over a 40 mm × 40 mm area. As a result, this would lead to bond lines with varying thickness across the array. Sidelobes from the wire targets and clutter in the anechoic cyst regions are present, which may be due to the variability of element-to-element performance in terms of sensitivity and bandwidth. Initial work to compensate for the variation in sensitivity did not lower the sidelobes. It is possible that variations in the element-to-element frequency response may also contribute to these sidelobes. Implementing individual element filters to compensate for variations in frequency response is an option but may not be practical. A better approach would be to focus on fabrication methods to improve element uniformity in terms of both sensitivity and bandwidth. Possible fabrication issues to be addressed in future work include achieving highly uniform bonding pressures over the entire array surface and developing fixtures to ensure good planarity as the layers are bonded together. If further improvements in the fabrication process can be made, the dual-layer design may be a viable alternative to fully sampled 2-D arrays.
Future work will also focus on developing higher frequency (8–14 MHz) dual-layer transducers. Frequencies greater than 5 MHz are more commonly used clinically for imaging targets near the transducer such as the breast, carotid, and musculoskeletal system. The higher frequency dual-layer transducers will require a thinner PZT material, but the same copolymer material and thickness could be used. At higher frequencies, the copolymer material will have lower electrical impedance making the material a better match to system electronics. To improve SNR, low-noise pre-amplifiers could be placed near the elements to drive the coaxial cable [18]. We will also investigate modifying this design for 3-D transrectal imaging of the prostate. In this application, a cylindrical backing will be made, and the two perpendicular piezoelectric layers will be curved around this cylindrical backing. The dicing direction of the transmit PZT layer will be parallel to the long axis of the probe. Since copolymer of this thickness is very flexible, it can easily be molded around the cylindrical backing.
Acknowledgments
The authors would like to thank Jon Cannata and Jay Williams for help with transducer fabrication. Funding is provided by NIH grant 5R21CA112174-02 and the Wallace H. Coulter Foundation.
References
- 1.Savord B, Solomon R. Fully sampled matrix transducer for real time 3D ultrasonic imaging. IEEE Ultrasonics Symposium; 2003. pp. 945–953. [Google Scholar]
- 2.Austeng A, Holm S. Sparse 2-D arrays for 3-D phased array imaging – experimental validation. IEEE Trans Ultras, Ferro, and Freq Control. 2002;49:1087–1093. doi: 10.1109/tuffc.2002.1026020. [DOI] [PubMed] [Google Scholar]
- 3.Light ED, Davidsen RE, Fiering JO, Hruschka TA, Smith SW. Progress in two-dimensional arrays for real-time volumetric imaging. Ultrasonic Imaging. 1998;20:1–15. doi: 10.1177/016173469802000101. [DOI] [PubMed] [Google Scholar]
- 4.Oralkan O, Ergun AS, Cheng CH, Johnson JA, Karaman M, Lee TH, Khuri-Yakub BT. Volumetric Ultrasound Imaging Using 2-D CMUT Arrays. IEEE Trans Ultras, Ferro, and Freq Control. 2003;50:1581–1594. doi: 10.1109/tuffc.2003.1251142. [DOI] [PubMed] [Google Scholar]
- 5.Smith WL, Surry KJM, Mills GR, Downey DB, Fenster A. Three-dimensional ultrasound-guided core needle breast biopsy. Ultrasound in Medicine and Biology. 2001;27(8):1025–1034. doi: 10.1016/s0301-5629(01)00396-9. [DOI] [PubMed] [Google Scholar]
- 6.Palombo C, Kozakova M, Morizzo C, Andreuccetti F, Tondini A, Palchetti P, Mirra G, Parenti G, Pandian NG. Ultrafast Three-Dimensional Ultrasound: Application to Carotid Artery Imaging. Stroke. 1998;29(8):1631–1637. doi: 10.1161/01.str.29.8.1631. [DOI] [PubMed] [Google Scholar]
- 7.Leotta DF, Martin RW. Three-dimensional ultrasound imaging of the rotator cuff: spatial compounding and tendon thickness measurement. Ultrasound in Medicine and Biology. 2000;26(4):509–525. doi: 10.1016/s0301-5629(99)00173-8. [DOI] [PubMed] [Google Scholar]
- 8.Yen JT, Smith SW. Real-time rectilinear volumetric imaging. IEEE Trans Ultras, Ferro, and Freq Control. 2002;49:114–124. doi: 10.1109/58.981389. [DOI] [PubMed] [Google Scholar]
- 9.Yen JT, Smith SW. Real-time rectilinear volumetric imaging using a periodic array. Ultrasound in Med and Biol. 2002;28:923–931. doi: 10.1016/s0301-5629(02)00543-4. [DOI] [PubMed] [Google Scholar]
- 10.Yen JT, Smith SW. Real-time rectilinear volumetric imaging using receive mode multiplexing. IEEE Trans Ultras, Ferro, And Freq Control. [PubMed] [Google Scholar]
- 11.Morton CE, Lockwood GR. Theoretical Assement of a Crossed Electrode 2-D Array for 3-D Imaging. IEEE Ultrason Symp; 2003. pp. 968–971. [Google Scholar]
- 12.Seo CH, Yen JT. 256×256 2-D array transducer with row-column addressing. proc. IEEE Ultrason. Symp; 2007. pp. 2381–2384. [Google Scholar]
- 13.Merks EJW, Bouakaz A, Bom N, Lancee CT, van der Steen AFW, de Jong N. Design of a multilayer transducer for acoustic bladder volume assessment. IEEE Trans Ultras, Ferro, And Freq Control. 2006 Oct;53:1739–1738. doi: 10.1109/tuffc.2006.106. [DOI] [PubMed] [Google Scholar]
- 14.Saitoh S, Izumi M, Mine Y. A dual frequency ultrasonic probe for medical applications. Trans Ultras, Ferro, And Freq Control. 1995 Mar;42:294–300. [Google Scholar]
- 15.Hossack JA, Mauchamp P, Ratsimandresy L. A high bandwidth transducer optimized for harmonic imaging. proc. IEEE Ultrason. Symp; 2000. pp. 1021–1024. [Google Scholar]
- 16.Alais P, Challande P, Eljaafari L. Development of an underwater frontal imaging system, concept of 3-D imaging system. Acoust Imag. 1991;18 [Google Scholar]
- 17.Jensen JA, Svendsen JB. Calculation of pressure fields from arbitrarily shaped, apodized, and excited ultrasound transducers. IEEE Trans Ultras, Ferro, And Freq Control. 1992;39:262–267. doi: 10.1109/58.139123. [DOI] [PubMed] [Google Scholar]
- 18.Goldberg RL, Smith SW, Brown LF. In vivo imaging using a copolymer phased array. Ultrasonic Imaging. 1992;14:234–248. doi: 10.1177/016173469201400302. [DOI] [PubMed] [Google Scholar]
- 19.Gottlieb EJ, Cannata JM, Hu CH, Shung KK. Development of a High Frequency (> 50 MHz) Copolymer Annular Array, Ultrasound Transducer. IEEE Trans Ultras, Ferro, And Freq Control. 2006;53:1037–1045. doi: 10.1109/tuffc.2006.1632693. [DOI] [PubMed] [Google Scholar]
- 20.Hall TJ, Bilgen M, Insana MF, Krouskop T. Phantom materials for elastography. IEEE Trans Ultras, Ferro, And Freq Control. 1997;44:1355–1365. [Google Scholar]
- 21.Krimholtz R, Leedom DA, Matthei GL. New equivalent circuits for elementary piezoelectric transducers. Electron Lett. 1970;6:398–399. [Google Scholar]
- 22.Goldberg RL, Smith SW. Multilayer piezoelectric ceramics for 2-dimensional array transducers. IEEE Trans Ultras, Ferro, and Freq Control. 1994;41:761–771. doi: 10.1109/58.308512. [DOI] [PubMed] [Google Scholar]
- 23.Awad SI, Yen JT. 3D strain imaging using a rectilinear 2D array. Ultrasonic Imaging. 2007;29:220–230. doi: 10.1177/016173460702900403. [DOI] [PubMed] [Google Scholar]


