Abstract
Micro-structures that mimic the extracellular substratum promote cell growth and differentiation, while the cellular reaction to a nanostructure is poorly defined. To evaluate the cellular response to a nanoscaled surface, NIH 3T3 cells were grown on nanodot arrays with dot diameters ranging from 10 to 200 nm. The nanodot arrays were fabricated by AAO processing on TaN-coated wafers. A thin layer of platinum, 5 nm in thickness, was sputtered onto the structure to improve biocompatibility. The cells grew normally on the 10-nm array and on flat surfaces. However, 50-nm, 100-nm, and 200-nm nanodot arrays induced apoptosis-like events. Abnormality was triggered after as few as 24 h of incubation on a 200-nm dot array. For cells grown on the 50-nm array, the abnormality started after 72 h of incubation. The number of filopodia extended from the cell bodies was lower for the abnormal cells. Immunostaining using antibodies against vinculin and actin filament was performed. Both the number of focal adhesions and the amount of cytoskeleton were decreased in cells grown on the 100-nm and 200-nm arrays. Pre-coatings of fibronectin (FN) or type I collagen promoted cellular anchorage and prevented the nanotopography-induced programed cell death. In summary, nanotopography, in the form of nanodot arrays, induced an apoptosis-like abnormality for cultured NIH 3T3 cells. The occurrence of the abnormality was mediated by the formation of focal adhesions.
Keywords: Cell adhesion, Nanotopography, Apoptosis, Fibronectin, Fibroblasts
Introduction
Surface topology encodes information that directs cell behavior [1-5]. Cells detect and respond to the specific ligands and the spatial organization of the scaffoldings known as the extracellular matrix (ECM). The ECM consists of collagen and elastin fibers of 10–300 nm diameters intertwined into a landscape of peaks, valleys, and pores [6]. Since ECM contains structures from micro-scale down to nanoscale, it is hypothesized that cells respond to both micro-structure and nanostructure.
Micro-scaled landscapes have been fabricated to direct growth of cultured cells. When cultured on ridges and grooves of nanoscale dimensions, cells migrated more extensively to the ridges than into the grooves. The cells’ shapes were aligned and extended in the direction of the grooves [3,7]. It has been shown that a three-dimensional micro-structure that mimics ECM provides an environment for the in vivo growth of cells. Osteoblasts grown on a fibrous matrix composed of multiwalled carbon nanofibers (100 nm in diameter) exhibited increased proliferation compared to those grown on flat glass surfaces [8,9]. Breast epithelial cells proliferate and form multicellular spheroids on interwoven polyamide fibers fabricated by electrospinning polymer solution onto glass slides [10]. Nanofibers with 100 nm diameters have been fabricated to mimic the three-dimensional fibrous structure of the extracellular matrix [5,9]. 3-D nanofibrillar surfaces covalently modified with tenascin-C-derived peptides enhance neuronal growth in vitro [11]. The three-dimensionality and nanofibrillar architecture of the ECM may represent another essential element in signal transduction pathways and cellular physiology. Nanotopography can activate the small GTPase Rac [12]. This activation of Rac was accompanied by changes in cell morphology and proliferation, Rac localization, fibronectin deposition, and the organization of actin filament-based networks [10]. Although cellular response to micro-topography has been extensively investigated, the nanotopography that cells respond to and the molecular apparatus that senses and transmit the spatial signal from the membrane to the nucleus are not clearly defined at the present time.
Nanotopography-induced cellular response has been explored using nanoislands. Nanoislands were fabricated through varying the polymer blend and allowing spontaneous demixing [13]. Strong influence on the formation of focal adhesions, reorganization of cytoskeleton, and change in the mobility were observed [12]. The cells manage an initial fast organization of the cytoskeleton in reaction to the islands [14]. It has been observed that 13-nm-high islands induce cell spreading and proliferation, while 160-nm islands retard the attachment of filopodia. A gene expression study using a microarray indicates the down regulation of genes associated with the cytoskeleton for cells grown on 95-nm deep nanoislands. The cells responded to the islands with broad gene up-regulation, notably those involved in cell signaling, proliferation, the cytoskeleton, and the production of extracellular matrix protein [15]. Nonetheless, the topography consists of nanoscale islands with controllable heights of tens to hundreds of nanometers, however, with large variation in diameter [16].
The current study is based on the hypothesis that signal transduction pathways must exist that transmit a nanotopography-induced special signal, directs cellular behavior from the extracellular domain to the nuclear area where genetic control occurs [12,17]. Arrays of nanodots with defined diameters and depths can be fabricated using aluminum nanopores as a template during the oxidation of tantalum thin films [16]. The pore size of the aluminum oxide is controllable and uniformly distributed, whereas the depth of the dots depends on the voltage applied; thus, this can serve as a convenient mold for fabricating tantalum into a nanodot array of specific diameter and depth. The structure containing nanodots of uniform size can serve as a comparable nanolandscape to those probing cellular response at the molecular level.
Materials and Methods
Chemicals
Glutaraldehyde and osmium tetroxide were purchased from Electron Microscopy Sciences (USA). Cytochalasin D was purchased from Calbiochem (USA). Anti-vinculin mouse antibody was purchased from Abcam (USA). Alexa Fluor 594 phalloidin, Alexa Fluor 488 goat anti-mouse IgG, and EnzChek Caspase-3 Assay Kit #2 were purchased from Invitrogen (USA). Fibronectin (FN), type I collagen,l-glutamine, and trypsin were purchased from Sigma (USA). Other chemicals of analytical grade or higher were purchased from Sigma or Merck.
Fabrication of Nanodot Arrays
Nanodot arrays were fabricated as described previously [16]. A TaN thin film of 150 nm thickness was sputtered onto a 6-inch silicon wafer, followed by the deposition of 3 μm-thick aluminum onto the top of the TaN layer. Anodization was carried out in 1.8 M sulfuric acid at 5 Volts for the 10 nm nanodot array, or in 0.3 M oxalic acid at 25, 60, and 100 V for the 50, 100, and 200 nm nanodot arrays, respectively. Porous anodic alumina was formed during the anodic oxidation. The underlying TaN layer was oxidized into tantalum oxide nanodots using the alumina nanopores as template. The porous alumina was removed by immersion in 5% (w/v) H3PO4 overnight. A thin layer of platinum (~5 nm) was sputtered onto the structure to improve biocompatibility. The dimension and homogeneity of the nanodot arrays were measured and calculated from images taken by JEOL JSM-6500 TFE-SEM and by atomic force microscopy (AFM).
Coating of BSA, FN, and type I collagen were performed by covering the nanodot arrays with 0.1 mg/mL protein solution at 4 °C for 8 h followed by rinsing with PBS three times before use.
Cell Culture
To eliminate possible contamination of nanomicro particles, the cell culturing was performed in a class-10 clean room. NIH-3T3 cells were cultured in Dulbecco’s Modified Eagle’s Medium complimented with 10% FBS and 5% CO2and incubated at 37 °C.
Treatment of Cells for Scanning Electron Microscopy
The harvested cells were fixed with 1% glutaraldehyde in PBS at 4 °C for 20 min, followed by post-fixation in 1% osmium tetroxide for 30 min. Dehydration was performed through a series of ethanol concentrations (5-min incubation each in 50, 60, 70, 80, 90, 95, and 100% ethanol) and air drying. The specimens were sputter-coated with platinum and examined by JEOL JSM-6500 TFE-SEM at an accelerating voltage of 10 keV.
Caspase-3 Activity Assay
The EnzChek Caspase-3 Assay Kit #2 (Invitrogen, USA) was applied to evaluate the caspase-3 activity, using the procedures provided by the manufacturer. Cells were harvested and counted, followed by incubation with the lysis buffer for 30 min. The cell lysate was centrifuged, and the supernatant was transferred to microplate wells containing Z-DEVD-R110-substrate-working solution followed by a 30 min incubation at room temperature. The fluorescence was measured using an ELISA microplate reader (Perkin Elmer, USA) with an excitation wavelength at 496 nm and an emission wavelength at 520 nm. The caspase-3 activity was normalized to cell counts.
Immunostaining of Actin Filament and Vinculin
Cells were harvested and fixed with 4% paraformaldehyde in PBS for 15 min, followed by three-three PBS washes. The membrane was permeated by incubating in 0.1% Triton X-100 for 10 min, followed by a three PBS washes, blocking with 1% BSA in PBS for 1 h, and three PBS washes. The sample was incubated with anti-vinculin antibody (properly diluted in 0.5% BSA) and phalloidin for 1 h, followed by incubating with Alexa Fluor 488 goat anti-mouse antibody for 1 h and followed by three PBS washes.
Results and Discussion
Fabrication of Nanodot Arrays
Nanodot arrays made using anodic aluminum oxide (AAO) template are highly packed and uniformly distributed in size and shape. This processing defines a series of nanotopologies and can serve as an excellent model system for studying how physical topography affects cellular behavior.
Nanodot arrays were fabricated, as described previously, by AAO processing on tantalum-coated wafers [16]. Tantalum oxide nanodot arrays with dot diameters of 10, 50, 100, and 200 nm were constructed on the silicon wafers. To provide a biocompatible and unique interacting surface, ~5-nm-thick platinum was sputter-coated onto the top of the nanodots. Scanning electron microscopy (SEM) and AFM images showed diameters of 15 ± 2.8, 58.1 ± 5.6, 95.4 ± 9.2, and 211.5 ± 30.6 nm for the 10, 50, 100, and 200 nm dot arrays, respectively (Fig. 1). The average heights were 11.3 ± 2.5, 51.3 ± 5.5, 101.1 ± 10.3, and 154.2 ± 27.8 nm, respectively. Dot-to-dot distances were 22.8 ± 4.6, 61.3 ± 6.4, 108.1 ± 2.3, and 194.2 ± 15.1 nm, respectively. The dimensions of the nanodots were well controlled and highly defined.
Figure 1.

Fabrication of tantalum-based nanodot arrays using AAO processing.aSchematic representation of fabrication procedure.bSEM images of the fabricated nanodot arrays.cAFM images of the fabricated nanodot arrays. Images are arranged from left to right: unprocessed silicon (Si), 10-nm nanodot array (10 nm), 50-nm nanodot array (50 nm), 100-nm nanodot array (100 nm), and 200-nm nanodot array (200 nm)
Cellular Response to Nanodot Arrays
NIH-3T3 cells were cultured on fabricated nanodot arrays and on flat wafers at a density of 1,000–5,000 cells per square centimeter. Cells were harvested at 24 h (day 1), 48 h (day 2), 72 h (day 3), and 96 h (day 4) after seeding. SEM was performed to examine the morphology of the cells (Fig. 2). The side view of the SEM images provided alternative angles for evaluating the morphological change of cultured cells. Cells grown on the control surface and the 10-nm nanodot array remained flat and extended throughout the course of incubation. Cells grown on the 50-nm nanodot array began to show an abnormal appearance on day 4. The abnormal cells underwent a transformation of the main cell body into sub-cellular spheres of ~5 µm in diameter. On day 4, spherical sub-cellular cell bodies were visible. For cells grown on the 100-nm nanodot array, a comparable morphology occurred as early as day 3, while for the 200-nm nanodot array, the morphological aberration started from day 2. The proportion of cells undergoing this morphological change was higher, and the event was triggered earlier, on the 100- and 200-nm nanodot arrays (Fig. 3a).
Figure 2.
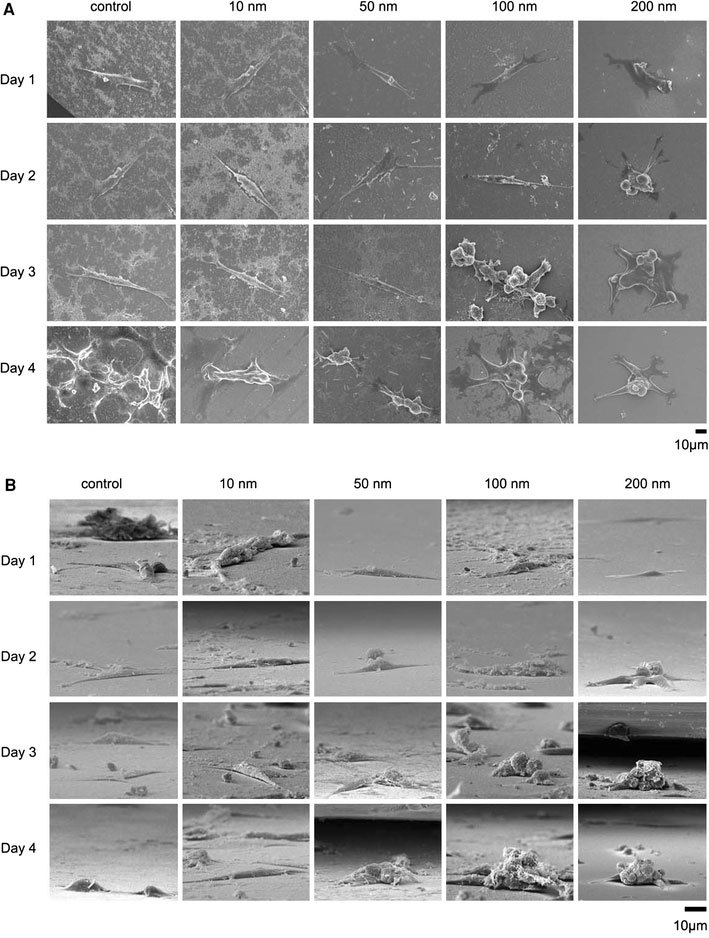
SEM images of cells seeded on the nanodot arrays. NIH-3T3 cells were seeded on a flat silicon surface, 10-nm nanodot array (10 nm), 50-nm nanodot array (50 nm), 100-nm nanodot array (100 nm), and 200-nm nanodot array (200 nm). The cells were harvested at 24 h (Day 1), 48 h (Day 2), 72 h (Day 3), and 96 h (Day 4) after seeding. SEM images were taken. Representative images are shown:atop view,bside view
Figure 3.
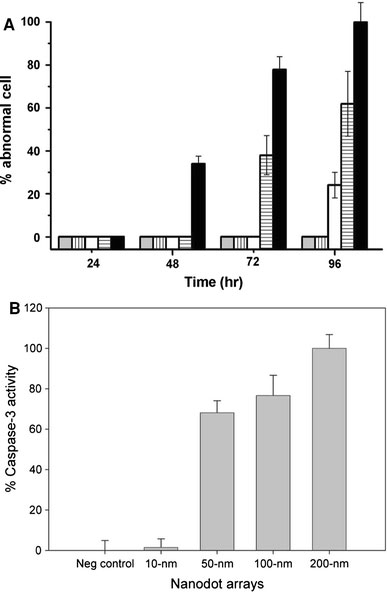
Apoptosis occurred in cells cultured on nanodot arrays.aThe percentage of cells with abnormal morphology calculated from SEM images. Bars depict percent apoptotic cells grown on the flat silicon surface (gray), 10-nm nanodot array (vertical line), 50-nm nanodot array (empty), 100-nm nanodot array (horizontal line), and 200-nm nanodot array (filled).bCaspase-3 activity for cells cultured 96 h on the nanodot arrays. Values were averaged from six sets of independent experiments and were expressed as mean value ± standard deviation
The morphology of the abnormal cells resembled cells proceeding in programed cell death. Caspase activity is the hallmark for apoptosis. Thus, the occurrence of apoptosis-like events was verified by a caspase-3 activity assay performed on cells seeded on nanodot arrays following the time course (Fig. 3b). The onset, time-dependent accumulation, and size-dependent profile of caspase-3 activity matched the proportion of cells undergoing morphological transformation on the nanodot arrays. The nanotopography triggered apoptosis-like events for cultured cells in a size-dependent and time-dependent manner.
Cells grown on the nanoscaled structure could engulf any loose nanoparticles. The endocytosis of the remnants might induce the observed abnormalities. To exclude the possibility that the abnormality was due not to the growth on the nanostructure but to the endocytosis of nanodots, the used arrays were thoroughly cleaned and examined under an electron microscope. The SEM images indicated that the nanodot structures of the used 100-nm and 200-nm nanodot arrays were intact even after a prolonged culturing of cells (Fig. 4).
Figure 4.
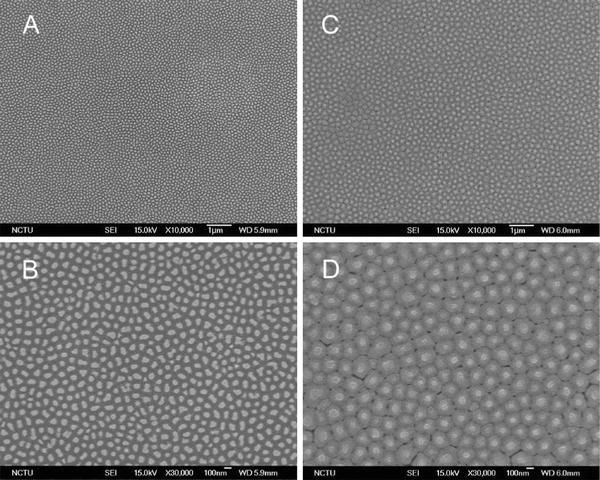
SEM images of the used nanodot arrays. Nanodot arrays of 100-nm and 200-nm were cleaned and washed thoroughly after culturing cells. SEM images were taken on the cleaned nanodot arrays of (a,b) 100-nm and (c,d) 200-nm
Cell Adhesion and Reorganization of the Cytoskeleton were Required for the Nanotopography-Induced Cellular Abnormality
The formation of focal adhesions, reflected by the attachment of filopodia to the substratum, indicates normal growth for cultured cells [15]. The number of filopodia extended from the cells decreased for cells grown on nanodot arrays larger than 50 nm (Fig. 5). For cells seeded on the 200-nm nanodot array, very few filopodia were found. Cells grown on larger-sized nanodot arrays lost the ability to establish filopodia attachment. Further examination indicated that cellular attachment was defective for cells grown on the 100 nm nanodot array (Fig. 6).
Figure 5.
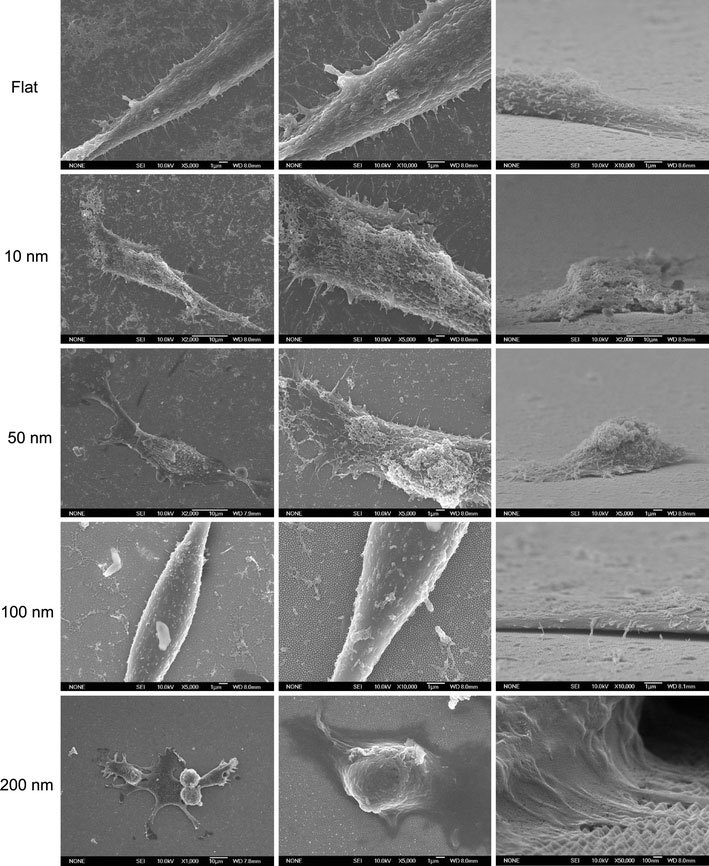
SEM images of NIH-3T3 cells cultured on nanodot arrays to show the filopodia extended from cells. Typical the cells were shown to elicit the detail of cellular structure
Figure 6.
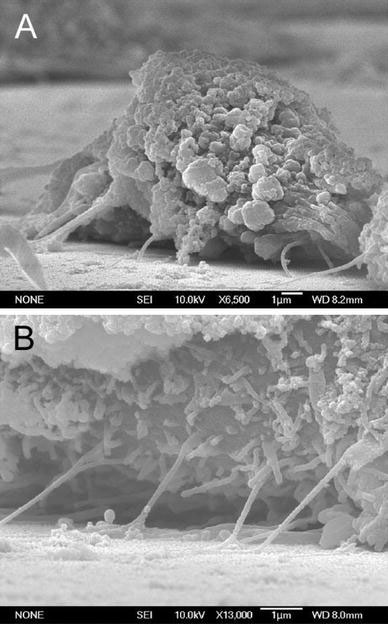
SEM side-view images showing the poor cell attachment of NIH-3T3 cells grown on the 100 nm nanodot array
Topology and surface chemistry might share a common pathway for directing cell behavior. Focal adhesions are mediated by cell adhesion through receptor–ligand binding [18,19]. The inability of cells to establish filopodia attachment on a nanolandscape might be prevented by a surface modification with ligands. We coated the 100-nm nanodot array with BSA, FN, or type I collagen. Pre-treatment with BSA did not prevent the nanotopography-induced apoptosis-like abnormality, while FN and collagen I coating completely averted cellular abnormality (Fig. 7). FN and collagen are native substrates of integrins, the key transmembrane proteins of focal adhesions. The prevention of programed cell death by FN- or type I collagen-enforced cell anchorage indicates that the topography-induced apoptosis-like abnormality could be overridden by receptor-mediated cell adhesion.
Figure 7.
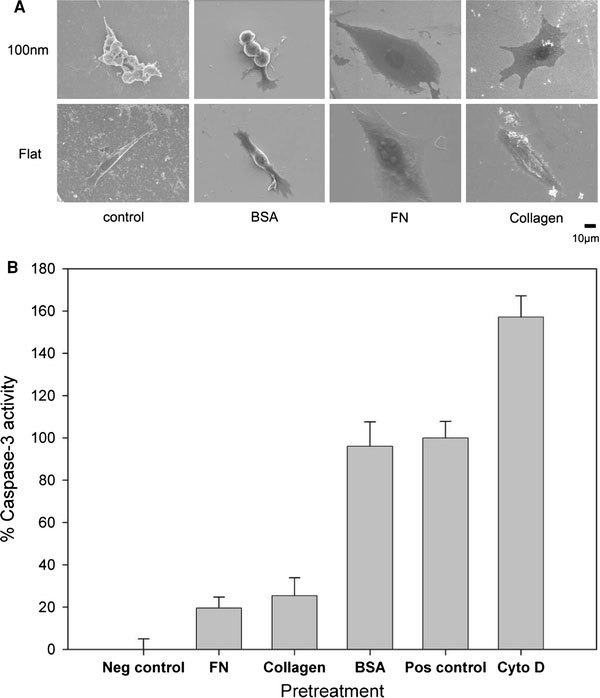
Effects of BSA-, FN-, and type I collagen-coating on the nanotopography-induced apoptosis-like abnormality. Cells were seeded on 100-nm nanodot arrays and flat wafers pretreated with BSA-, FN-, and type I collagen. Cells were harvested on day 4. SEM was performed to visualize the morphology of the cells (a). Apoptosis-like events occurred were quantified by the caspase-3 activity assay (b)
To evaluate the role of adhesion molecules in the nanotopography-induced apoptosis-like events, immuno-staining specific to actin filaments and vinculin was performed on cells grown on the nanodot arrays (Fig. 8). Well-organized actin filaments were visible for cells grown on the flat wafer and on the 10-nm nanodot array. This tight arrangement was gradually lost in cells grown on the 50-nm array and completely disappeared on the 100-nm and 200-nm arrays. Vinculin staining indicated formation of focal adhesions. Vinculin was detected and well-distributed for cells grown on the flat surface and on the 10-nm array. The amount of vinculin staining decreased for the 50-nm array and almost disappeared for the 100-nm and 200-nm arrays. This immunostaining indicated that the nanotopography retarded or inhibited the assembling of focal adhesions.
Figure 8.
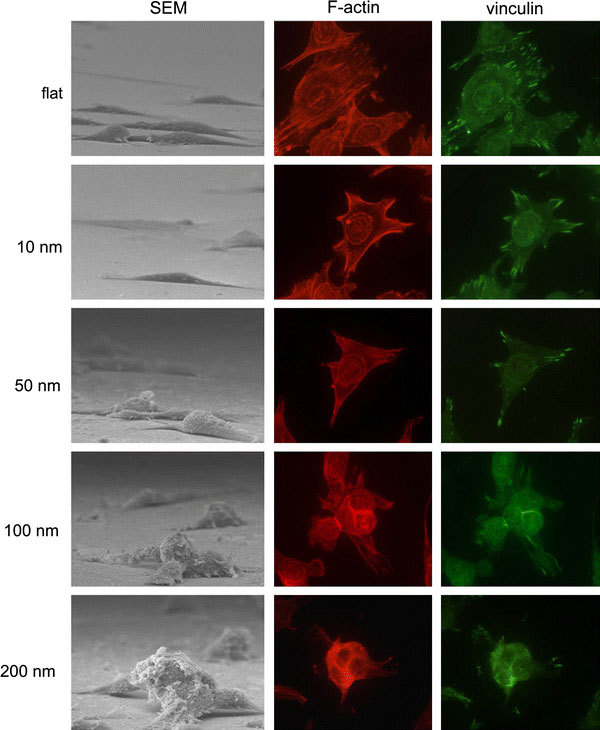
Immunostaining to show organization of actin filament and distribution of vinculin in cells cultured on 10-nm, 50-nm, 100-nm, and 200-nm nanodot arrays and on flat surfaces. Cells were seeded on the arrays for 96 h before harvest. The sample was incubated with anti-vinculin antibody (properly diluted in 0.5% BSA) and phalloidin, followed by incubating with Alexa Fluor 488 goat anti-mouse antibody
Micro-topography has been shown to be advantageous to cell growth. Three-dimensional fibrous structures provide an in vivo-like environment that enhances the growth of cells. Micro-scaled grooves and valleys direct the growth of cells. In the current study, the nanotopography of the nanodot arrays generated an apoptotic signal leading to the suicide of cells. Since a micro-topography of 100-nm nanofibers promotes cell proliferation and adhesion, the apoptosis induced by the nanotopography is unexpected. For cells cultured on 13-nm deep nanoislands, increased cell adhesion, proliferation, cytoskeleton, and extracellular matrix remodeling were observed [20,21]. A reduced cell adhesion and cytoskeletal organization was shown for cells cultured on 95-nm deep nanoislands. Although the exact shape and topology is different for the nanodot arrays applied in the current study, the results from both studies shared a common theme that a dot-like nanotopology with dimensions at about 100 nm reduced cytoskeletal organization. Although cellular abnormality was not stated, the result from the nanoisland study is consistent with the current study.
Our evidence supports the hypothesis that the formation of focal adhesions and the reorganization of the cytoskeleton are part of the apoptotic pathway triggered by nanotopography. The number of focal adhesions was decreased for cells cultured on the 50-nm arrays and was completely absent for cells on the 100-nm and 200-nm arrays. The organization of actin filaments was observed in cells cultured on flat surfaces and on the 10-nm nanodot arrays, but was absent in cells cultured on the 100-nm and 200-nm nanodot arrays. Pretreatment with FN and collagen forced cell adhesion and the formation of focal adhesions, which prevented the apoptosis-like abnormality of cells culturing on the 100-nm arrays. Since focal adhesions and the cytoskeleton play important roles in the nanotopology-induced apoptosis-like abnormality, it is likely that integrins are the receptors mediating the suicidal signal.
Nanotopography-induced apoptosis shares some common features with anoikis, the apoptosis induced by the loss of cell adhesion [22]. Both events were initiated at the bio-nano interface. The loss of focal adhesions and organization of actin filaments were key features of both phenomena. However, anoikis is triggered by forcing epithelial cells to grow in suspension, and signaling is detectable in minutes to hours [23]. Nanotopography-induced apoptosis-like events became evident only after days of incubation. We noticed that cells seemed to lose adhesion when grown on the 100-nm and 200-nm arrays (Fig. 6). Serious deformation of cells was observed. The loss of attachment might be due to an imbalanced shear force caused by the uneven evaporation of solvent during the dehydration process. However, cells cultured on other nanodot arrays maintained decent adhesion with the surface, indicating that the cells grown on the 100-nm and 200-nm arrays exhibited relatively weak binding affinity to the surface. To exclude the possibility of anoikis, measuring the number of non-adherent cells at various time intervals will be performed in future experiments.
Nano- to micro-structure enhance surface hydrophobicity [24-26]. Since hydrophobicity plays an important role in protein folding and in the protein–protein interaction, hydrophobicity might be an important factor in the nanotopology-induced apoptosis-like events. Contact angle measurements indicated that hydrophobicity increased as the dot-size increased (Fig. 9a). The coating of BSA eliminated the difference of the hydrophobicity between arrays (Fig. 9b); this coating of BSA did not prevent the nanotopology-induced apoptosis-like abnormality (Fig. 7). Thus, factors other than surface hydrophobicity must be involved to trigger apoptosis-like events at the bio-nano interface.
Figure 9.
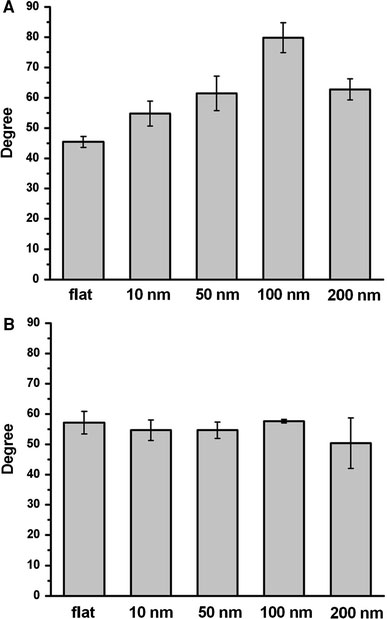
Contact angle measurements for the nanodot arrays. Contact angles were measured for untreated nanodot arrays (a) and BSA-treated nanodot arrays (b)
Acknowledgment
This study was supported in parts by National Science Council Grant NSC94-2320-B-009-003 and Bureau of Animal and Plant Health Inspection and Quarantine Council of Agriculture Grant 95AS-13.3.1-BQ-B1 and 95AS-13.3.1-BQ-B6.
References
- Chen CS, Mrksich M, Huang S, Whitesides GM, Ingber DE. Science. 1997. p. 1425. COI number [1:CAS:528:DyaK2sXjsFOhu7s%3D] [DOI] [PubMed]
- Curtis ASG, Wilkinson C. Biomaterials. 1997. p. 1573. COI number [1:CAS:528:DyaK1cXivFCru7Y%3D] [DOI] [PubMed]
- Flemming RG, Murphy CJ, Abrams GA, Goodman SL, Nealey PF. Biomaterials. 1999. p. 573. COI number [1:CAS:528:DyaK1MXisVeksbk%3D] [DOI] [PubMed]
- Mrksich M. Curr. 2002. p. 794. COI number [1:CAS:528:DC%2BD38XptFequ7Y%3D] [DOI] [PubMed]
- Sniadecki NJ, Desai RA, Ruiz SA, Chen CS. Ann. 2006. p. 59. [DOI] [PubMed]
- Abrams GA, Goodman SL, Nealey PF, Franco M, Murphy CJ. Cell Tissue Res. 2000. p. 39. COI number [1:STN:280:DC%2BD3c7hvFGltg%3D%3D] [DOI] [PubMed]
- Karuri NW, Liliensiek S, Teixeira AI, Abrams G, Campbell S, Nealey PF, Murphy CJ. J. 2004. p. 3153. COI number [1:CAS:528:DC%2BD2cXms1ens70%3D] [DOI] [PMC free article] [PubMed]
- Elias KL, Price RL, Webster TJ. Biomaterials. 2002. p. 3279. COI number [1:CAS:528:DC%2BD38XjvVGisbo%3D] [DOI] [PubMed]
- Price RL, Ellison K, Haberstroh KM, Webster TJ. J. Biomed. Mater. Res. A. 2004. p. 129. [DOI] [PubMed]
- Schindler M, Ahmed I, Kamal J, Nur EKA, Grafe TH, Young Chung H, Meiners S. Biomaterials. 2005. p. 5624. COI number [1:CAS:528:DC%2BD2MXjvVCktbw%3D] [DOI] [PubMed]
- Schwartz Z, Boyan BD. J. 1994. p. 340. COI number [1:CAS:528:DyaK2MXitFygsr4%3D] [DOI] [PubMed]
- Nur EKA, Ahmed I, Kamal J, Schindler M, Meiners S. Biochem. 2005. p. 428. [DOI] [PubMed]
- Dalby MJ, Riehle MO, Johnstone H, Affrossman S, Curtis ASG. Biomaterials. 2002. p. 2945. COI number [1:CAS:528:DC%2BD38XjsFKqurY%3D] [DOI] [PubMed]
- Park J, Bauer S, von der Mark K, Schmuki P. Nano Lett. 2007. p. 1686. COI number [1:CAS:528:DC%2BD2sXlt1Cku7c%3D]; Bibcode number [2007NanoL...7.1686P] [DOI] [PubMed]
- Partridge MA, Marcantonio EE. Mol. Biol. Cell. 2006. p. 4237. COI number [1:CAS:528:DC%2BD28XhtFSjt7bM] [DOI] [PMC free article] [PubMed]
- Ko F-H, Wu C-T, Hwang H-Y. Microelectron. 2006. p. 1567. [DOI]
- Nur EKA, Ahmed I, Kamal J, Schindler M, Meiners S. Stem Cells. 2006. p. 426. [DOI] [PubMed]
- Clark EA, Brugge JS. Science. 1995. p. 233. COI number [1:CAS:528:DyaK2MXltVCitLk%3D]; Bibcode number [1995Sci...268..233C] [DOI] [PubMed]
- Hynes RO. Cell. 1992. p. 11. COI number [1:CAS:528:DyaK38XitFWmtrg%3D] [DOI] [PubMed]
- Dalby MJ, Childs S, Riehle MO, Johnstone HJ, Affrossman S, Curtis ASG. Biomaterials. 2003. p. 927. COI number [1:CAS:528:DC%2BD38Xps1Onu7s%3D] [DOI] [PubMed]
- Dalby MJ, Giannaras D, Riehle MO, Gadegaard N, Affrossman S, Curtis ASG. Biomaterials. 2004. p. 77. COI number [1:CAS:528:DC%2BD3sXot1SktLs%3D] [DOI] [PubMed]
- Valentijn AJ, Zouq N, Gilmore AP. Biochem. 2004. p. 421. COI number [1:CAS:528:DC%2BD2cXksFyhsL8%3D] [DOI] [PubMed]
- Grossmann J, Walther K, Artinger M, Kiessling S, Scholmerich J. Cell Growth Differ. 2001. p. 147. COI number [1:CAS:528:DC%2BD3MXis1ehsbc%3D] [PubMed]
- Erbil HY, Demirel AL, AvciO Y. Meat Sci. 2003. p. 1377. COI number [1:CAS:528:DC%2BD3sXhsFWrsrc%3D] [DOI] [PubMed]
- Lafuma A, Quere D. Nat. 2003. p. 457. COI number [1:CAS:528:DC%2BD3sXls1elsL0%3D]; Bibcode number [2003NatMa...2..457L] [DOI] [PubMed]
- Otten A, Herminghaus S. Langmuir. 2004. p. 2405. COI number [1:CAS:528:DC%2BD2cXhtlamsL8%3D] [DOI] [PubMed]


