

Abstract
The role of adaptive immunity in obesity-associated adipose tissue (AT) inflammation and insulin resistance (IR) is controversial. We employed flow cytometry and quantitative PCR to assess T-cell recruitment and activation in epididymal AT (eAT) of C57BL/6 mice during 4–22 weeks of a high (60% energy) fat diet (HFD). By week 6, eAT mass and stromal vascular cell (SVC) number increased 3-fold in mice fed HFD, coincident with onset of IR. We observed no increase in the proportion of CD3+ SVCs or in gene expression of CD3, IFNγ, or regulated upon activation, normal T-cell expressed and secreted (RANTES) during the first 16 weeks of HFD. In contrast, CD11c+ macrophages (Mφ) were enriched 6-fold by week 8 (p < 0.01). SVC enrichment for T cells (predominantly CD4+ and CD8+) and elevated IFNγ and RANTES gene expression were detected by 20–22 weeks of HFD (p < 0.01), coincident with the resolution of eAT remodeling. HFD-induced T cell priming earlier in the obesity time course is suggested by (1) elevated (5-fold) IL-12p40 gene expression in eAT by week 12 (p ≤ 0.01) and (2) greater IFNγ secretion from PMA/ionophore-stimulated eAT explants at week 6 (1 fold, p = 0.08) and week 12 (5 fold, p < 0.001). In summary, T cell enrichment and IFNγ gene induction occur subsequent to ATMφ recruitment, onset of IR and resolution of eAT remodeling. However, enhanced priming for IFNγ production suggests the contribution of CD4+ and/or CD8+ effectors to cell-mediated immune responses promoting HFD-induced AT inflammation and IR.
Keywords: T cell, adipose tissue, obesity, inflammation, insulin resistance
INTRODUCTION
Visceral obesity is characterized by a state of low-grade chronic inflammation, which is now recognized as an important contributor to the pathogenesis of obesity complications, in particular insulin resistance (IR) (1, 2). A significant advance in our understanding of obesity-associated adipose tissue (AT) inflammation has been the recognition of the important role of innate immunity, specifically the recruitment, localization and functional heterogeneity of AT macrophages (Mφ) during the development of obesity (3). Initial studies documenting robust ATMφ recruitment in obese mice noted few if any coincident changes in numbers of other immune cells, including lymphocytes (4, 5). However, T cell and NK cell-derived cytokines are important modulators of Mφ response patterns and functions within tissues, in particular as regards the M1/M2 polarization paradigm (6, 7). In this paradigm pro-inflammatory Mφ activation directed against intracellular pathogens (M1) is driven by the canonical T helper cell type-1 (Th-1) cytokine interferon-gamma (IFNγ) (8). A variety of ‘alternative’ (M2) Mφ activation states driven by T helper cell type-2 (Th2) cytokines IL-4 and IL-13 and functionally modulated by IL-10 (9) mediate anti-parasite defense, wound healing, tissue remodeling and the resolution of acute inflammation. AT expansion involves extensive tissue remodeling (10–12) and thus the regulated actions of M2-polarized ATMφs. However, in mice, chronic obesity is associated with the accumulation of M1-polarized, CD11c+ ATMφs in intra-abdominal fat (13–15). This “phenotype switch” (13, 14) in ATMφ polarization from M2 to M1 made it plausible that T cells and Th1/2 cytokines act as orchestrators of ATMφ responses during the development of obesity-associated AT inflammation and IR.
Flow cytometry studies by Penicaud and colleagues (16, 17) initially characterized lymphocye cell populations in mouse AT, reporting depot-specific profiles and positive associations of obesity and/or mass of epididymal AT (eAT) with the percentage of lymphocytes that were T cells. Subsequent studies have reported obesity-associated increases in AT T cells in mice and extended these observations to obese humans (18–21). In obese humans, visceral fat is distinguished by greater numbers of T and NK cells and elevated gene expression of both IFNγ and the Th1 chemokine, regulated upon activation, normal T-cell expressed and secreted [RANTES] as compared with subcutaneous fat (18, 22). Notably, obese IFNγ null mice fed high fat/high cholesterol, choline-deficient diet exhibited reduced accumulation of ATMφ as well as attenuated pro-inflammatory cytokine expression in epididymal AT (eAT), coincident with improved glucose tolerance relative to wild-type mice (19). These results provide empirical support for the hypothesis that T cells accumulate in AT in obesity and that Th1-polarized T cells regulate AT inflammation and impact systemic glucose homeostasis.
Expanding this notion, Kintscher and coworkers (21) proposed that T cell recruitment was a primary event in the development of AT inflammation and IR. They reported that mRNA of the pan-T cell marker CD3 was significantly elevated in eAT during the initial stages of high fat diet (HFD)-induced obesity (week 5), coincident with IR, yet weeks before increased mRNA levels of the Mφ marker F4/80. Additional evidence supporting a role for activated T cells in ATMφ recruitment and AT inflammation comes from studies in lean, atherosclerotic CD4dnTGFbR mice (23). T cells in these mice are constitutively activated due to reduced TGF-β signaling. This constitutive T cell activation was associated with increased recruitment of CD4+ T cells and ATMφ as well as elevated MCP-1, TNF-α and IFNγ gene expression in AT (23). However, as these mice remained insulin sensitive, the role of activated T cells and IFNγ in the development of IR was questioned (23). An additional challenge to the notion that activated T cells are an underlying cause of AT inflammation and IR comes from data (24) suggesting that T cells are selectively depleted from eAT to facilitate ATMφ recruitment and AT expansion while dampening inflammation. Consistent with this idea, the absence of T cells in RAG2−/− mice was associated with larger AT depots and more ATMφ in response to a HFD (24).
In the present study we investigate T cell recruitment and activation within eAT of C57BL/6 mice during a 22 week time course of HFD-induced obesity. Previously-established metabolic hallmarks of this obesity time course include the development of glucose intolerance by week 1, doubling of eAT weight and hyperinsulinemia by week 4, and IR (assessed by intraperitoneal insulin tolerance tests) by week 6, progressively increasing to maximal levels by week 16 (15). Accompanying these metabolic changes are progressive increases in CD11c+ ATMφ recruitment and inflammatory gene expression, adipocyte death, and tissue remodeling, with eAT mass reduced by ~50% at week 16 and then partially restored (regrowth) by new adipogenesis by week 20 (15). Our objective was to determine the temporal pattern and magnitude of T cell responses during the progression of these hallmark events.
METHODS and PROCEDURES
Animals, Diets
Studies were approved and monitored by the Institutional Animal Care & Use Committee of the JMUSDA-HNRCA at Tufts University. All studies used male C57BL/6 mice (Jackson Labs, Bar Harbor, Maine) that were fed ad libitum. Three sets of mouse studies were completed: (1) Gene expression studies of T cell markers and T cell-associated cytokines were conducted with archived frozen epididymal adipose tissue (eAT) from male mice that were divided into two weight-matched groups and fed either a low fat diet (LFD, 10% energy from fat, Research Diets #D12450Bi), or a high fat diet (HFD, 60% energy from fat, Research Diets #D12492i) for 1, 4, 8, 12, 16, or 20 weeks beginning at 5 weeks of age. Morphometric, metabolic and macrophage-mediated inflammatory profiles of eAT from these mice have been previously reported (15); (2) For flow cytometry and associated gene expression studies 5 week-old male mice were fed either the LFD or HFD for 6, 8, 12, 16 and 22 weeks while housed at the Jackson Laboratory. Mice were shipped to the HNRCA where they were maintained on the same diet for 2–3 d before use. (3) Gene expression studies of short-term HFD-induced T cell and macrophage recruitment mice were conducted with fourteen week-old mice that were divided into two weight-matched groups and fed either a LFD or HFD for 5 weeks.
Metabolic measures
Glucose measurements were obtained from whole tail vein blood of fasted (6 h), non-anesthetized mice using an automated glucometer. Fasting (overnight) serum insulin was measured by ELISA using mouse insulin as a standard (Crystal Chem., Downers Grove, IL).
Quantitative PCR
Procedures for epididymal adipose tissue RNA extraction, first strand cDNA synthesis and SYBR® Green real-time PCR reactions were as previously described (15). RNA from sorted ATMφs was amplified using the WT-Ovation amplification system (NuGEN, San Carlos, CA). Determination of relative gene expression levels was based on the comparative critical threshold (Ct) method. Target gene expression was normalized to the average expression of an endogenous control gene (cyclophilin A), and fold difference was calculated by 2−ΔΔCt (corrected for primer efficiency [E]). Primer sequences are provided in online Supplementary Material.
Stromal Vascular Cell isolation, cell labeling
Stromal vascular cells (SVCs) were isolated from eAT using Liberase Blenzyme 3 for cell sorting experiments (Roche, Indianapolis, IN) or collagenase (for FACS) and centrifugation as previously described (33) with minor modifications. The samples were incubated at 37 °C with shaking until digestion was complete (30–40 min). The digested tissue was passed through a 100 micron mesh filter and the flow through centrifuged to obtain the final SVC pellet. The SVC pellet was re-suspended with 1 ml red blood cell lysis buffer (Sigma, St. Louis, MO), followed by the addition of chilled FACS labeling buffer (1xPBS with 1% fatty acid-free BSA, 1mM EDTA, 25mM HEPES). For ATMφ sorting, FACS buffer contained RNAse inhibitor. SVC numbers were determined and the cells re-suspended in fresh FACS labeling buffer (~1×10⁶ cells/100μl). Prior to labeling, cells were incubated in Fc block for 10 min, washed with FACS buffer and re-pelleted. Cells (5×10⁵ cells/100μl) were labeled in FACS buffer for 40 min on ice with desired primary fluorophore-conjugated antibodies or appropriate isotype controls. Labeled cells were then washed and re-suspended three times before flow cytometric analysis.
The following antibodies were used to label SVCs: anti-CD3e-488, (#53-0031), anti-CD8b-PE-Cy5, (#53-0083), anti-CD25-488 (#53-0251), anti-F4/80-PE-Cy5 (#15-4801) and anti-CD69-FITC (#11-0691) from eBiosciences (San Diego, CA); anti-NK1.1-RPE (#MCA1266PE) from Serotec (Raleigh, NC); anti-CD44-FITC (#553133), anti-CD4-PE, (#553730), anti-CD8a-PE-Cy5 (#553034), anti-CD11c-PE (#557401) and Fc-block (#553142) from BD Pharmingen (San Jose, CA); goat anti-mouse MGL1/2 (#AF4292), R&D Systems (Minneapolis, MN); and anti-goat-A488 (#705-486-147), Jackson ImmunoResearch (West Grove, PA).
Flow Cytometry
Labeled cells were quantified by fluorescence activated cell sorting (FACS) using the FACSCalibur 2 laser 4 color analytical flow cytometer (Becton Dickinson, San Jose, CA) with CellQuest software for data capture at the Tufts Laser Cytometry Core facility. Collected data were analyzed using Summit software (Beckman Coulter, Fullerton, CA). Autofluorescence was identified and excluded using Isotype controls. Lymphocytes were quantified in the R1 gate, defined by forward and side scatter properties and CD3 positive events. ATMφs were sorted on a MoFlo Multi-laser system (MLS) sorter (Beckman Coulter) using Summit software. Sorted cells were stored in sorting buffer at −80C until RNA extraction and real-time PCR (see above).
Adipose tissue explant culture, T cell priming assay
Explant cultures of eAT were established essentially as described by Thalmann (25). Briefly, eAT (100 mg/well) was dissected, weighed, minced and placed into 6 well tissue culture dishes with either T cell activation medium (DMEM Gibco #11995 containing 10% FBS, 1% penicillin/streptomycin, 5 ng/ml PMA and 1ng/ml ionomycin) or control medium (complete DMEM with vehicle). Conditioned medium was collected after 4 and 24 h and analyzed by IFNγ ELISA (BD Pharmingen).
Statistics
2-way ANOVA or GLM procedures were used in conjunction with Tukey’s ‘Honestly Significant Difference’ Test (SAS v9.1). Frequency data were transformed as arcsin√x prior to statistical analysis. Significance was set at P ≤ 0.05.
RESULTS
Stromal Vascular Cell and Lymphocyte dynamics in eAT during the HFD Time course
eAT was obtained for FACS analysis from mice fed either a LFD or HFD for 6, 8, 12, 16 or 22 weeks. By week 6, mice fed HFD were significantly heavier (p < 0.01; Figure 1a), had significantly heavier eAT (p < 0.001; Figure 1b), and were more insulin resistant (p < 0.01, Figure 1c) than mice fed the LFD. eAT weight declined between weeks 8 and 16 (p < 0.01) (Fig. 1B), reflecting increased adipocyte death during this period (15). eAT weight was partially re-established at week 22 (Figure 1b), reflecting new adipogenesis and reconstitution of the depot with small adipocytes (15). Overall, total SVCs per gram eAT were significantly greater in mice fed HFD as compared with LFD (p for diet < 0.001), although differences between diets at any one time point were statistically significant only at week 12 (p = 0.03) (Figure 1d).
Figure 1.

Weight, adiposity, stromal vascular cells and HOMA-IR in mice fed HFD or LFD for up to 22 weeks starting at 6 weeks of age. (a) body weight (b) epididymal adipose tissue (eAT) weight (n = 5–12 mice for wk 6, 8 and 12; n = 4–7 for wk 16; n=3 for wk 22). (c) HOMA-IR determined at week 6 (n = 4–5). (d) number of stromal vascular cells per gram eAT (n = 4–8, for wk 6, 8, 12 asnd 16; n = 3 for wk 22). *, P ≤ 0.05 for comparison between diets at the indicated time point. #, significantly different from HFD wk 8 (P ≤ 0.05). Bars designated by different letters are significantly different (P ≤ 0.05).
T cells, T cell subsets and NK cells were identified and quantified by FACS using R1 gating and specific cell surface markers (see Supplementary Material, Figure S1). FACS analysis indicated that T (CD3+) cells comprise ~4–5% of the SVC fraction of eAT in mice fed the LFD (Figure 2a). As compared with mice fed LFD, the proportion of T cells in the SVC fraction was not significantly different in mice fed the HFD during the first 16 weeks of the time course (p = 0.26), although values for HFD-fed mice tended to be slightly (10%) greater through week 12 (Figure 2a,b). These results indicate that HFD-induced obesity was not associated with significant T cell enrichment in the SVC of eAT during the first 4 months of HFD feeding. However, because the number of SVCs per gram eAT is modestly elevated in mice fed HFD (Figure 1d) the number of T cells per gram eAT is consequently increased as well.
Figure 2.

T cells, T cell subsets and NK cells in eAT of mice fed HFD or LFD. Stromal vascular cell fractions of eAT were isolated and analyzed by FACS. (a) numbers of CD3+ cells, (b) CD4+ cells, (c) CD8+ cells and (d) NK (CD3-NK1.1+) cells within the lymphocyte gate per 10,000 total cells (n = 4–12 for 6 to 16 wks; n = 3 for 22 wks) (e) representative FACS histograms showing SVC enrichment for CD3+CD4+ and CD3+CD8+ cells at 22 weeks of HFD as compared with LFD. *, P ≤ 0.05 for comparison between diets at the indicated time point; #, P ≤ 0.01 for effect of HFD over the time course.
FACS analysis of T cell subsets indicated no significant HFD-associated change during the first 16 weeks of HFD in the proportion of CD3+ cells expressing either CD4 (p = 0.26, Fig. 2b), CD8 (p = 0.75, Fig. 2c) or NK1.1 (p = 0.35, data not shown ). However, mice fed HFD had modestly (≤ 30%) greater SVC enrichment of CD4+ and CD8+ T cells and NK (CD3−/CD4+) cells at week 6, which were not observed by week 12 (Figure 2b–d). These results suggest that subtle increases in the proportion of CD4+ and CD8+ T cells and NK cells may occur in eAT during the initial 8 weeks of HFD.
Significant increases in the proportion of T cells in the SVC fraction were observed at week 22 of HFD (Fig. 2a,e). At this time the percentage of CD3+ SVCs in eAT increased by 2-fold (to 11%) as compared with mice fed the LFD (p = 0.02) or as compared to mice fed the HFD for 6, 8, 12 or 16 weeks (p < 0.01) (Figure 2a,e). This increase reflected elevated (although nonsignificant) levels of CD4+ (Figure 2b,e), CD8+ (Figure 2c,e) cells and an additional T cell population presumably expressing the δ T cell receptor (16) (Figure 2e). These results indicate that multiple T cell populations are enriched in eAT between weeks 16 and 22 of HFD.
FACS was next employed to quantify recruitment of CD11c+ ATMφs to eAT using additional cohorts of mice fed either LFD or HFD for 8 and 12 weeks. By week 8, CD11c+ ATMφs were enriched ~6-fold in the SVC fraction of mice fed HFD (8.7% ± 1.4% of ATMφs, n = 6) as compared with mice fed LFD (1.3% ± 0.4% of ATMφs, n = 6) (p < 0.01). By week 12 CD11c+ ATMφs were enriched ~12-fold in eAT of mice fed HFD (13.9% ± 1.1% of ATMφs, n = 10) as compared with mice fed LFD (1.1% ± 0.1% of ATMφs, n = 6) (p < 0.001). These results indicate that, in contrast to T or NK cells, CD11c+ ATMφs were significantly enriched in the SVC fraction of eAT by week 8 of HFD and continued to increase at least through week 12.
To confirm these observations obtained with mice fed HFD during the period of adipose tissue growth and maturation, we additionally assessed T cell and ATMφ recruitment to eAT of adult mice fed either the LFD or HFD for 5 weeks beginning at 14 weeks of age. Mice fed the HFD were heavier (40.03g ± 1.92g, n = 6) than mice fed the LFD (32.31g ± 0.97, n = 4) (p = 0.02) and were more insulin resistant (HOMA-IR: HFD = 5.82 ± 0.81 ng/ml; LFD = 2.10 ± 0.43 ng/ml, p ≤ 0.01). Notably, 5 weeks of feeding the HFD resulted in no significant increase in CD3 mRNA (fold increase relative to LFD = 1.11 ± 0.15; p = 0.60). Similar results for CD3 gene expression were obtained when either cyclophilin A, GAPDH or 18s RNA were used as ‘housekeeping’ genes (data not shown). In contrast, CD11c mRNA levels were 5.98 ± 1.29-fold greater in mice fed HFD as compared with LFD (p < 0.01). These results confirm that CD11c+ ATMφ recruitment and dysregulated glucose homeostasis occur in the absence of T cell enrichment in eAT.
Effect of HFD on Th1 and Th2 cytokines in eAT
We next investigated the effect of HFD on mRNA levels of Th1 and Th2 cytokines and other modulators of T cell-mediated inflammation using eAT from mice fed either the LFD or HFD for 4, 8, 12, 16 and 20 weeks (15). Maximal whole body IR and levels of CD11c+ and TNF-α mRNA were observed in these mice at week 16, and loss of eAT mass and subsequent regrowth were observed at weeks 16 and 20, respectively (15). Consistent with FACS data (Figure 2a) mRNA for the pan T cell marker CD3 was not elevated relative to levels in mice fed LFD through the first 16 weeks (Figure 3a). However, CD3 mRNA levels at week 20 were on average 5–6-fold greater in mice fed HFD (p < 0.05) (Figure 3a). Similarly, mRNA levels of IFNγ and the Th1 chemokine RANTES were not significantly elevated until week 20 of HFD (p ≤ 0.05) although trends for increases were observed beginning at week 12 (Figure 3b). In contrast to RANTES, gene expression of the CXC chemokines IFN-gamma-inducible protein 10 (IP-10) and monokine induced by IFN-gamma (Mig) declined significantly after week 4 (Supplementary Material, Figure 2Sa,b). These results in conjunction with FACS analysis (Figure 2a,e) implicate RANTES in the recruitment of Th1-polarized T cells to eAT at weeks 20–22 of HFD (26).
Figure 3.

T cell (CD3+) and Th1/2-associated gene expression in eAT during 20 weeks of HFD or LFD. Shown are mRNA levels of (a) CD3 (b) IFNγ, (c) RANTES, (d) IL-12p40, and (f) IL-4 in eAT of HFD-fed mice relative to LFD controls. (e) mRNA levels of IL-12p40 in resident (MGL1+/CD11c−) ATMφs and recruited (MGL1−/CD11c+) ATMφs from mice fed HFD for 8 weeks. Data are expressed as fold-difference relative to LFD controls (designated as “1” and indicated by the horizontal line) (n = 4–6 at each time point) *, P ≤ 0.05 for comparison between diets at the indicated time point; #, P ≤ 0.01 for effect of HFD over the time course.
IL-18 and IL-12 are Th1 cytokines produced primarily by macrophages and dendritic cells that induce IFNγ production by T cells. IL-18 mRNA was elevated 1.5-fold at week 4 in eAT of mice fed HFD as compared with LFD-fed controls, but was subsequently down regulated (p = 0.05, Supplementary Material, Figure S2c). In contrast, mRNA for the p40 subunit of IL-12 (IL-12p40/p35) tended to be higher in mice fed HFD by week 6 (1.8-fold as compared with LFD) and increased at week 12 (6 fold, p = 0.01) and week 22 (15-fold, p < 0.001) (Figure 3d). Real-time PCR of ATMφs sorted for both CD11c and the M2 marker MGL1 (14) indicate that 8 weeks of HFD feeding upregulated IL-12p40 gene expression 4-fold in resident (MGL1+CD11c−) ATMφs and ~ 40-fold in recruited (MGL1−/CD11c+) ATMφs (Figure 3e). Thus HFD-associated increase in IL-12p40 mRNA in eAT between weeks 6 and 12 reflect both ATMφ recruitment and upregulated ATMφ IL-12 p40 gene expression. Constitutive levels of mRNA coding for the IL-12p35 subunit were not significantly different between the two ATMφ subtypes and did not change significantly in response to HFD (data not shown).
Coincident with the increase in IL-12p40 gene expression, gene expression of the canonical Th2 cytokine IL-4 was reduced ~4-fold between weeks 4 and 12 in eAT of mice fed the HFD and remained attenuated through week 20 (p = 0.02) (Figure 3f). Similar (nonsignificant) reductions were also detected in IL-13 gene expression between weeks 8 and 12 of HFD (online Supplemental Material, Figure S2d). Overall, gene expression data for IL-12p40, IL-4 and IL-13 suggest the development of a more Th1-polarizing cytokine milieu in eAT between weeks 8 and 12 of HFD.
T cell priming in response to HFD
Elevated IFNγ synthesis in response to combined stimulation by PMA/ionophore provides an established measure of T cell priming by IL-12 and other Th1-polarizing stimuli (27, 28). To assess diet-associated differences in T cell priming eAT explants from mice fed LFD or HFD for 6, 12 and 20 weeks were challenged with a sub-maximal dose of PMA/ionophore for 4 and 24 h (Figure 4). In the absence of PMA/ionophore stimulation, IFNγ protein was undetectable in conditioned medium of eAT explants independent of diet (limit of detection = 5 pg/ml) (data not shown). Within 4 h of stimulation with PMA/ionophore, IFNγ mRNA levels in eAT explants increased up to 75-fold on average (data not shown) and explants from both LFD and HFD cohorts secreted measurable levels of IFNγ into the medium (Figure 4). Notably, levels of IFNγ produced by eAT of mice fed HFD were 2-fold greater after 6 weeks of HFD (trend, p = 0.08) and 5-fold greater after 12 weeks of HFD (p < 0.001) than levels secreted by explants from mice fed LFD (Figure 4). These observations suggest that there are more T cells primed for INF production per gram eAT in mice fed HFD as compared with mice fed LFD. This difference may reflect both a higher proportion of primed T cells in the SVC, as well as a higher proportion of SVCs per gram eAT in mice fed HFD (Figure 1d). Evidence for enhanced T cell priming in response to HFD is consistent with gene expression data (Figure 3d and Figure 4) suggesting elevated IL-12 protein levels in eAT of mice fed HFD (Figure 3d).
Figure 4.
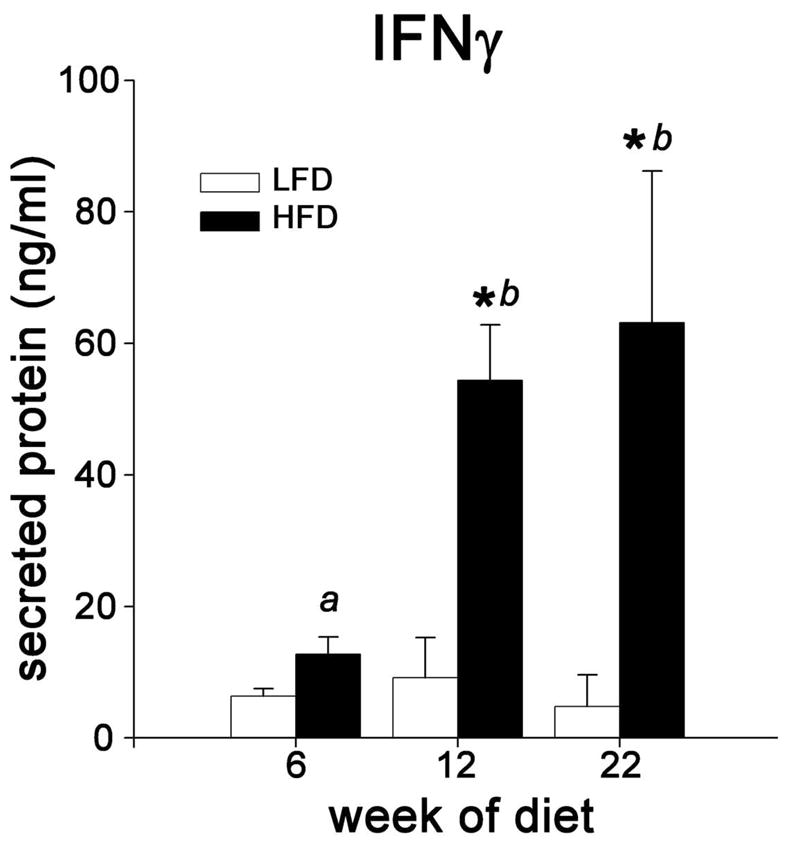
Effects of HFD on T cell priming for IFNγ production. Whole eAT explant cultures from mice fed LFD or HFD for 6, 12 or 22 weeks were stimulated with a submaximal dose of PMA/ionophore for 24 hours. IFNγ secreted into the medium was quantified by ELISA (n= 2–3 for LFD and 3–4 for HFD). *, P ≤ 0.05 for comparison between diets at the indicated time point. Bars designated by different letters are significantly different (P ≤ 0.05).
DISCUSSION
Activation of innate immunity in AT is now recognized as a contributing factor in the development of obesity, obesity-associated inflammation and IR (1–4, 29). Less is known concerning the role of adaptive immunity in these events. Recent reports (19, 21) have promoted the view that T cell recruitment and the actions of IFNγ in eAT are important to the development of AT inflammation and IR during diet-induced obesity. In contrast, other studies have questioned the importance of Th1 cytokines to the development of IR (23) and have suggested that the presence of T cells in AT in fact constrains AT expansion and ATMφ accumulation induced by a HFD (24). In an effort to address this controversy the present study quantified T cells and Th1/Th2 cytokine mRNA expression in eAT of mice during 20–22 weeks of HFD-induced obesity. Our objective was to document the temporal pattern and magnitude of T cell responses during hallmark events in this model (15), in particular eAT expansion, CD11c+ ATMφ infiltration and the onset of IR.
A key result of our study is that neither T cell recruitment (i.e., enrichment in the SVC) nor significant up-regulated IFNγ and RANTES gene expression were observed until 20 weeks of HFD- i.e., months after increases in eAT mass (Figure 1b), CD11c+ ATMφ recruitment and onset of IR (Figure 1c), and one month after maximal IR is observed in this model (15). These results were confirmed by a 5 week HFD time course in adult mice, in which significant increases in CD11c+ gene expression in eAT and IR were observed in mice fed the HFD in the absence of increased CD3 gene expression. Therefore, while our data support prior reports of T cell recruitment and up regulated RANTES gene expression in obese mice and humans (18–21), the timing of these increases in the present study calls into question the extent to which they contribute to the onset of AT inflammation and IR. In particular the present study fails to support the observation (21) of robust (3-fold) increases in CD3 mRNA in eAT after 5 weeks of feeding a 60% HFD or the conclusion based in large part on this observation that T cell recruitment is a primary event that precedes ATMφ recruitment, AT inflammation and IR in response to HFD. Similarly, despite an overall attenuation of Th1 chemokine gene expression after week 6 (online supplemental material, Figure S2) our FACS data do not support the view (24).that total T cells in eAT are selectively ‘depleted’ from AT after the initial stages of HFD (6 weeks in the present study) in order to facilitate increases in ATMφ
Although we found no evidence of enhanced T cell recruitment until weeks 20–22 of HFD, the number of SVCs (and thus T cells) per gram eAT increased ~40% in response to HFD as early as week 6 (Figure 1d). We cannot rule out that this modest ‘non-selective’ increase in the density of T cells in eAT, contributes to early inflammatory and metabolic pathology in our model. Supporting this concept are our observations of IL-12p40 and IL-18 gene expression in eAT. These cytokines, in combination with antigen(s) or synergistically in an antigen-independent manner (30) promote CD4+ T cell differentiation along the Th1 pathway and induce IFNγ production (27). CD4+T cells ‘primed’ by IL-12 up regulate IFNγ synthesis independent of IL-12 stimulation upon re-encounter with antigen (31) or in response to exogenous stimulation with PMA and ionophore (28). Our data (Figure 4) suggest that T cells in eAT of mice fed the HFD are primed for IFNγ production in response to PMA/ionophore stimulation by week 6 of HFD. Moreover, the magnitude of IFNγ release increased between weeks 6 and 12, (Figure 3d) coincident with recruitment of CD11c+ ATMφ robustly expressing IL-12p40 mRNA (Figure 3e). These M1-polarized ATMφ localize to crown-like structures surrounding dead adipocytes (5, 14, 15), and it is therefore likely that T cells proximal to such structures will be preferentially primed by IL-12. Intriguingly, increases in IL-12p40 mRNA and Th1 priming are coincident with the reported progression of AT inflammation and IR in this model (15), suggesting a potential mechanistic association between lymphocyte activation and AT inflammation and IR. Overall, our results strongly suggest a biphasic adaptive immune response in eAT in which the first phase performs a priming function and the second stage (post week 16) is more grossly proinflammatory.
Despite this evidence for Th-1 priming, levels of IFNγ mRNA or protein were not significantly elevated during the first 16 weeks of HFD in the absence of exogenous stimulation (PMA/ionophore). This suggests either the absence of relevant antigenic re-stimulation and/or the inhibition of Th1 effector cell maturation and IFNγ production (27). A potential mediator of such inhibition is IL-10, an inflammation-suppressive cytokine that constrainsTh1 responses in lymphocytes (32). IL-10 mRNA levels increase in eAT during the HFD time course, becoming maximally (15-fold) elevated at week 16 (15). These increases are due at least in part to up-regulated IL-10 gene expression by M2-polarized resident (MGL1+/CD11c−) ATMφs in response to HFD (our unpublished data). Importantly, IL-10 gene expression in eAT is subsequently down regulated by ~50% at week 20 of HFD (15), presumably reflecting the progression of the ATMφ ‘phenotype switch’ from M2 to M1 polarization (14). This down regulation of IL-10 gene expression in combination with attenuation of IL-4 and IL-13 gene expression in eAT (Figure 3f and Supplementary Material, Figure S2d) coincides with T cell enrichment and up regulated expression of IFNγ and RANTES at weeks 20–22 (Figure 3b, c).
These observations suggest a shift in the cytokine/chemokine environment of eAT from one favoring Th2 responses toward one favoring Th1 responses, including IFNγ production. Additional factors may also promote the T cell enrichment and Th-1 cytokine/chemokine expression observed in eAT after week 16. One intriguing possibility is reductions or loss of the inhibitory actions of regulatory T cells (Tregs), which maintain immune homeostasis by secreting IL-10 and TGF-β (31). Whether this loss occurs and whether it is coincident with differentiation of proinflammatory Th17 cells (31) is currently unknown. Other factors that could promote Th1 responses in eAT include HFD-associated systemic endotoxemia (33) as well as endogenous signals released from dying adipocytes and surrounding matrix (damage-associated molecular patterns [DAMPS]) that can act as immune adjuvants and favor Th1 polarization (reviewed in (34)).
In conclusion, the development of obesity and the onset of obesity-associated AT inflammation and IR occurred in the absence of T cell enrichment or significant increases in IFNγ or RANTES gene expression in eAT. The absence of robust Th1 responses during the initial 16 weeks of HFD in the present study are consistent with the depot-wide tissue remodeling observed during this period (15). Tissue remodeling is integral to AT expansion and thus to energy metabolism homeostasis (15, 35, 36). It is therefore not unexpected that the cytokine/chemokine milieu of AT would favor repair and tolerance over inflammation and immunogenicity during the development of obesity. However, given that T cell priming for INFγ production was detected relatively early in the obesity-time course, it is reasonable to expect that Th1-polarized T cells present in eAT (and perhaps intra-abdominal fat in general) contribute to the progression of obesity-associated inflammation and IR. The challenge before us is to determine the pathophysiologic impact(s) of T cell-mediated inflammatory responses in AT of chronically obese mice and humans.
Supplementary Material
Table 1.
Primer sequences used for real time PCR (3′ to 5′)
| Gene target | Forward | Reverse |
|---|---|---|
| Cyclophilin A | GTGGTCTTTGGGAAGGTGAA | TTACAGGACATTGCGAGCAG |
| Cd11c | CTGGATAGCCTTTCTTCTGCTG | GCACACTGTGTCCGAACTC |
| IL-12p40 | GGAGACACCAGCAAAACGAT | GATTCAGACTCCAGGGGACA |
| IFN-γ | TCTGGAGGAACTGGCAAAAG | TTCAAGACTTCAAAGAGTCTGAGG |
| IL-4 | TCAACCCCCAGCTAGTTGTC | TGTTCTTCGTTGCTGTGAGG |
| IL-18 | CAGTGAACCCCAGACCAGAC | GGCAAGCAAGAAAGTGTCCT |
| IL-13 | CCAGGTCCACACTCCATACC | TGCCAAGATCTGTGTCTCTCC |
| RANTES | CAGGAGCAAGTGCTCCAATCTT | TTCTTGAACCCACTTCTTCTCTGG |
| CD3 | AGGCACTGTAGCCCAGACAAATA | AGCCACTTGATAGTCTTGTCAGTCA |
| IP-10/CXCL10 | GCTGCCGTCATTTTCTGC | TCTCACTGGCCCGTCATC |
| MIG/CXCL9 | CTTTTCCTTTTGGGCATCAT | CGATCGTGCATTCCTTATCA |
| I-A | GTGGTGCTGATGGTGCTG | CCATGAACTGGTACACGAAATG |
Acknowledgments
This work was supported by NIH grants 1 RO1 DK074979-01A1 (M.S.O.) and 5P30DK46200-14 (Boston Obesity and Nutrition Research Center), American Diabetes Association Research Award 1-06-RA-96 (M.S.O) and USDA-ARS contract 58-1950-7-707. We thank the animal facility personnel for their expert assistance with animal husbandry. We would also like to thank our colleagues, in particular Gerald Denis, for their valuable comments on the manuscript.
Funding sources: Supported by NIH DK074979, the American Diabetes Association, BONRC NIDDK 5P30DK46200-14, and USDA-ARS.
Nonstandard abbreviations
- eAT
epididymal adipose tissue
- ATMφ
adipose tissue macrophage
- SVCs
stromal vascular cells
- CLS
crown-like structure
Footnotes
DISCLOSURES
none
References
- 1.Shoelson SE, Herrero L, Naaz A. Obesity, inflammation, and insulin resistance. Gastroenterology. 2007;132:2169–80. doi: 10.1053/j.gastro.2007.03.059. [DOI] [PubMed] [Google Scholar]
- 2.Zeyda M, Stulnig TM. Obesity, Inflammation, and Insulin Resistance - A Mini-Review. Gerontology. 2009 doi: 10.1159/000212758. [DOI] [PubMed] [Google Scholar]
- 3.Surmi BK, Hasty AH. Macrophage infiltration into adipose tissue: initiation, propagation and remodeling. Future Lipidol. 2008;3:545–56. doi: 10.2217/17460875.3.5.545. [DOI] [PMC free article] [PubMed] [Google Scholar]
- 4.Xu H, Barnes GT, Yang Q, et al. Chronic inflammation in fat plays a crucial role in the development of obesity-related insulin resistance. J Clin Invest. 2003;112:1821–30. doi: 10.1172/JCI19451. [DOI] [PMC free article] [PubMed] [Google Scholar]
- 5.Cinti S, Mitchell G, Barbatelli G, et al. Adipocyte death defines macrophage localization and function in adipose tissue of obese mice and humans. J Lipid Res. 2005;46:2347–55. doi: 10.1194/jlr.M500294-JLR200. [DOI] [PubMed] [Google Scholar]
- 6.Mariotti S, Sargentini V, Marcantonio C, et al. T-cell-mediated and antigen-dependent differentiation of human monocyte into different dendritic cell subsets: a feedback control of Th1/Th2 responses. FASEB J. 2008;22:3370–9. doi: 10.1096/fj.08-108209. [DOI] [PubMed] [Google Scholar]
- 7.Martinez FO, Helming L, Gordon S. Alternative activation of macrophages: an immunologic functional perspective. Annu Rev Immunol. 2009;27:451–83. doi: 10.1146/annurev.immunol.021908.132532. [DOI] [PubMed] [Google Scholar]
- 8.Dalton DK, Pitts-Meek S, Keshav S, Figari IS, Bradley A, Stewart TA. Multiple defects of immune cell function in mice with disrupted interferon-gamma genes. Science. 1993;259:1739–42. doi: 10.1126/science.8456300. [DOI] [PubMed] [Google Scholar]
- 9.Martinez FO, Sica A, Mantovani A, ML Macrophage activation and polarization. Front Biosci. 2008;13:453–61. doi: 10.2741/2692. [DOI] [PubMed] [Google Scholar]
- 10.Ledoux S, Queguiner I, Msika S, et al. Angiogenesis associated with visceral and subcutaneous adipose tissue in severe human obesity. Diabetes. 2008;57:3247–57. doi: 10.2337/db07-1812. [DOI] [PMC free article] [PubMed] [Google Scholar]
- 11.Tam J, Duda DG, Perentes JY, Quadri RS, Fukumura D, Jain RK. Blockade of VEGFR2 and not VEGFR1 can limit diet-induced fat tissue expansion: role of local versus bone marrow-derived endothelial cells. PLoS ONE. 2009;4:e4974. doi: 10.1371/journal.pone.0004974. [DOI] [PMC free article] [PubMed] [Google Scholar]
- 12.Cancello R, Henegar C, Viguerie N, et al. Reduction of macrophage infiltration and chemoattractant gene expression changes in white adipose tissue of morbidly obese subjects after surgery-induced weight loss. Diabetes. 2005;54:2277–86. doi: 10.2337/diabetes.54.8.2277. [DOI] [PubMed] [Google Scholar]
- 13.Lumeng CN, Bodzin JL, Saltiel AR. Obesity induces a phenotypic switch in adipose tissue macrophage polarization. J Clin Invest. 2007;117:175–84. doi: 10.1172/JCI29881. [DOI] [PMC free article] [PubMed] [Google Scholar]
- 14.Lumeng CN, DelProposto JB, Westcott DJ, Saltiel AR. Phenotypic switching of adipose tissue macrophages with obesity is generated by spatiotemporal differences in macrophage subtypes. Diabetes. 2008;57:3239–46. doi: 10.2337/db08-0872. [DOI] [PMC free article] [PubMed] [Google Scholar]
- 15.Strissel KJ, Stancheva Z, Miyoshi H, et al. Adipocyte death, adipose tissue remodeling, and obesity complications. Diabetes. 2007;56:2910–8. doi: 10.2337/db07-0767. [DOI] [PubMed] [Google Scholar]
- 16.Caspar-Bauguil S, Cousin B, Galinier A, et al. Adipose tissues as an ancestral immune organ: site-specific change in obesity. FEBS Lett. 2005;579:3487–92. doi: 10.1016/j.febslet.2005.05.031. [DOI] [PubMed] [Google Scholar]
- 17.Caspar-Bauguil S, Cousin B, Andre M, et al. Weight-dependent changes of immune system in adipose tissue: importance of leptin. Exp Cell Res. 2006;312:2195–202. doi: 10.1016/j.yexcr.2006.03.023. [DOI] [PubMed] [Google Scholar]
- 18.Wu H, Ghosh S, Perrard XD, et al. T-cell accumulation and regulated on activation, normal T cell expressed and secreted upregulation in adipose tissue in obesity. Circulation. 2007;115:1029–38. doi: 10.1161/CIRCULATIONAHA.106.638379. [DOI] [PubMed] [Google Scholar]
- 19.Rocha VZ, Folco EJ, Sukhova G, et al. Interferon-gamma, a Th1 cytokine, regulates fat inflammation: a role for adaptive immunity in obesity. Circ Res. 2008;103:467–76. doi: 10.1161/CIRCRESAHA.108.177105. [DOI] [PMC free article] [PubMed] [Google Scholar]
- 20.Rausch ME, Weisberg S, Vardhana P, Tortoriello DV. Obesity in C57BL/6J mice is characterized by adipose tissue hypoxia and cytotoxic T-cell infiltration. Int J Obes (Lond) 2008;32:451–63. doi: 10.1038/sj.ijo.0803744. [DOI] [PubMed] [Google Scholar]
- 21.Kintscher U, Hartge M, Hess K, et al. T-lymphocyte infiltration in visceral adipose tissue: a primary event in adipose tissue inflammation and the development of obesity-mediated insulin resistance. Arterioscler Thromb Vasc Biol. 2008;28:1304–10. doi: 10.1161/ATVBAHA.108.165100. [DOI] [PubMed] [Google Scholar]
- 22.O’Rourke RW, Metcalf MD, White AE, et al. Depot-specific differences in inflammatory mediators and a role for NK cells and IFN-[gamma] in inflammation in human adipose tissue. Int J Obes. 2009 doi: 10.1038/ijo.2009.133. [DOI] [PMC free article] [PubMed] [Google Scholar]
- 23.Sultan A, Strodthoff D, Robertson AK, et al. T cell-mediated inflammation in adipose tissue does not cause insulin resistance in hyperlipidemic mice. Circ Res. 2009;104:961–8. doi: 10.1161/CIRCRESAHA.108.190280. [DOI] [PubMed] [Google Scholar]
- 24.Duffaut C, Galitzky J, Lafontan M, Bouloumie A. Unexpected trafficking of immune cells within the adipose tissue during the onset of obesity. Biochem Biophys Res Commun. 2009 doi: 10.1016/j.bbrc.2009.05.002. [DOI] [PubMed] [Google Scholar]
- 25.Thalmann S, Juge-Aubry C, Meier C. Explant cultures of white adipose tissue. Humana Press; Totowa, New Jersey: 2008. [DOI] [PubMed] [Google Scholar]
- 26.Makino Y, Cook DN, Smithies O, et al. Impaired T Cell Function in RANTES-Deficient Mice. Clinical Immunology. 2002;102:302–9. doi: 10.1006/clim.2001.5178. [DOI] [PubMed] [Google Scholar]
- 27.Schulz EG, Mariani L, Radbruch A, Höfer T. Sequential Polarization and Imprinting of Type 1 T Helper Lymphocytes by Interferon-[gamma] and Interleukin-12. Immunity. 2009;30:673–83. doi: 10.1016/j.immuni.2009.03.013. [DOI] [PubMed] [Google Scholar]
- 28.Heckford S, Gelmann E, Agnor C, Jacobson S, Zinn S, Matis L. Distinct signals are required for proliferation and lymphokine gene expression in murine T cell clones. J Immunol. 1986;137:3652–63. [PubMed] [Google Scholar]
- 29.Patsouris D, Li P-P, Thapar D, Chapman J, Olefsky JM, Neels JG. Ablation of CD11c-Positive Cells Normalizes Insulin Sensitivity in Obese Insulin Resistant Animals. Cell Metabolism. 2008;8:301–9. doi: 10.1016/j.cmet.2008.08.015. [DOI] [PMC free article] [PubMed] [Google Scholar]
- 30.Nembrini C, Abel B, Kopf M, Marsland BJ. Strong TCR signaling, TLR ligands, and cytokine redundancies ensure robust development of type 1 effector T cells. J Immunol. 2006;176:7180–8. doi: 10.4049/jimmunol.176.12.7180. [DOI] [PubMed] [Google Scholar]
- 31.Zhu J, Paul WE. CD4 T cells: fates, functions, and faults. Blood. 2008;112:1557–69. doi: 10.1182/blood-2008-05-078154. [DOI] [PMC free article] [PubMed] [Google Scholar]
- 32.Couper KN, Blount DG, Riley EM. IL-10: the master regulator of immunity to infection. J Immunol. 2008;180:5771–7. doi: 10.4049/jimmunol.180.9.5771. [DOI] [PubMed] [Google Scholar]
- 33.Cani PD, Bibiloni R, Knauf C, et al. Changes in gut microbiota control metabolic endotoxemia-induced inflammation in high-fat diet-induced obesity and diabetes in mice. Diabetes. 2008;57:1470–81. doi: 10.2337/db07-1403. [DOI] [PubMed] [Google Scholar]
- 34.Manfredi AA, Capobianco A, Bianchi ME, PR-Q Regulation of dendritic- and T-cell fate by injury-associated endogenous signals. Crit Rev Immunol. 2009;29:69–86. doi: 10.1615/critrevimmunol.v29.i1.30. [DOI] [PubMed] [Google Scholar]
- 35.Huber J, Loffler M, Bilban M, et al. Prevention of high-fat diet-induced adipose tissue remodeling in obese diabetic mice by n-3 polyunsaturated fatty acids. Int J Obes. 2006;31:1004–13. doi: 10.1038/sj.ijo.0803511. [DOI] [PubMed] [Google Scholar]
- 36.Chun T-H, Hotary KB, Sabeh F, Saltiel AR, Allen ED, Weiss SJ. A Pericellular Collagenase Directs the 3-Dimensional Development of White Adipose Tissue. Cell. 2006;125:577–91. doi: 10.1016/j.cell.2006.02.050. [DOI] [PubMed] [Google Scholar]
Associated Data
This section collects any data citations, data availability statements, or supplementary materials included in this article.