

Abstract
Oscillatory brain rhythms and evoked responses are widely believed to impact cognition, but relatively little is known about how these measures are affected by healthy aging. The present study used MEG to examine age-related changes in spontaneous oscillations and tactile evoked responses in primary somatosensory cortex (SI) in healthy young (YA) and middle-aged (MA) adults. To make specific predictions about neurophysiological changes that mediate age-related MEG changes, we applied a biophysically realistic model of SI that accurately reproduces SI MEG mu rhythms, containing alpha (7-14Hz) and beta (15-30Hz) components, and evoked responses. Analyses of MEG data revealed a significant increase in prestimulus mu power in SI, driven predominately by greater mu-beta dominance, and a larger and delayed M70 peak in the SI evoked response in MA. Previous analysis with our computational model showed that the SI mu rhythm could be reproduced with a stochastic sequence of rhythmic ∼10Hz feedforward (FF) input to the granular layers of SI (representative of lemniscal thalamic input) followed nearly simultaneously by ∼10Hz feedback (FB) input to the supragranular layers (representative of input from high order cortical or non-specific thalamic sources) (Jones et al., 2009). In the present study, the model further predicted that the rhythmic FF and FB inputs become stronger with age. Further, the FB input is predicted to arrive more synchronously to SI on each cycle of the 10Hz input in MA. The simulated neurophysiological changes are sufficient to account for the age-related differences in both prestimulus mu rhythms and evoked responses. Thus, the model predicts that a single set of neurophysiological changes intimately links these age-related changes in neural dynamics.
Introduction
Healthy aging is accompanied by widespread and systematic neuroanatomical changes (Raz and Rodrigue, 2006; Walhovd et al., 2009) that have been linked to alterations in perceptual and cognitive abilities in older adults (Ziegler et al., 2008). In addition, MEG and EEG studies have revealed age-related changes in brain dynamics on fast (ms) time-scales, such as changes in ongoing neural oscillations and in stimulus-locked evoked responses (d'Onofrio et al., 1996; Kolev et al., 2002; Kononen and Partanen, 1993; Marciani et al., 1994; Roubicek, 1977; Babiloni et al., 2006; Niedermeyer, 1997; Rossini et al., 2007). Less is known about the effects of middle age on these phenomena.
Most of the work examining age related changes in neural rhythms has focused on the spontaneous or resting state “alpha rhythm” measured with EEG, typically defined as 7-14Hz activity. In EEG sensor data, a generalized decrease in alpha power occurs with increasing age in parietal, temporal, and occipital cortices (Babiloni et al., 2006; Niedermeyer, 1997; Rossini et al., 2007). Further, older participants show decreases in alpha and low beta power (13-25 Hz), but increased high beta power (25-30 Hz) (Roubicek, 1977). A contradictory pattern emerges from studies of task-related rhythms, which show age-related decreases in alpha power in posterior sources, but increases in alpha power in anterior sources (Niedermeyer, 1997). Such a shift has been documented in the auditory (Yordanova et al., 1998) and visual (d'Onofrio et al., 1996; Kolev et al., 2002; Kononen and Partanen, 1993; Marciani et al., 1994) systems, with many of these changes seen in middle age. Few studies have examined the effects of aging on the commonly observed somatosensory mu rhythm, which is composed of a complex of alpha and beta components (Hari, 2006; Jones et al., 2009). One EEG study used a finger extension task and found age-related increases in mu-alpha and high mu-beta (22-23 Hz) power in anterior sensorimotor electrodes (Sailer et al., 2000).
Other studies have examined age-related changes in evoked responses driven by median nerve stimulation and have found increases in the amplitudes and latencies of somatosensory-evoked potentials with advancing age (Adler and Nacimiento, 1988; Desmedt and Cheron, 1980; Ferri et al., 1996; Kakigi and Shibasaki, 1991; Luders, 1970; Ogata et al., 2009; Stephen et al., 2006) These age-related increases in peak magnitudes occur in the first 100 ms following median nerve stimulation, with the greatest differences observed between 40-90 ms. Many of the changes are apparent by middle-age. The neural mechanism underlying these changes is typically attributed to a decline in cortical inhibition with advancing age (Drechsler, 1978; Simpson and Erwin, 1983; Stephen et al., 2006), but no direct evidence supports this conclusion.
An expanding body of literature has shown that ongoing brain rhythms are causally related to changes in evoked response activity (Jones et al., 2009; Mazaheri and Jensen, 2008; Nikulin et al., 2007; Zhang and Ding, 2009), and that these modulations are correlated with changes in behavioral states, such as attention and perception (Fries et al., 2001; Linkenkaer-Hansen et al., 2004; Zhang and Ding, 2009). Despite the growing accumulation of studies showing age-dependent changes in neural rhythms, evoked response activity, and cognitive abilities, an open question is whether these measures change over the lifespan (e.g., from young to middle age). Further, there is little mechanistic understanding of the underlying neurophysiological changes related to human aging. An obvious difficulty in achieving a mechanistic understanding is that the microscopic neural activity underlying macroscopically measured MEG/EEG signals is largely unknown and difficult to derive in humans without invasive recordings. Biophysically principled neural models can be used as powerful non-invasive tools to study the underlying neural dynamics generating these signals (Jones et al., 2009; Jones et al., 2007; Murakami et al., 2003; Murakami and Okada, 2006; Okada et al., 1997).
We have recently developed a neurophysiologically-grounded laminar neural model of primary somatosensory cortex (SI) that accurately reproduces spontaneous somatosensory mu rhythms and tactile evoked responses measured with human MEG (Jones et al., 2009; Jones et al., 2007). The model contains a network of morphologically and physiologically principled excitatory pyramidal neurons and inhibitory interneurons spanning multiple cortical laminae. The model includes extrinsic feedforward and feedback excitatory synaptic inputs, defined by their laminar location of postsynaptic effects. These inputs represent feedforward (FF) lemniscal thalamic input to the granular layers of SI, and feedback (FB) input to the supragranular layers from intracortical sources or nonspecific thalamic nuclei (Felleman and Van Essen, 1991; Jones, 2001). This model can be used to identify the changes in network parameters, which have a direct neurophysiological interpretation, that produce observed changes MEG measured SI dynamics.
Here, we describe novel initial analyses of the impact of healthy aging on somatosensory dynamics, using a data set collected to address more general questions of dynamics, perception and rhythmogenesis in neocortex (Jones et al., 2007; Jones et al., 2009). We then applied computational modeling to disambiguate possible interpretations of these data. Specifically, we used MEG to examine age-related changes in spontaneous mu rhythms and tactile evoked responses from localized SI activity in healthy young adults (YA) and early middle aged adults (MA). Our main findings from the MEG data are that the beta component of the spontaneous mu rhythm is greater in MA, and that the ∼70ms peak (M70) in the tactile evoked response is also enhanced. These results provide initial evidence that both prestimulus SI mu rhythms and tactile evoked response magnitudes are increased in MA, compared to YA.
We then applied our biophysically realistic computational model of SI to predict the neural mechanisms underlying these changes. Our previous model results showed that the SI mu-rhythm could be reproduced by driving the SI network with two alternating ∼10Hz inputs that contacted SI in FF and FB connection patterns, respectively. The relative alpha to beta power expressed in SI depended on the delay between and relative strength of the inputs (Jones et al., 2009). Based on these previous model results and our current MEG findings, we set forth to test two alternative predictions for the observed increase in mu-beta in MA: (A) that mu-beta dominance in MA, relative to YA, results from a decrease in the delay between 10Hz FF and FB inputs, or that (B) the FF-FB delay is the same in both groups and the mu-beta dominance arises from “stronger” FB inputs. Comparison of model results and MEG data supported prediction (B), leading to specific hypotheses about the cellular-level neural events that intimately link modulations in ongoing rhythmic activity with evoked response magnitudes in MA.
Materials and Methods
MEG experiment
MEG data were collected from 10 right-handed healthy adults aged 23-43 years (mean = 31 years; 6 female) with no known neurological or psychiatric conditions during performance of a tactile detection paradigm. All of the participants in our study had either obtained a Ph.D. or were enrolled in a doctoral-level graduate program at the time of the study, yielding a relatively homogeneous cohort in terms of educational demographics. In addition to MEG recordings, a high-resolution T1-weighted structural (MPRAGE) MRI scan was collected for each participant for dipole source localization analysis. The experimental protocol was approved by the Massachusetts General Hospital Internal Review Board and each participant gave informed consent prior to data acquisition. Previous publications have described the stimulus delivery system, behavioral paradigm, MEG data acquisition, and MEG source analysis (Jones et al., 2009; Jones et al., 2007). We summarize them here.
Stimulus paradigm
A piezoelectric device delivered single 100Hz sine wave taps (10 ms duration) to digit 3 of the right hand; participants responded with a button press using their left hand to indicate whether they had detected the stimulus on each trial. Stimulus strength was dynamically maintained at a perceptual threshold level (50% detection) using a dynamic algorithm (Jones et al., 2007). Supra-threshold stimuli (10% of all trials; 350 μm deflection; 100% detection) and null trials (20% of all trials) were randomly interleaved. Trial duration was 3 sec. Each participant completed 8 runs with 120 trials. The beginning of each trial was indicated by a binaural 60dB, 2kHz auditory cue, which remained constant during the entire 2 sec trial duration. During the auditory cue, the 10 ms finger tap was delivered between 500–1500 ms from trial onset in a randomized event-related design. The number of trials of a given latency to tap was randomly distributed during each run. The auditory cue ended ≥ 500 ms after the tactile stimulus and 1000 ms before the next trial began.
MEG data acquisition
Neuromagnetic responses were recorded using a 306-channel Elekta NeuroMag VectorView MEG system with 102 sites, each composed of a triplet of two planar gradiometers and a magnetometer. To record vertical and horizontal electro-oculogram (EOG) signals, two pairs of bipolar electrodes were placed above and below the left eye and lateral to the right and left eyes. To coregister each participant's anatomical MRI scan with the MEG sensors, four head position indicator (HPI) coils were placed on each participant's head. The MEG data were sampled at 600Hz with the bandpass set to 0.01 – 200 Hz. Responses were averaged on-line for quality control. During the off-line analysis, we re-averaged the data using a bandpass of 0.1 –200 Hz. The chosen high-pass filter corner frequency was low enough to retain possible slow variations in the dc level of the neural signals while eliminating low-frequency environmental noise. Epochs with EOG peak-to-peak amplitude exceeding 150 μV were excluded from the analysis.
MEG source analysis
Isolation of the SI contribution to the field data was described in detail in two previous studies (Jones et al., 2007, Jones et al., 2009) and we summarize these methods here.
We used equivalent current dipole (ECD) source analysis to locate a primary ECD in SI contralateral to the side of stimulus presentation and all analyses were performed on the time course of activity from this source. We initially modeled the data with two dipoles in contralateral SI and SII determined by a supra-threshold tactile evoked response as described below (consistent evoked activity was not observed in ipsilateral SII, or in other brain areas), and then considered the forward solution from only the SI source. The 2-dipole fit to the field data was optimized using signal-space projection (SSP) (Tesche et al., 1995; Uusitalo and Ilmoniemi, 1997), and a least-squares fit with the dipole forward solution was calculated using the spherically symmetric conductor model (Hamalainen and Sarvas, 1989; Sarvas, 1987). We began by fitting a contralateral SI ECD at the time peak activity in the average response from a suprathreshold stimulus (avg. 12 trials; mean= 68ms s.d.=8ms). We then removed the SI ECD contribution to the field using SSP, and fit a second ECD to the residual ECD in contralateral SII (Nishitani and Hari 2000; Tesche et al., 1995; Uusitalo and Ilmoniemi 1997). Confirmation of dipole locations in the hand area 3b of SI, and SII, were confirmed with anatomical MRI registration in 7 out of 10 participants. Dipoles were manually placed in 2 of the remaining 3 participants such the SI source was placed in the finger representation of area 3b within the anterior bank of the post-central gyrus (Moore et al. 2000; Penfield and Rasmusson 1950; Sastre-Janer et al. 1998; Uematsu et al. 1992; White et al. 1997; Yousry et al. 1997), and the SII dipole source was placed in the parietal operculum. Both of these subjects belonged to the MA group (36 and 43 yrs). For one of the 10 subjects, anatomical MRI data could not be obtained. In this case, SI dipole localization was determined by field contours on the spherical head model consistent with the predicted position of contralateral SI. This subject belonged to the YA group (31 yrs). The goodness-of-fit of the two-dipole model was larger than 70% in all fit data during peak responses. The effect of the second ECD was then removed using SSP and we refit the SI ECD to the residual. The forward solution from SI ECD location was used to model all responses.
We cannot rule out the possibility that the presence of a continuous auditory mask in our task affected our source localizations or some other aspect of somatosensory oscillations or evoked responses, because of the close proximity between auditory cortex and SII. To mediate localization confounds, we visually inspected the SI and SII localizations on MRI data in 9 of the participants, as described above. Further, we employed an event-related random designed in our tactile stimulation paradigm so that the somatosensory stimuli were not time-locked to the auditory cue. Thus, it is unlikely that the presence of the auditory cue affected the significance of our age-related or between-group comparisons.
MEG spectral analysis
We computed time-frequency representations (TFRs) of the SI ECD timecourses by convolving the SI signals with a complex Morlet wavelet of the form , for each frequency of interest f0, where σt = m/2πf0, and i is the imaginary unit. The constant m defining the compromise between time and frequency resolution was 7 and the normalization factor was . The normalization factor used is the same as that in our previous study (Jones et al., 2009) and is such that the sum of the magnitude of the wavelet coefficients for all frequencies is one, unlike that preserving sum of squared magnitudes of the wavelet coefficients used in, e.g., (Tallon-Baudry et al. 1997), which allowed for better visualization of higher frequency beta activity. The choice of normalization factor did not affect the significance of our age-related results (see Supplementary Figure 1). TFRs of power were calculated as the squared magnitude of the complex wavelet-transformed data, as in our previous study (Jones et al., 2009). We generated TFRs for each participant over the entire mu frequency range 7-29Hz for 1000 ms prior to stimulus onset and, in each figure except Figures 1C and 9D, measures of mu (7-29Hz), mu-alpha (7-14Hz) and mu-beta (15-29Hz) power were determined from these TFRs. In Figures 1C and 9D, we calculated power spectral densities (PSDs) using Welch's periodogram method, implemented in Matlab, for frequencies from 3-30 Hz with overlapping 0.5 sec windows. Identical TFR and Welch's calculation methods were employed on both the MEG and model data allowing us to relate the model predictions directly to the experimental observations.
Figure 1. Age-related changes in MEG SI mu rhythms.
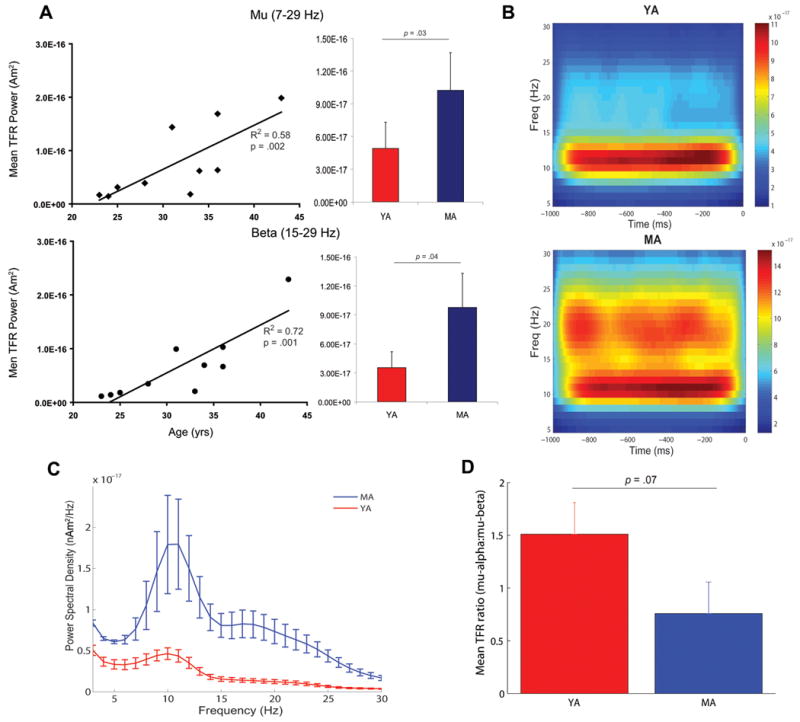
A, Left panels Regression plots of prestimulus power in the mu (7-29 Hz, top) and mu-beta (15-29 Hz, bottom) ranges calculated from TFR spectrograms as a function of age. Significant correlations (p < 0.05) are indicated by solid regression lines. Right panels. Bar plots of mean and s.e. for time-averaged TFR power (1 sec, n=200 trials) in each frequency range for the YA (red) and MA (blue). B. Average prestimulus TFRs for the YA (top) and MA (bottom). The unit of power is (Am)2. C. Average prestimulus power spectral density plots for the YA (blue) and MA (red), s.e. bars. D. Mean (+ s.e.) TFR ratios of mu-alpha to mu-beta power for the YA (red) and MA (blue). The TFR ratio was > 1 for YA and < 1 for MA (p = 0.07).
MEG waveform analysis
To uncover age-related differences in the amplitude and symmetry of SI ECD oscillations, we bandpass filtered the SI signal for 1000 ms prior to stimulus onset for each trial over the mu frequency range (7-29 Hz). We then found the local maxima (peaks) and minima (troughs) in the filtered data over the prestimulus period and calculated peak-to-trough time differences (illustration in Jones et al., 2009). To calculate the amplitude of the oscillations, we identified the time points corresponding to each peak and trough, used these to obtain signal values from the unfiltered SI data, and measured the distance between the absolute value of each peak and trough. We then computed a symmetry index on the absolute values of the unfiltered peak and trough data using the equation (peak − trough)/(peak + trough). Thus, a positive symmetry index indicates greater amplitude peaks and a negative value indicates greater amplitude troughs, whereas a value close to zero indicates that an oscillation was symmetric around zero.
SI ECD evoked responses were averaged over threshold-level stimulation trials (n=200 trials per participant) for each participant and then averaged across YA and MA groups (see group definitions in statistical analysis section below). For comparisons of M50 and M70 peak response amplitudes, these values were calculated as the mean from 45-55ms, and 75-90ms, respectively. For comparison of M70 peak latencies, the M70 response was calculated as the minimum in 60-90 ms; we then calculated the slope of the response from the M70 minimum to 100 ms.
Statistical analysis
For each measure of interest in the MEG data (mu/alpha/beta power, TFR alpha to beta ratio, oscillation symmetry index, oscillation amplitude, and evoked response parameters) significance of age related changes was determined by sorting the data by increasing age across the 10 participants and performing a linear regression analysis. In addition, for direct comparison to computational model results, we tested group differences in the MEG data from the 5 youngest (YA; mean age = 26 yrs) and 5 oldest (MA; mean age = 36 yrs) participants using two-tailed independent sample t-tests. Group membership was assigned based on a median split of age. Significance persisted in these group comparisons despite the small group sample sizes. Paired t-tests were similarly used to assess significant differences across trials in the YA and MA model simulations.
Computational Neural Model
The computational neural modeling used in the present study was previously developed and used for studies of the neural basis of MEG measured SI tactile evoked responses and spontaneous rhythmic activity (Jones et al., 2009; Jones et al., 2007). The details of the model, methods, supporting literature, and the code for our original smaller network model (Jones et al., 2007) is available to the public on the NEURON modelDB website at http://senselab.med.yale.edu/modeldb/ShowModel.asp?model=113732. Here, we describe key features of the model construction.
Local Network Configuration
The SI cortical column network model consisted of a 2-dimensional grid 100 multiple-compartment excitatory pyramidal neurons (PNs) with 35 single compartment inhibitory interneurons (INs) evenly interleaved per layer in layers II/III and V (Jones et al., 2009). Supplementary Figure 2 shows a schematic illustration of the local network structure. Fast and slow excitatory (AMPA/NMDA) and inhibitory (GABAA/GABAB) synapses were simulated with a symmetric 2-dimensional Gaussian spatial spread and inverse Gaussian delay with rise/decay time constants and reversal potentials, respectively as: AMPA 0.5/5ms, 0mV; NMDA 1/20ms, 0mV; GABAA 0.5/5ms, -80mV; GABAB 1/20ms, -80mV. The maximum synaptic conductances and Gaussian weight space constants are described in Table 1 of Jones et al., 2009.
Morphology and physiology of individual cells
The IN in each layer were simulated with single compartments and contained instrinsic current kinetics (sodium, potassium, and leak currents) that created spiking activity. Layers II/III and V PN were simulated with 8 and 9 segments, respectively, and contained active currents in both the somatic and dendritic compartments, such that layer II/III PNs produced adapting spike trains (via sodium, potassium, adaptation M-current, and a leak current) and the layer V PNs produced bursting responses to injected current (via the addition of two types of calcium currents, a mixed cation h-current, and a potassium-activated calcium current).
Exogenous drive to the SI network
We modeled ongoing mu rhythms and SI evoked responses by stimulating the network with sequences of exogenous inputs to the local SI model. A full description and default parameters for these drives are summarized in Tables 1 and 2 and in (Jones et al., 2009). Here, we briefly detail important features for the current analysis.
Table 1.
| YA | MA | |
|---|---|---|
| Delay between ∼10 Hz FF and FB input | 5 ms | 5 ms |
| Number of spikes in input burst | 10 | 10 |
| Variance of FF input burst | 400 | 400 |
| Variance of FB input burst | 600 (less synchrony) | 200 (more synchrony) |
| Post-synaptic conductance of FF and FB inputs | 0.00002 pS | 0.00004 pS |
Table 2.
| Feedforward (FF) Feedback (FB) Late Feedforward (LFF) |
Input times across trials (ms) | YA Maximal conductance (μS) Default AMPA/NMDA | MA Maximal conductance (μS) Default AMPA/NMDA |
|---|---|---|---|
| FF to L2/3e | 25 | 0.0005 | 0.001 |
| FF to L2/3i | 0.001 | 0.002 | |
| FF to L5e | 0.00025 | 0.0005 | |
| FF to L5i | 0.0005 | 0.001 | |
| FB to L2/3e | 7 | 0.0005/0.0005 | 0.001/0.001 |
| FB to L2/3i | 0.00025/0.00025 | 0.0005/0.0005 | |
| FB to L5e | 0.0005/0.0005 | 0.001/0.001 | |
| LFF to L2/3e | 135 | 0.00265 | 0.0053 |
| LFF to L2/3i | 0.00265 | 0.0053 | |
| LFF to L5e | 0.00265 | 0.0027 | |
| LFF to L5i | 0.00265 | 0.0027 |
Architecture of feedforward (FF) and feedback (FB) drive
FF drive emerged from layer IV (modeled to reflect lemniscal thalamic input) and contacted the layer II/III neurons, with a delayed and weaker connection to layer V neurons (see Supplementary Figure 2B for illustration and poststimulus dendritic compartments). For all FF inputs, the maximal conductance onto INs was twice as strong as that onto PNs. FB drive (representative of input from high-order cortices or nonspecific thalamic sources) contacted the distal apical dendrites of each PN neural population and layer II/III INs (Supplementary Figure 2C).
Stochastic ongoing rhythmic FF and FB drive
We have previously shown that SI mu rhythms analogous to those observed experimentally can be simulated with ongoing ∼10Hz FF followed by FB input to the SI network (Jones et al., 2009). A schematic illustration of this input is shown in Supplementary Figure 3 and is described here in detail. The ongoing rhythmic input was simulated by delivering 10 “burst” spike trains, each consisting of 2 spikes with an ISI = 10 ms to the SI network in a FF synaptic activation pattern. All 10 bursts arrived approximately every 100 ms such that the arrival time for each burst was chosen from a Gaussian random distribution (mean ISI 100 ms, default of variance of 10 input bursts = 400 ms). On each cycle, an input patter with the same number of bursts and arrival time statistics reached the SI network in a FB synaptic activation pattern. This input, however, was delayed from the FF input by 5 or 50 ms for the simulations in the present study. Changes in the effective strength of the ongoing rhythmic FF and FB input were simulated by varying the number of “bursts” (i.e., number of 2-spike burst events) on each cycle, the variance of the arrival time of each “burst” at the SI network on each cycle of the 10Hz input, or the maximal postsynaptic conductance of the inputs.
Each simulation was stochastically regulated by the arrival time of each of the FF and FB input bursts as follows. On each cycle of the rhythmic input, the timing of each 2-spike burst event was chosen from gaussian distributions with means fixed at 100 ms intervals (e.g., 0, 100, 200 ms, etc) and a variance of 400 ms. All other parameters were fixed during each simulation with the following default values: FF-FB delay = 5 ms, number of input bursts = 10, variance of input bursts = 400 ms, maximal FF and FB postsynaptic conductances 0.4 pS onto PN and 2 × 0.4=0.8 pS onto IN. Synaptic weights and delays were distributed by a symmetric 2-D Gaussian spatial profile with maximal weight and minimal delay (0 ms) for FF inputs to layer II/III and 1 ms to layer V) in the center and weight space constant = 100 and delay space constant = 100 for all connections.
Evoked response inputs
SI tactile evoked response were simulated with a sequence of FF input, followed by FB, followed by a re-emergent late FF (LFF) input (see Table 2 for timing and post-synaptic conductance) at various phases in a simulated mu-alpha and mu-beta cycles and averaged (Jones et al., 2009; Jones et al., 2007).
Calculation of net current dipole
The SI ECD moment was calculated as the net sum across the PN populations of the intracellular currents flowing in a direction perpendicular to the longitudinal axis of the apical dendrite multiplied by the corresponding length of the dendrite (Murakami et al., 2003, Murakami and Okada, 2006, Jones et al., 2007, Jones et al., 2009).
Simulations
All simulations used the shareware software program NEURON available at http://www.neuron.yale.edu/neuron/. The fixed-time-step-implicit-Euler integration had a time increment of dt=0.05 ms. Simulated evoked responses were smoothed by convolution with a 15 ms box filter. Upon publication, the code that produced all simulated data in this paper will be available on the ModelDB website http://senselab.med.yale.edu/senselab/modeldb/.
Results
MEG experiment
Mu rhythm changes with age
To examine the effects of middle age on the spontaneous mu rhythm in SI, we computed the average power in the calculated TFRs over all trials for the entire mu range (7-29Hz) from the 1000 ms prestimulus time period, as well as for the mu-alpha (7-14Hz) and mu-beta (15-29Hz) subcomponents. All references to power in our results were derived from this TFR calculation and the same analysis was used in all participants, except in Figure 1C where power spectral densities (PSDs) were calculated with Welch's methods (see Methods). Regression analyses showed a significant age-related increase in average mu power (Figure 1A, top left panel; r2 = .58, p = 0.002). The change in mu power was largely driven by an age-related increase in mu-beta (Figure 1A, bottom left panel; r2 = .71, p = 0.001). Mu-alpha power showed only a trend toward a positive correlation with age (r2 = .21, p = 0.07, data not shown). Group comparison of time-averaged TFR power between the 5 YA and5 MA confirmed an age-related increase in mu (t(8) = -2.6, p = 0.03) and mu-beta (t(8) = -2.4, p = 0.04), but not mu-alpha (t(8) = -1.7, p = 0.12) power (Figure 1A, right panels). These age-related changes are visible in average prestimulus TFRs for the grouped YA and MA (Figure 1B). The average TFRs showed a clear predominance of mu-alpha in the YA, whereas the MA showed enhanced mu-beta in addition to slightly increased mu-alpha power. Age related increases in mu-power, and specific enhancement of mu-beta activity, are also apparent in PSD calculations averaged across groups (Figure 1C, mean and s.e.). A large peak near 10Hz and a small peak near 20Hz are apparent in the PSD from the MA adults, while only a smaller 10Hz peak is prevalent in the YA.
Effects of age on relative dominance of mu-alpha and mu-beta
To compare the relative dominance of mu-alpha vs. mu-beta power with age, we calculated the ratio of TFR mu-alpha to mu-beta power in small time windows. Specifically, we calculated a TFR for each 1 sec prestimulus epoch. We then divided the prestimulus TFR into 10 bins (100 ms each) for each epoch and computed the mean power in the mu-alpha and mu-beta ranges in each bin, averaged these measures over all trials, and then computed a ratio of mean mu-alpha to mean mu-beta power for each participant (referred to as the TFR ratio). We found a marginally significant negative correlation between the ratio of mu-alpha to mu-beta power and age (r = -.52, p = 0.06, data not shown), indicating that YA showed dominant mu-alpha, while MA showed a dominant mu-beta, and that these changed almost linearly with age We then computed group average ratios for the 5 YA and 5 MA (Figure 1D) and found a trend toward a decrease in the ratio in the MA, compared to YA (t(8) = 2.1, p = 0.07).
Effects of age on oscillation symmetry and amplitude
We investigated two additional features of the SI mu rhythm, the symmetry of the oscillation waveform around zero and the amplitude of the oscillation. We first identified the peaks and troughs of oscillations occurring during each 1000 ms prestimulus period and calculated a peak-to-trough symmetry index for each trial. We previously reported that the symmetry index did not differ significantly from zero when grouped across all 10 participants (Jones et al., 2009). Here, we present a similar analysis with the data grouped by age. Figure 2A shows a grand total histogram (200 trials per participant) of the symmetry index values color coded for each group (red YA, blue MA). A one-sample t-test confirmed that the mean symmetry index over all trials was not significantly different from zero for either group (YA, p = 0.22; OA, p = 0.41). Further, the mean symmetry indices did not differ significantly between the two groups (t(8) = -0.92, p = 0.38). Linear regression analysis confirmed that the symmetry indices did not correlate significantly with age (r = .26, p = 0.46).
Figure 2. Symmetry and amplitude of prestimulus MEG oscillations.
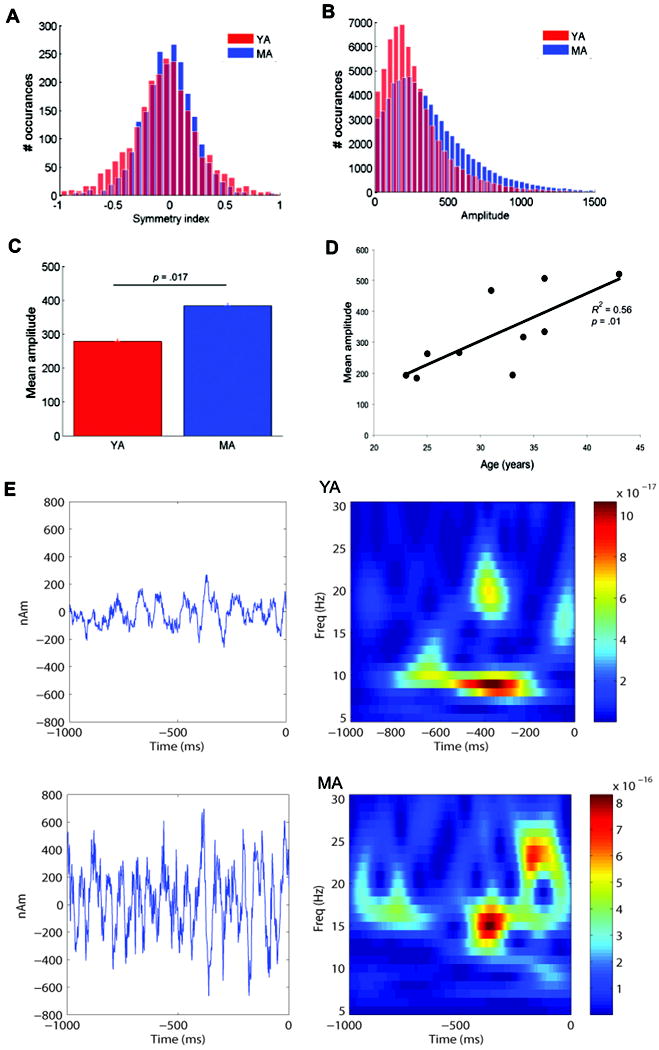
A. Histogram of symmetry indices for the prestimulus (1000 ms) period over all trials for the YA (red) and MA (blue). B. Histogram of peak-to-trough amplitudes during the prestimulus period for the YA and MA. C. Mean prestimulus peak-to-trough amplitudes for each group (s.e. bars). Amplitudes were significantly greater for the MA (p = 0.017) D. Regression plot of mean amplitudes by age (p = 0.01). E. Example single-trial prestimulus waveforms (left) and corresponding TFR plots (right) for one YA and one MA showing the single trial variability and symmetry of the oscillation around zero in both groups with greater amplitude oscillations in the MA. The unit of power in the TFR is (Am)2.
We then used similar analysis to examine peak-to-trough amplitudes between the groups (Figure 2B), and found that the mean amplitudes over all trials were significantly greater in the MA, when compared to YA (t(8) = -3.4, p = 0.01; Figure 2C). Linear regression analyses confirmed that amplitudes increased significantly with age (r = .75, p = 0.01; Figure 2D). This increase in oscillatory amplitude contributed to the increase in mu power with age. Figure 2E depicts example single trial 1Sec waveform and TFR time-course calculations for a YA and MA. The oscillation waveforms emphasize the difference in the amplitude of the oscillations across groups. The single trial TFR time-courses highlight the fact that the alpha and beta components are variable in time and power on single trials and often non-overlapping, a measure that was quantified in (Jones et al, 2009). These single trial features are directly comparable to the model data (Figure 7E).
Figure 7. Simulating age-differences in the SI mu rhythm.
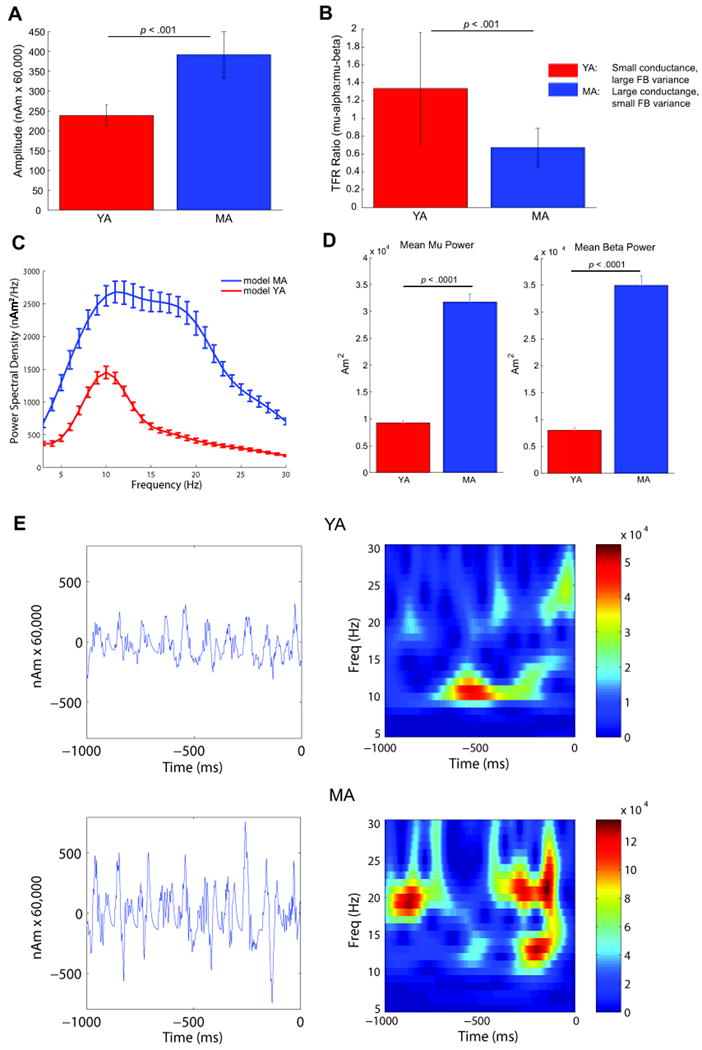
Using the parameter regime outlined in Table 1, the computational model was able to reproduce each of the observed group comparison age-related characteristics of the MEG data: When averaging over multiple trials (n=25 each group), the model reproduced A) larger mean amplitudes of oscillations in the MA model data, and B) a TFR mu-alpha to mu-beta ratio >1 for YA and <1 for MA. C. Average power spectral density plots for the modeled YA (blue) and MA (red) data. D. Time-averaged TFR power estimates were significantly larger in the MA simulations in mu and mu-beta range (p<0.001). E. Individual trial waveforms and spectrograms showing single trial variability and symmetric oscillations, with increased amplitude oscillations and greater beta dominance in the simulated MA compared to YA model data (bottom). Panels A-D depict mean and s.e. across trials.
Effects of age on early evoked responses
To investigate the effect of middle age on post-stimulus SI dynamics, we computed average evoked responses from a threshold-level tactile stimulus (175 ms poststimulus, n = 200 trials per participant) for each participant. Previous results have shown that the tactile stimulus employed created a waveform from 0 - 175 ms post-stimulus with consistent characteristics across participants. This evoked response is dominated by a negative polarity peak at ∼70ms (M70) and positive polarity peaks at ∼50, ∼100 and ∼135ms (M50, M100 and M135, respectively) (Jones et al., 2007, Jones et al., 2009). These peaks persisted in the current analysis when averaged across YA and MA groups (Figure 3). When compared to YA, MA showed a significantly greater M70 peak (M70 = mean 75-90 ms, t(8) = -3.1, p = 0.01) and a trend toward a greater M50 peak (M50 = mean 45-55 ms, t(8) = -2.1, p = 0.06). A regression analysis on the M70 peak response confirmed that the M70 peak amplitude showed a trend toward increasing significantly with age (r = .6, p = 0.10). Further, MA showed a significantly longer latency of the M70 minimum (defined as the minimum between 60-90 ms: YA mean = 79.9 ± 11.1 ms, MA mean = 63.3 ± 4.3 ms, t(8) = 2.5, p = 0.03) and exhibited a trend toward a steeper slope from the M70 minimum to the M100 peak (M100 = 100 ms response; YA mean = 2.0 ± 1.0, MA mean = 4.7 ± 2.5, t(8) = -1.9, p = 0.09).
Figure 3. Age-related difference in the early MEG SI evoked response.
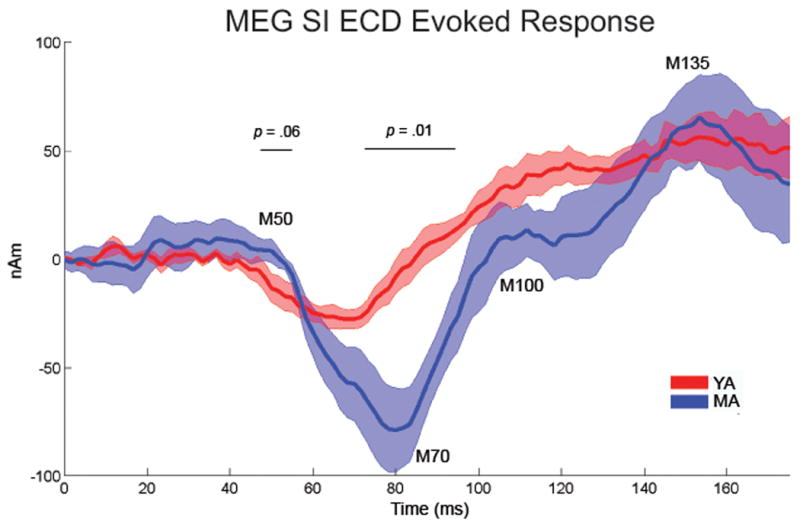
Evoked SI ECD responses for the first 175 ms after stimulation for the YA (red) and MA (blue) (shaded region depicts s.e.). The MA group showed a significantly greater magnitude M70 peak (p = 0.01), longer latency of this peak (p = 0.03), and trends toward a greater ∼50ms response (p = 0.06) and slope from the M70 to 100 ms response (p < 0.09).
Summary of changes in MEG SI activity with age
In summary, we found that SI activity in MA was characterized by a preferential increase in mu-beta power (Figure 1A-C), resulting in a trend toward a TFR mu-alpha to mu-beta ratio > 1 in YA but < 1 in MA (Figure 1D). In addition, while the SI oscillation waveform remained symmetric around zero in both groups, the amplitude of the oscillation was significantly increased in MA compared to YA (Figure 2). These changes occurred in conjunction with a corresponding increase in evoked response magnitudes and timings (Figure 3), suggesting that the neural mechanisms that cause changes in the spontaneous mu rhythm may modulate changes in the evoked response. Below we use a biophysically realistic computational neural model of SI to predict the neural mechanisms underlying these changes.
Predictions Generated by Computational Neural Model
Previous Modeling Results
We developed a laminar model of SI to study the neural origin of the MEG measured SI tactile evoked responses and spontaneous mu rhythms (Jones et al., 2007, 2009). Here we review details of our previous results that are pertinent to our current study on the effects of middle age.
The model contained a local synaptically coupled network of 100 excitatory pyramidal neurons and 35 inhibitory interneurons in infra- and supra-granular layers. It was driven exogenously with feedforward (FF) and feedback (FB) excitatory inputs that contact all neurons in layer II/III and layer VI, respectively (Supplementary Figure 2). The SI current dipole signal that we recorded with MEG was simulated as the net intracellular current flow across the pyramidal neuron populations (Jones et al., 2009; Jones et al., 2007; Murakami et al., 2003; Murakami and Okada, 2006; Okada et al., 1997). This model accurately reproduced characteristic features of the recorded spontaneous SI mu rhythm when driven with a stochastic sequence of ∼10Hz FF input followed by ∼10Hz FB input (Jones et al., 2009, see Supplementary Figure 3 for schematic illustration of rhythmic input). The relative mu-alpha to mu-beta power expressed in the network depended on the delay between the rhythmic inputs and on the relative strength of those inputs. Nearly equal mu-alpha to mu-beta expression occurred when the ∼10Hz rhythmic FF and FB arrived at the network almost synchronously (5 ms delay), whereas asynchronous inputs (50 ms delay) created a predominantly mu-alpha frequency rhythm. These results were derived previously by calculating averaged ratio of mu-beta/mu-alpha power over a 1 sec time window (Jones et al., 2009).
Figure 4 shows the time course of the expressed mu rhythm with a 1 sec TFR when the mean delay between the rhythmic FF and FB inputs was set to 5 ms (Figure 4A) or 50 ms (Figure 4B) (other parameters were set on each cycle of the rhythmic input at FF and FB input number = 10, input variance = 400, and postsynaptic conductance=0.4e-5 milli-Siemens). Figures 4C and D show the corresponding waveforms of the oscillations, and Figures 4E and F show mean mu-alpha and mu-beta powers over the 1 sec time window. When the FF-FB delay was 5 ms, the expressed mu-alpha and mu-beta powers were nearly equal and the oscillation waveform was small in amplitude and ‘jagged,’ reflecting higher frequency components. When the delay was 50 ms, the oscillation was larger in amplitude and smoother with mu-alpha power dominance.
Figure 4. The effect of the delay between the rhythmic 10Hz FF and FB inputs on the simulated SI mu rhythm.
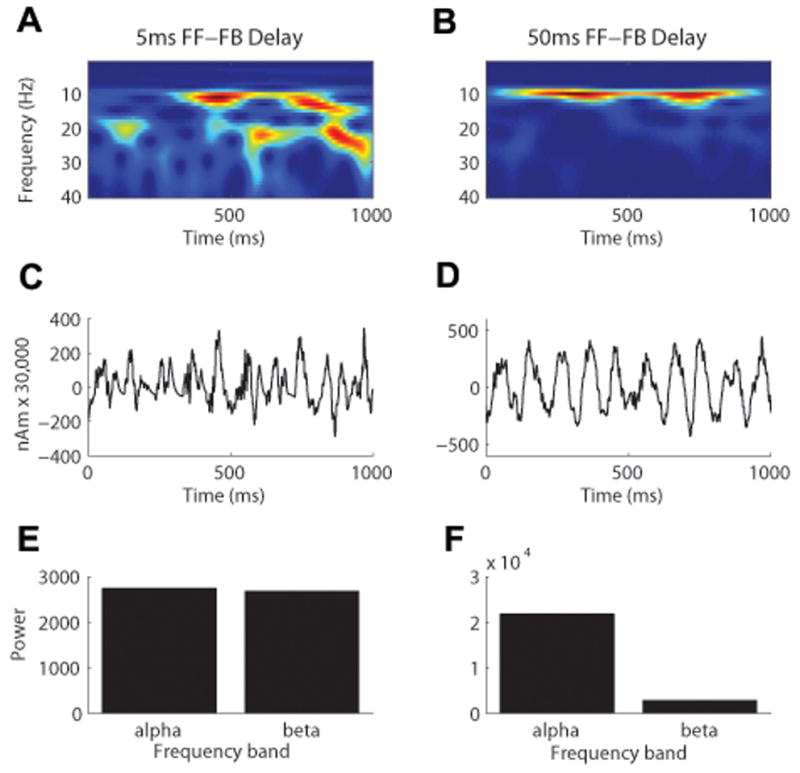
A. A 5 ms FF-FB delay shows that both mu-alpha and mu-beta components emerge in the TFR. The unit of power is (Am)2. B. A 50 ms FF-FB delay shows that only mu-alpha emerges significantly in the TFR. C. Corresponding waveform for 5 ms delay. D. Corresponding waveform for 50 ms delay. E. The average mu-alpha and mu-beta power calculated from the TFR are approximately equal with a 5 ms delay. F. The average mu-alpha power is greater than mu-beta with a 50 ms delay.
Our previous study also reported that, with a fixed delay between FF and FB inputs, increasing the strength of the rhythmic FF inputs enhanced mu-alpha power, while increasing the strength of the FB inputs enhanced mu-beta power. The strength of the input was modulated in three ways: increased synchrony of the ‘input burst’ on each cycle of the 10Hz input; more spikes in the ‘input burst’; and greater post-synaptic conductances of the driving inputs (Supplementary Figure 3). These results were also derived previously by calculating averaged ratio of mu-beta/mu-alpha power over a 1 sec time window (Jones et al., 2009). For further illustration of the effects of increased FF and FB input strength on mu-alpha and mu-beta expression, the TFRs and waveforms over the entire 1 sec window are shown in Supplementary Figure 4, over various changes in input strength.
Predictions on the neural origin of differences in the mu rhythm with age
Based on the previous model results, we arrived at two predictions as to the neural origin of increased mu-beta expression in the MA group. One prediction, referred to as Prediction A, is that the mu-beta dominance occurs from a decrease in the delay between the 10Hz FF and FB input creating the rhythm, from a near 50ms delay in YA to a near 5ms delay in MA. An alternate prediction, referred to as Prediction B, is that in both groups the FF-FB delay is 5 ms, but MA have effectively ‘stronger’ FB inputs compared to FF inputs creating mu-beta dominance.
We tested these two predictions to see which would reproduce the mu-beta increase MA and meet other defining characteristics of the oscillation, including a maintained symmetry index near zero, larger amplitude oscillations in MA, and a TFR mu-alpha to mu-beta ratio greater than 1 in YA and less than 1 in MA.
Testing Prediction A
To test prediction A, we began with a parameter regime that reproduced a mu rhythm consistent with the SI MEG data pooled across the entire sample (Jones et al., 2009, FF = FB conductance = 0.4e-5 mS, FF = FB number of input spikes = 10, FF = FB variance of input spikes = 400 ms). We then compared the effects of 5 ms and 50 ms delays between the rhythmic ∼10Hz FF and FB input on the symmetry index and TFR mu-alpha to mu-beta ratios of the produced oscillation. Consistent with the MEG data, we found that both delays produced a symmetry index that was not significantly different from zero. In addition, the 5 ms delay created a TFR mu-alpha to mu-beta ratio that was < 1, and the 50 ms delay created a TFR mu-alpha to mu-beta ratio that was > 1 (Figure 5), consistent with the YA vs MA MEG data (Figure 1D). With at 50 ms delay, however, the TFR ratio was more than five times larger than the TFR ratios in the MEG data (Figure 1D). This difference in TFR ratios came from the fact that this simulation showed virtually no mu-beta and only large amplitude alpha oscillations (Figures 4B and 4D), which was not consistent with the MEG results. Further, the model TFR ratio was more than five times greater than the experimental data over a range of FF and FB postsynaptic input conductances (data not shown).
Figure 5. The effect of the delay between the rhythmic 10Hz FF and FB inputs on symmetry indices and TFR mu-alpha to mu-beta ratios.
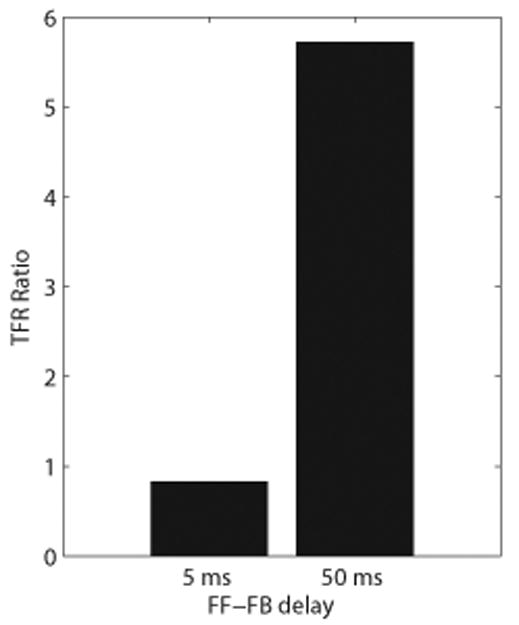
Increasing the FF-FB delay from 5 ms to 50 ms increased the TFR mu-alpha to mu-beta ratio from slightly <1 to a value >1. The increase to a 50ms delay, however, produced a nearly 5-fold increase in the TFR ratio, which was not consistent with changes from YA to MA (see Figure 1D), thus negating model prediction A.
Thus, predication A, that the mu-beta dominance in MA arises from a decrease in the delay between the 10Hz FF and FB inputs from ∼50 ms to ∼5ms, was not supported, because the TFR mu-alpha to mu-beta ratios and oscillation amplitudes were excessively large when a 50 ms delay was used. Next, we tested whether prediction B that YA and MA each had near synchronous FF-FB rhythm input (i.e., 5 ms delay), with effectively stronger FB inputs in MA, could reproduce each of the observed age-related features of the MEG SI signal.
Testing Prediction B
To test prediction B, we assumed that the delay between the FF and FB inputs remained constant near synchrony at 5 ms for both groups. We then asked whether a biophysical change in the relative strength of the FF and FB inputs could cause the TFR ratio to go from a value above 1 for YA to below 1 for MA while the symmetry index remained fixed near zero for both groups. We calculated the symmetry index and TFR mu-alpha to mu-beta ratio for various FF and FB input strengths simulated as changes in parameters controlling the effective strength of the FF and FB ‘input burst’ on each cycle of the ongoing ∼10Hz rhythm (Supplementary Figure 3). These changes were simulated with increases in the relative weight of the postsynaptic conductance of the ‘input burst’ (Figure 6A), number of spikes in the ‘input burst’ on each cycle (Figure 6B), and variance of spikes in the ‘input burst’ on each cycle (Figure 6C).
Figure 6. The effect of the strength of the 10Hz FF and FB input on symmetry indices and TFR mu-alpha to mu-beta ratios.
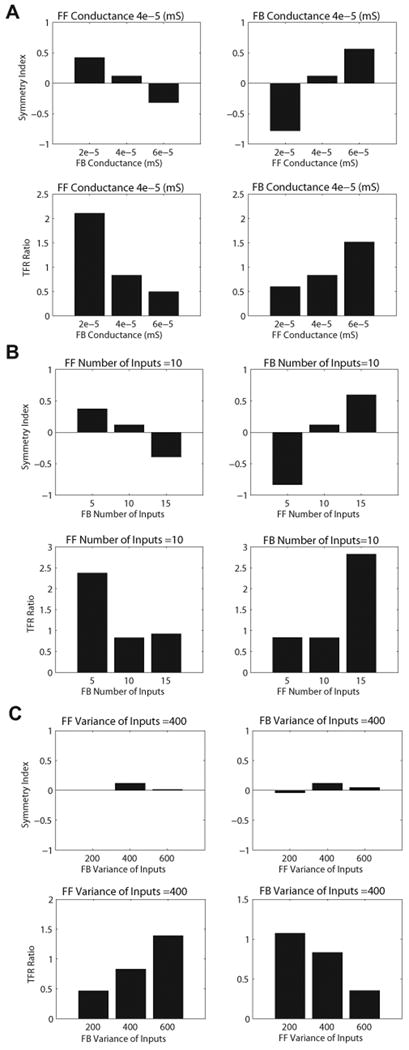
For a fixed 5 ms delay between the rhythmic FF and FB input we manipulated the strength of the inputs via changes in the (A) post-synaptic conductance, (B) number of spike in the input burst on each cycle of the input, and (C) variance of spikes in the input burst on each cycle of the input (see Supplementary Figure 3). A. Increasing the post-synaptic conductances of the rhythmic FB input (left), while holding FF post-synaptic conductances constant, resulted in a decrease in the symmetry indices (top) and a decrease in the TFR mu-alpha to mu-beta ratio (bottom). The opposite pattern was found when the post-synaptic conductances of the FF input was increased, while holding FB conductances constant (right). B. Increasing the number of inputs on each cycle of the rhythmic FB input (left), while holding FF number constant, led to a decrease in symmetry indices and a decrease in the TFR ratio; the opposite pattern was found when the number of FF inputs were increased (right), while holding FB number constant. C. Increasing the variance of the inputs on each cycle the rhythmic FB input (left), while holding the FF variance constant, had a minimal effect on the symmetry indices, but resulted in a relative decrease in the TFR ratios. Increasing the variance of the rhythmic FF input (right), while holding the FB variance constant, again resulted in a relatively constant symmetry index, but led to an increase the TFR ratio.
We found that increasing the postsynaptic conductance of the FB input relative to a fixed FF post-synaptic conductance decreased the symmetry index from above to below zero, and drove the TFR mu-alpha to mu-beta ratio from a value greater than 1 to a value less than 1 (Figure 6A left panel). When we increased the FF weight relative to a fixed FB weight (Figure 6A right panel), the opposite effect emerged.
The symmetry index was above zero when the FF input conductance was stronger, because on each cycle of the rhythmic ∼10Hz input the intracellular current flow (our measure of MEG current dipole activity) was being driven more strongly up the pyramidal neuron apical dendrites, creating an oscillation that shifted toward more positive polarity. In contrast, the symmetry index was below zero when the FB input conductance was stronger, because intracellular current flow was driven more strongly down the pyramidal neuron apical dendrites, creating an oscillation that shifted toward more negative polarity (compare oscillation waveforms in the left and right hand middle panels of Supplementary Figure 4A). When the FF and FB input conductance were equal the symmetry index was near zero. The TFR ratio was above 1 when the FF input conductance was stronger because alpha power exceeded beta power, but the TFR ratio was below 1 when the FB input conductance was stronger due to greater beta than alpha power (compare TFR spectrograms and bar plots of power in Supplementary Figure 4A).
While the described increase in relative postsynaptic conductance of the ongoing rhythmic FB input created changes in TFR mu-alpha to mu-beta ratios that mimicked differences between YA and MA (i.e., TFR ratios from > 1 to < 1 with increased FB conductance, Figure 6A), the symmetry index did not remain fixed near zero, which is inconsistent with the MEG data.
We then tested whether changes in the number or variance of spikes in the ‘input bursts’ on each cycle of the rhythmic ∼10Hz FF and FB input (Supplementary Figure 3) could create the observed change in the TFR ratio in MA, while maintaining a stable symmetry index. We found that increasing the number of FB inputs relative to a fixed number of FF inputs decreased the TFR mu-alpha to mu-beta ratio from above 1 to below 1, as occurred in MA (Figure 6B). This change, however, also decreased the symmetry index. In contrast, increasing the FB input variance (decreasing the synchrony of the inputs bursts) compared to a fixed FF input variance, and vice versa, maintained a relatively stable symmetry index (p<0.01) (Figure 6B), while also increasing the TFR mu-alpha to mu-beta ratio from below 1 to above 1. Thus, we conclude that, for a fixed 5 ms delay between the 10Hz FF and FB input, increase in synchrony of the FB input bursts on each cycle of the input (i.e., decrease in variance) can drive the TFR mu-alpha to mu-beta ratio from above to below one while maintaining a stable symmetry index near zero, in agreement with changes that occur from YA to MA in the MEG data.
Reproducing amplitude differences
The remaining age-related difference in SI activity that we investigated the neural source of with our computational model was the change in the amplitudes of the oscillations with age, which were about two times greater in MA, compared to YA (Figure 2). We began by testing whether the simulated changes in the relative FF and FB variance that thus far accurately reproduced the different TFR ratios and symmetry indices in the two groups (YA, FF input variance = 400, FB input variance = 600; MA, FF input variance = 400, FB input variance = 200) also created a difference in the oscillation amplitudes. We found that, for a fixed FF variance, increasing the FB variance, which decreased the mu-beta power and was consistent with the YA simulations thus far, slightly increased the amplitude of the oscillations (Supplementary Figure 4), and vise versa. This effect is the opposite of that seen in the MEG data, where YA had smaller amplitude oscillations.
Next, we simulated the decrease in the amplitude of the oscillations in YA by decreasing the strength of both the FF and FB inputs (via the postsynaptic conductance), while maintaining a larger FB input variance in YA. We found that when the weight of postsynaptic conductances of FF and FB inputs were 50% smaller, the amplitude of the oscillations were approximately two times smaller, consistent with the MEG data for YA (Figure 7A compared to Figure 2C).
Thus, our model showed that the observed age-related differences in the SI mu rhythm could be reproduced by maintaining a fixed and almost synchronous delay (5 ms) between the ongoing ∼10Hz FF and FB inputs in YA and MA. Further, in MA the strength of both the rhythm FF and FB inputs were increased, and the variance of the FB inputs was decreased (increased synchrony). Table 1 describes the parameter regime that reproduced these results. Figures 7A-D show results from simulations using these parameters averaged over 25 trials (mean and s.e.) for the calculated amplitudes, TFR ratios, symmetry indices, PSDs, and time-averaged TFR power estimates in YA and MA, each of which is consistent with the MEG data.
Figure 7A (compare to Figure 2C) shows that the mean oscillations amplitudes are significantly smaller in the YA compared to MA simulations (p < 0.001). The actual amplitude of the simulated SI ECD oscillation in the model was multiplied by a scaling factor of 60,000 (see also Figure 7E) and predicts that on the order of 60,000 × 200 PNs (100 in each layer) = 1.2 million PNs contribute to the observed SI mu rhythm. This prediction is in line with an estimated cortical space that lies within the volume of the human hand representation, defined as the omega shaped bend in the postcentral gyrus (Moore et al., 2000). Figure 7B (compare to Figure 1D) shows that the mean TFR mu-alpha to mu-beta ratio is significantly larger in the YA compared to MA simulations (p < 0.001), while this effect was marginally significant in the MEG data (p = 0.06). We found that the symmetry indices for the YA and MA simulations were significantly different (p < 0.001), unlike the MEG data. As in the MEG data, however, neither group means differed significantly from zero. Figure 7C (compare to Figure 1C) shows PSDs calculated for each group. Similar to the MEG data, the MA simulations have overall greater mu power than the YA simulations, and the model MA data has peaks near 10 and 20Hz while the YA data only has a clear peak near 10Hz. Figure 7D (compare to Figure 1A, right panel) shows that time-averaged TFR power significantly increases between YA and MA simulations in the mu, alpha and beta ranges (p<0.001, in each case). Figure 7E (compare to Figure 2E) shows the variability on single 1 sec trials in the model SI waveform and TFR time-courses. As in the MEG data, on single trials, the oscillation amplitudes are clearly smaller and TFR alpha and beta components are variable in time and power.
Next, we examined how the YA and MA parameter regimes influenced the SI evoked response in the model.
Predicted neural origin of age dependent difference in evoked responses
We have previously shown that the observed tactile evoked response can be reproduced in the model by simulating a sequence of driving inputs to the network that consists of a FF input at ∼25 ms poststimulus, followed by a FB input at ∼70 ms, and a subsequent late FF input at ∼135 ms (Jones et al., 2007, Jones et al., 2009). This sequence could be interpreted as initial lemniscal thalamic input arriving to the cortex at ∼25 ms, followed by a feedback input from a high-order cortical area or a nonspecific thalamic source to the supragranular layers at ∼70 ms, followed by a re-emergent lemniscal thalamic input at ∼135ms. In simulating the evoked response in this manner, we reproduced the timing, magnitude and polarity of peaks in the SI ECD tactile evoked responses (Jones et al., 2007, Jones et al., 2009).
Previous model results also showed that the power of the prestimulus mu rhythm directly influenced the magnitude of the evoked response (Jones et al., 2009). Specifically, the model showed that higher prestimulus mu-alpha and mu-beta increased the amplitude of an early response at approximately 50 ms (M50) via increased depolarization in pyramidal and inhibitory neurons, and decreased the subsequent M70 peak response due to a preferential recruitment of inhibition (Jones et al., 2009). The prestimulus mu power did not affect the later > 70 ms components of the evoked response. These predictions were confirmed in the MEG data (Jones et al., 2009).
In the current study, we tested whether differences in the parameters of the model that reproduced the age differences in the prestimulus mu rhythm could also account for the age differences in the evoked response.
We simulated an evoked response during an ongoing mu rhythm in YA and MA parameter regimes described in Table 1. The evoked response input conductances were consistent with those that gave accurate amplitudes of a threshold level response in our previous paper (Jones et al., 2009). However, analogous to the simulated differences in the ongoing mu rhythm for YA vs MA, in the YA simulations the postsynaptic conductances of the evoked FF-FB-LFF input sequence were decreased by 50% (Table 2). We simulated an evoked response to begin at 20 equally spaced ‘starting phases’ in a mu-alpha cycle and 10 in a mu-beta cycle for each group (Jones et al., 2009) and averaged the results. The ‘starting phase’ was defined as the time of the initial FF leminiscal thalamic input to the network that was followed 45ms later by a FB input, and 65ms later by a LFF input.
The described changes in the prestimulus mu rhythm and in the evoked response conductances were sufficient to produce the observed age-related changes in the MEG evoked response data (compare Figure 8 to Figure 3). Specifically, compared to the YA simulations, the MA simulations showed a significantly greater M70 peak (M70 = mean 75-90 ms, p = 0.01; Figure 8) and a trend toward a greater M50 peak (M50 = mean 45-55 ms, p = 0.08). Further, the MA simulations showed a significantly steeper slope from the minimum M70 response (defined as the minimum between 60-90 ms for each trial) to the 100 ms M100 peak (YA model mean = 1.1 ± 1.7, MA model mean = 5.7 ± 2.2, p < .0001). While the latency of the M70 minimum was slightly later in the MA model data, this difference was not significant in the model data (YA model mean = 77.8 ± 8.2, MA model mean = 79.5 ± 6.5, p = 0.39). Notably, there is an apparent discrepancy between the MEG and model data in that the amplitude of the evoked response after 100 ms appears to remains larger in the simulated MA compared to YA data. However, this effect did not reach significance.
Figure 8. Simulating age-differences in the SI evoked response.
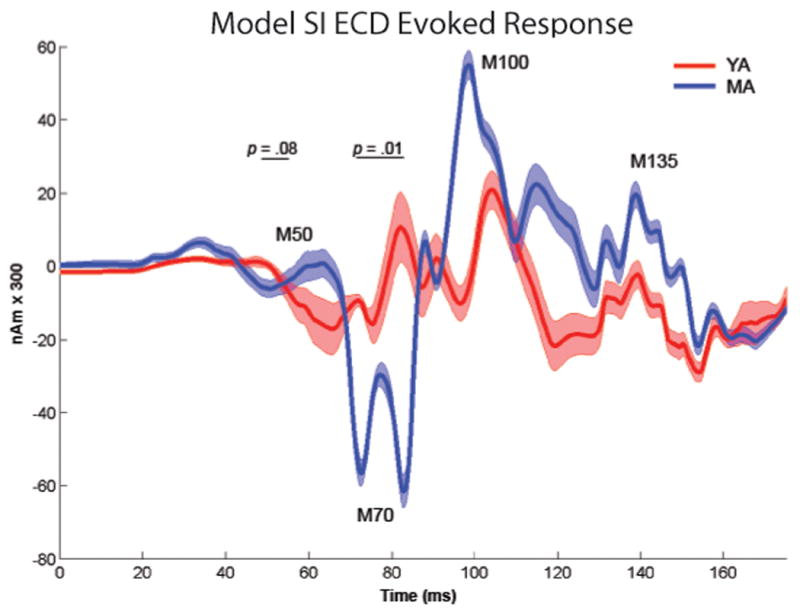
Simulating an evoked response sequence with FF-FB-LFF input, as described in the results, during ongoing YA and MA mu rhythms reproduced the age-differences observed in the MEG evoked response, including a greater magnitude M70 peak (p = 0.01), a greater slope from the M70 to 100ms response (p < .0001) and a trend toward a decreased M50 response (p = 0.08) in the MA simulation. Mean and s.e. shown over n=30 trials per group.
Summary of predicted neural origin of changes in MEG SI activity in middle age
Our model predicted that the delay between the 10Hz FF and FB inputs that created the ongoing SI mu rhythm was relatively stable with age and nearly synchronous (∼5 ms). In MA, the variance of the FB ‘input bursts’ became smaller relative to the variance of the FF inputs (i.e., the FB inputs arrive more synchronously to the SI network), and the strength of both the FF and FB inputs, simulated as increased post-synaptic conductance, was larger. These manipulations in the model accurately reproduced the age-related characteristics of the MEG data, including larger amplitude oscillations in MA (compare Figure 7A to Figure 2C), a trend toward a TFR mu-alpha to mu-beta ratio >1 for YA and <1 for MA (compare Figure 7B to Figure 1D), a symmetry index that was not significantly different from zero for either group, and qualitatively similar PSDs (compare Figure 7C to 1C) and individual trial waveforms and spectrograms (compare Figure 7E to Figure 2E). Further, analogous changes in the parameters of the evoked response inputs (increased postsynaptic conductances of the FF-FB-LFF inputs) created the differences in the tactile SI evoked response (compare Figure 8 and Figure 3). Thus, the model showed that the predicted neurophysiological changes in MA accounted for the changes in the spontaneous SI mu rhythm and in the evoked response and hence these neurophysiological changes explicitly link these phenomena.
Discussion
The present study compared the spontaneous SI mu rhythm and tactile evoked responses in YA and MA using MEG, and used a computationally realistic laminar model of SI to make specific predictions about the underlying neurophysiological bases for the observed age differences. To document changes that occur during middle age, we restricted our study to healthy participants between the ages of 23-43 years of age. Linear regression and group comparison analyses of the MEG data revealed a significant age-related increase in prestimulus mu power in SI calculated from TFRs, driven predominately by the emergence of greater mu-beta dominance in MA (Figure 1). In addition to this increase in TFR mu power, we found that the amplitude of the prestimulus oscillations was greater in MA, but that the symmetry of the oscillations was not affected by age: both YA and MA exhibited largely symmetric oscillations (Figure 2). We found that when averaging across groups the early evoked response in SI also showed age-related changes, with the MA showing a significantly larger and delayed M70 peak and a trend toward a greater M50 peak and slope from the M70 to M100 response (Figure 3). We emphasize that these data were not initially collected to address questions of aging. A more extensive data set will be required to elaborate the current findings and delineate more subtle aspects of the impact of aging on somatosensory rhythmogenesis and its correlation with tactile performance.
By testing a variety of biophysically interpretable parameters, we reproduced each of the age-related changes in our computational model of SI. Expanding on previous modeling results that showed MEG-measured SI mu rhythms could be reproduced by simulating ∼10 FF input followed by FB input (Jones et al., 2009), our current results predicted that the delay between the rhythmic 10Hz FF and FB input remains nearly synchronous (∼5 ms) in YA and MA. Further, the model predicted that by middle age there is a generalized strengthening of both the rhythmic FF and FB inputs and the variance of the FB inputs is decreased. In this manner, the model was able to reproduce oscillations that are largely symmetric, but that exhibit increased amplitude and a greater mu-beta dominance in MA, when compared to YA (Figure 7). Further, using the same parameter changes, the model was also able to reproduce the observed effects of age on the early evoked response (Figure 8), simulated as a sequence of FF – FB – LFF inputs (based on Jones et al., 2007). Thus, using a realistic computational model of laminar SI, we have derived specific predications about the neurophysiological changes that occur with healthy aging that give rise to differences in both MEG-measured SI rhythmic and evoked response activity between YA and MA.
Age-related changes in the mu rhythm
The present finding of an age-related increase in the power of the spontaneous somatosensory mu rhythm, driven primarily by the mu-beta component in our analysis, and to a lesser extent by mu-alpha, is consistent with prior studies that reported greater alpha and beta power in sensorimotor EEG electrodes in older adults during the execution of a motor task (Sailer et al., 2000). In contrast, studies that have examined spontaneous alpha and beta rhythms in non-somatosensory areas tend to report age-related decreases in alpha power and coherence in posterior cortices (Babiloni et al., 2006; Niedermeyer, 1997; Rossini et al., 2007). These contrasting results may arise from a critical difference in the age range of the participants examined in previous reports compared to the present study. We limited our age range to YA and MA, whereas previous studies have typically sought differences that occur much later in the lifespan (e.g., older adults above 60 years of age). Thus, the present study provides new information about changes in the somatosensory system that occur early in the course of healthy aging. Taken together with findings from past studies that examined older participants, our results raise the possibility that spontaneously occurring low frequency rhythms tend to exhibit an inverted U function, increasing in power during middle age and diminishing with advanced age.
In addition, prior studies tended to focus solely on changes in the alpha rhythm, rather than assessing both alpha and beta rhythms, and in fact, consistent with our results, one study that did examine spontaneous beta rhythms reported an increase in high-beta power (25-30 Hz) from 30 to 60 years (Roubicek, 1977). The general lack of investigation of beta frequency activity may be due, in part, to differences in recording techniques and data analysis methods: When measured using MEG and calculating TFRs of power, as in the present study, the somatosensory mu rhythm contained prominent mu-alpha and mu-beta subcomponents, whereas when measured using EEG, the dominant alpha component alone was typically observed (Kuhlman, 1978; Zhang and Ding, 2009).
A prior study by Nikulin and Brismar (2006) investigated the influence of age on cross-frequency phase-locking between alpha and beta activity measured with EEG across the brain. This study found that 10-20Hz phase-locking was strongest in middle age (defined as 25.7-45 yrs) compared to young (14.3-25.7 yrs) and older age (45.0-65.6 yrs). Further, these effects were most predominant in posterior areas, as compared to frontal and central areas. Cross frequency phase-locking between alpha and beta frequencies has also been shown to be a salient characteristic of MEG measured activity, including above rholandic regions, that increased with a mental arithmetic task (Palva et al., 2005). This effect was strongest over short inter-areal distances (Palva et al., 2005). Based on these findings, we investigated cross-frequency 10 to 20Hz phase-locking (measured with a phase-locking statistic (PLS) as in Lachaux et al., 2009) in our prestimulus SI signal and the influence of age on this measure (Supplementary Figure 6). We found that the PLS was more significant in the YA than MA groups (mean PLS YA=0.04, mean PLS MA=0.08) but that there was no significant difference between groups (p=0.39, Supplementary Figure 6A) nor a linear correlation with age (p=0.3, Supplementary Figure 6B). The model data showed a similar trend of YA simulations having smaller PLS than MA, but neither group reached significance in the model data, likely due to the smaller number of trials in each group (Supplementary Figure 6C). Our finding that the mean PLS value was less significant in MA age seems to contrast the finding of Nikulin and Brismar 2006. However, their middle age group contained participants with a range of ages that spans both our YA (23-31 yrs) and MA (33-43 yrs) classifications and a valid comparison between studies cannot be made.
Given that several subjects showed significant 10-20Hz phase-locking (Supplementary Figure 6B), it was also possible that our symmetry index measures where biased by this 2:1 phase-locking which can be sensitive to changes in alpha-beta phase differences and alpha-beta amplitude ratios. Therefore, we also tested if there was a correlation between symmetry indices and PLSs and found that there was no significant correlation (p=0.87, Supplementary Figure 6D).
Age-related changes in somatosensory evoked responses
Our analyses also revealed that the early components of the tactile SI evoked response differed between YA and MA. The most notable difference was a significantly increased magnitude of the M70 peak in MA, compared to YA, which the model predicted resulted from stronger post-stimulus feedback input in MA. This peak also occurred significantly later in MA and the slope between 70 and 100 ms was steeper than in YA. Other studies of somatosenory evoked potentials in MA and OA that used stronger median nerve stimulation also reported greater magnitudes and latencies of peaks in the first 100 ms following stimulus onset (Adler and Nacimiento, 1988; Desmedt and Cheron, 1980; Ferri et al., 1996; Kakigi and Shibasaki, 1991; Luders, 1970; Stephen et al., 2006). The present study is the first to report that these increases occur in a localized region of SI during delivery of threshold-level tactile stimuli and that they appear in middle age. Further, our study is the first to investigate concomitant changes in both the prestimulus and evoked response period using the same experimental paradigm.
Model-based predictions about the neural origin of age differences
The present study goes beyond previous work by employing a biophysically realistic model of laminar SI to make specific predictions about the neural substrates that give rise to the age-related changes in the MEG data. This model provides unprecedented insight into the putative neural substrates underlying age-related changes in the spontaneous mu rhythm and the evoked response. We have previously shown that the model can accurately reproduce spontaneous MEG SI mu rhythms from a combination of stochastic ∼10Hz FF and FB inputs that arrive to the SI cortex with a nearly synchronous (5 ms) delay (Jones et al., 2009). Further, the evoked response can be reproduced with a sequence of FF-FB-LFF inputs (Jones et al., 2007). In addition, model analyses reported here indicated that the emergence of beta dominance in the mu rhythm in middle age arises from changes in the ongoing ∼10Hz FF and FB input. The delay between these inputs remains fixed near synchrony (5ms) with age, but in MA, compared to YA, the variance of the FB inputs is decreased (e.g., increased synchrony in these inputs) and the strength of FF and FB inputs is increased (produced by increasing post-synaptic conductances). Similar changes in the evoked response inputs reproduced the observed differences in the MEG evoked response. Hence, the model predicts that a single set of neurophysiological changes intimately links the age-related differences in the prestimulus and evoked response SI activity.
Relation between model predictions and prior neurophysiological studies
Our previous modeling results predicted that the neural mechanisms responsible for higher power spontaneous mu-alpha and mu-beta components directly influence the magnitude the early SI evoked response, and these predictions were confirmed in the MEG data (Jones et al, 2009). Specifically, the model predicted when the prestimlus mu power was higher, there was an increased ongoing depolarization in excitatory and inhibitory neurons, with a preferential effect on inhibitory interneurons, This prestimulus depolarization in turn led to an evoked response with an increased ∼50 ms response (M50) and subsequently reduced M70 peak (Jones et al., 2009). In the present study, the trend toward an increased ∼50 ms response in MA with higher mu rhythms was consistent with the direct effect of increased mu power on this early evoked response. However, the increased strength of the post-stimulus ∼70ms FB input in the MA model data effectively overrode the inhibitory depolarization during the ongoing rhythm and, rather than decreasing the M70 response, the heightened FB created a more pronounced M70 peak (Figure 10).
Previous studies often concluded that age-related increases in the somatosensory evoked response (near 70ms) arose from decreased levels of intracortical inhibition (Drechsler, 1978; Simpson and Erwin, 1983; Stephen et al., 2006). Declines in inhibitory function are a cardinal feature of aging, with stereological studies in rats pointing toward a decreased ratio of presumptive inhibitory to excitatory synapses in sensorimotor cortices of old brains (Brunso-Bechtold et al., 2000; Poe et al., 2001), but no direct evidence exists that links these cellular changes to somatosensory evoked responses in humans. Our modeling results demonstrate an alternate prediction to the idea of decreased inhibition in creating the enhanced M70 peak, namely that it can be achieved simply by increasing the FB drive to SI. Further, the age related decline correlated with decreased inhibition is typically observed in participants who are above middle age and in whom the spontaneous rhythms may have decreased.
Based on the construction of our model of SI, the source of increased FB in MA could come from activity in high-order association cortices, or alternatively, from nonspecific thalamic inputs that contact supragranular layers (Jones, 2001; Jones et al., 2007). This prediction is consistent with a prominent theme that emerges from the fMRI literature on aging: When compared to YA, older adults tend to show increased activation of high-order association cortices, including prefrontal cortex, when performing a variety of cognitive and perceptual tasks (Cabeza, 2002; Grady et al., 1994; Onozuka et al., 2003; Fernandes et al., 2006; Emery et al., 2008). While it is difficult to bridge findings from fMRI and MEG/EEG studies, it is possible that a generalized increase in association cortex activity could provide the necessary FB enhancement to drive the greater M70 peak seen in our MEG and modeling data.
An important prediction from our model is that rhythmic feedback inputs to SI in MA need to be more synchronous, compared to YA, in order to generate an increased mu-beta rhythm that oscillates symmetrically around zero. Studies of task-related rhythms support this notion by showing a general posterior-to-anterior shift in the expression of low-frequency oscillations with age (Niedermeyer, 1997), which implies increased synchronous low frequency activity among these neurons. Further, phase-locking of alpha oscillations is increased in frontal electrodes in middle-aged adults (Kolev et al., 2002; Yordanova et al., 1998), and several studies have established that in young adults, SI mu rhythms are coupled, in terms of phase-locking and coherences, to alpha and beta rhythms in prefrontal and other association cortices (Hanslmayr et al., 2007; Palva et al., 2005; Schubert et al., 2008; Zhang and Ding, 2009). It remains unknown whether such coherence or phase-locking between frontal and somatosensory areas changes with age, but these earlier reports support our proposal that increased synchrony in frontal neurons results in greater FB drive to SI.
It is important to note, however, that the present results do not preclude the possibility that the FB inputs arise from a non-specific thalamic source that is oscillating with a slight phase-shift from that of the lemniscal thalamic driver (Guillery and Sherman, 2002; Hughes and Crunelli, 2005; Jones, 2001). Indeed, the requirement that the inputs to the model be separated by a small delay (∼ 5 ms, and thus nearly synchronous), may be more consistent with a thalamic source of feedback that is distinct from feedback inputs from high-order cortices onto SI. When compared to our knowledge of prefrontal and other association cortices, far less is known about the effects of age on the cellular and physiological integrity of the thalamus. In terms of gross volume, the thalamus shows significant age-related decline, with several studies reporting a linear trajectory of volume loss across the lifespan (Cherubini et al., 2009; Sullivan et al., 2004; Walhovd et al., 2005). It is unclear, however, whether such changes emerge during middle age. The few histological studies that have examined the effects of age on individual nuclei in nonhuman animals have largely focused on the sensory nuclei of the thalamus, which tend to show subtle, but significant, age-related declines in neuron density (Ahmad and Spear, 1993), but not in total number of neurons (Ahmad and Spear, 1993; Satorre et al., 1985). It is possible that the net effect of the age-related decrease in neural density diminishes inhibition in the thalamus and thus effectively increases the output to the cortex. Potentially inconsistent with our prediction of increased FB inputs with age, functional studies indicate an age-related attenuation of fMRI signal in the thalamus, as measured using fMRI (Onozuka et al., 2003), and increased peak-to-peak latencies (representing conduction times) from the medial lemniscus to the thalamus and to the sensory cortex (Kakigi, 1987). Such changes, however, are typically attributed to peripheral receptor deficits that result in decreased drive to sensory nuclei of the thalamus, and not nonspecific nuclei. Thus, additional research is needed to determine whether age-related changes exist in the anatomical and functional integrity of nonspecific thalamic nuclei that could translate into increased feedback of the sort implicated by our model.
Relation between mu rhythms and tactile detection
Although the stimulus paradigm used here did not allow us to examine age-related differences in tactile perception (the stimulus intensity was maintained at a level that yielded a 50% detection rate, tailored to each individual participant), it is reasonable to speculate that age-related differences in spontaneous prestimulus mu power could directly influence somatosensory detection. Indeed, a vast literature documents age-related changes in somatosensory perceptual abilities (Schneider and Pichora-Fuller, 2000), including increases in tactile detection thresholds (Gescheider et al., 1996; Verrillo, 1982; Verrillo et al., 2002) and decreases in the subjective magnitude of vibrotactile sensation (Verrillo, 1982; Verrillo et al., 2002). Older adults also show decreased tactile discrimination ability at suprathreshold levels, while discriminative capacities at the detection threshold appear to be less affected by age (Gescheider et al., 1996). Several studies of healthy young adults have shown that prestimulus mu-alpha and mu-beta oscillations in somatosensory cortices predict subsequent detection of weak tactile stimuli (Linkenkaer-Hansen et al., 2004; Schubert et al., 2008; Zhang and Ding, 2009). It is likely, therefore, that the age-related changes in the mu rhythm noted here are associated with differences in tactile detection. A thorough examination of this hypothesis may provide a deeper understanding of the mechanisms underlying sensory and perceptual deficits that are often seen with advanced age.
Supplementary Material
A) Prestimulus TFRs averaged across the YA (top) and MA (bottom) groups. The unit of power is (Am)2. B) mean TFR ratios of prestimulus mu-alpha to mu-beta power in 100 ms time bins against age for the YA (red) and MA (blue).). The TFR ratio was > 1 for YA and < 1 for MA (p = 0.074). For each participant, ratios were averaged over all trials (n=200) and time (1 sec).
A. Local network synaptic connections between multiple compartment pyramidal neurons (PNs, green) and single compartment inhibitory neurons (INs, red). ‘Bold’ outlined dendrites were contacted. Within layer PN-to-PN synapses (not shown) were also present on dark green outlined dendrites. B. Excitatory feedforward input connections. The black arrow is schematic, because lemniscal thalamic input was not explicitly modeled. C. Excitatory feedback-input connections from presumed higher order cortical or non-specific thalamic neurons. The feedforward and feedback inputs were modeled as spike train generators with a predetermined temporal profile and synaptic strength. D. Schematic of the Network Architecture: The network activity of 100 multi-compartment pyramidal neurons (PNs) in layers II/III and V (green), interconnected with 35 inhibitory interneurons (INs) per layer (not shown), were simulated using the software NEURON. (reproduced as in Jones et al., in press with permission from J. Neurophys.)
Every ∼100ms (Gaussian, mean ISI 100ms, s.d.=20ms), 10 ‘bursts’ of input (doublet spike trains, ISI 10ms) excite the SI network in a FF connection pattern followed by an analogous delayed FB input. Red and blue arrows depict intracellular current flow. FF inputs induce current flow up the dendrites and FB inputs current flow down the dendrites. (reproduced as in Jones et al., in press with permission from J. Neurophys.)
For a fixed 5 ms delay between the rhythmic FF and FB input we manipulated the strength of the inputs via changes in the (A.) post-synaptic conductance, (B.) number of spike in the input burst on each cycle of the input, and (C.) variance of spikes in the input burst on each cycle of the input (see Supplimentary Figure 3). TFR plots (top), example waveforms (middle), and mean mu-alpha and mu-beta power calculated from the TFRs (bottom) are shown, for three values of each parameter. The left columns show the effect of increased FF relative to FB parameters, the middle column shows the effect of equal FF and FB parameters, and the right column shows the effect of lower FF compared to FB parameters. In all cases, when the FF input strength is effectively increased compared to the FB input strength, mu-alpha power is increased. In contrast, when the FB input strength is effectively increased compared to the FF input strength, mu-beta power is increased. Further, when the strength of the FF and FB inputs are equal, the mu-alpha and mu-beta are approximately equal.
With a fixed variance of the rhythmic FF inputs on each cycle of 400 ms, increasing the variance of the FB inputs (which increases relative mu-beta amplitude) resulted in a stepwise increase in the peak-to-trough amplitude of oscillations (left). In contrast, when the variance of the rhythmic FB input was fixed, increasing the FF variance (which increases mu-alpha amplitude) led to a decrease in the mean amplitude of oscillations.
We calculated10-20Hz phase-locking statistics (PLS) in our MEG and model SI data using methods as in Lachaux et al., 1999, where we first band passed the signal in the 7-29Hz mu range. A) The PLS was more significant in the YA than in the MA (mean PLS YA=0.04; mean PLS MA=0.08), but there was no significant difference between groups (p=0.39) nor was there B) a significant correlation between PLS and age (p = 0.30). C) The model data showed a similar trend of YA simulations having smaller PLS than MA but neither group reached significance likely due to the smaller sample size (n=25 trials) (model YA PLS =0.19; model MA PLS =.0.69). D) Phase locking statistics did not correlate significantly with symmetry indices (p = .87).
Acknowledgments
The authors wish to thank Michael Hines for excellent technical support in NEURON software code. This work was supported by NIH: P41RR14075, K25MH072941, 1RO1-NS045130-01, T32 GM007484, NSF: 0316933, the Athinoula A. Martinos Center for Biomedical Imaging, the McGovern Institute for Brain Research.
Footnotes
Publisher's Disclaimer: This is a PDF file of an unedited manuscript that has been accepted for publication. As a service to our customers we are providing this early version of the manuscript. The manuscript will undergo copyediting, typesetting, and review of the resulting proof before it is published in its final citable form. Please note that during the production process errors may be discovered which could affect the content, and all legal disclaimers that apply to the journal pertain.
References
- Adler G, Nacimiento AC. Age-dependent changes of short-latency somatosensory evoked potentials in healthy adults. Appl Neurophysiol. 1988;51:55–9. doi: 10.1159/000099383. [DOI] [PubMed] [Google Scholar]
- Ahmad A, Spear PD. Effects of aging on the size, density, and number of rhesus monkey lateral geniculate neurons. J Comp Neurol. 1993;334:631–43. doi: 10.1002/cne.903340410. [DOI] [PubMed] [Google Scholar]
- Babiloni C, Binetti G, Cassarino A, Dal Forno G, Del Percio C, Ferreri F, Ferri R, Frisoni G, Galderisi S, Hirata K, Lanuzza B, Miniussi C, Mucci A, Nobili F, Rodriguez G, Luca Romani G, Rossini PM. Sources of cortical rhythms in adults during physiological aging: A multicentric EEG study. Hum Brain Mapp. 2006;27:162–72. doi: 10.1002/hbm.20175. [DOI] [PMC free article] [PubMed] [Google Scholar]
- Brunso-Bechtold JK, Linville MC, Sonntag WE. Age-related synaptic changes in sensorimotor cortex of the brown norway x fischer 344 rat. Brain Res. 2000;872:125–33. doi: 10.1016/s0006-8993(00)02515-4. [DOI] [PubMed] [Google Scholar]
- Cabeza R. Hemispheric asymmetry reduction in older adults: The harold model. Psychol Aging. 2002;17:85–100. doi: 10.1037//0882-7974.17.1.85. [DOI] [PubMed] [Google Scholar]
- Cherubini A, Peran P, Caltagirone C, Sabatini U, Spalletta G. Aging of subcortical nuclei: Microstructural, mineralization and atrophy modifications measured in vivo using mri. Neuroimage. 2009;48:29–36. doi: 10.1016/j.neuroimage.2009.06.035. [DOI] [PubMed] [Google Scholar]
- d'Onofrio F, Salvia S, Petretta V, Bonavita V, Rodriguez G, Tedeschi G. Quantified-EEG in normal aging and dementias. Acta Neurol Scand. 1996;93:336–45. doi: 10.1111/j.1600-0404.1996.tb00006.x. [DOI] [PubMed] [Google Scholar]
- Desmedt JE, Cheron G. Somatosensory evoked potentials to finger stimulation in healthy octogenarians and in young adults: Wave forms, scalp topography and transit times of parietal and frontal components. Electroencephalogr Clin Neurophysiol. 1980;50:404–25. doi: 10.1016/0013-4694(80)90007-3. [DOI] [PubMed] [Google Scholar]
- Drechsler F. Quantitative analysis of neurophysiological processes of the aging cns. J Neurol. 1978;218:197–213. doi: 10.1007/BF00313013. [DOI] [PubMed] [Google Scholar]
- Emery L, Heaven TJ, Paxton JL, Braver TS. Age-related changes in neural activity during performance matched working memory manipulation. Neuroimage. 2008;42:1577–86. doi: 10.1016/j.neuroimage.2008.06.021. [DOI] [PMC free article] [PubMed] [Google Scholar]
- Felleman DJ, Van Essen DC. Distributed hierarchical processing in the primate cerebral cortex. Cereb Cortex. 1991;1:1–47. doi: 10.1093/cercor/1.1.1-a. [DOI] [PubMed] [Google Scholar]
- Fernandes MA, Pacurar A, Moscovitch M, Grady C. Neural correlates of auditory recognition under full and divided attention in younger and older adults. Neuropsychologia. 2006;44:2452–64. doi: 10.1016/j.neuropsychologia.2006.04.020. [DOI] [PubMed] [Google Scholar]
- Ferri R, Del Gracco S, Elia M, Musumeci SA, Spada R, Stefanini MC. Scalp topographic mapping of middle-latency somatosensory evoked potentials in normal aging and dementia. Neurophysiol Clin. 1996;26:311–9. doi: 10.1016/S0987-7053(97)85098-8. [DOI] [PubMed] [Google Scholar]
- Fries P, Reynolds JH, Rorie AE, Desimone R. Modulation of oscillatory neuronal synchronization by selective visual attention. Science. 2001;291:1560–3. doi: 10.1126/science.1055465. [DOI] [PubMed] [Google Scholar]
- Gescheider GA, Edwards RR, Lackner EA, Bolanowski SJ, Verrillo RT. The effects of aging on information-processing channels in the sense of touch: Iii. Differential sensitivity to changes in stimulus intensity. Somatosens Mot Res. 1996;13:73–80. doi: 10.3109/08990229609028914. [DOI] [PubMed] [Google Scholar]
- Grady CL, Maisog JM, Horwitz B, Ungerleider LG, Mentis MJ, Salerno JA, Pietrini P, Wagner E, Haxby JV. Age-related changes in cortical blood flow activation during visual processing of faces and location. J Neurosci. 1994;14:1450–62. doi: 10.1523/JNEUROSCI.14-03-01450.1994. [DOI] [PMC free article] [PubMed] [Google Scholar]
- Guillery RW, Sherman SM. Thalamic relay functions and their role in corticocortical communication: Generalizations from the visual system. Neuron. 2002;33:163–75. doi: 10.1016/s0896-6273(01)00582-7. [DOI] [PubMed] [Google Scholar]
- Hamalainen MS, Sarvas J. Realistic conductivity geometry model of the human head for interpretation of neuromagnetic data. IEEE Trans Biomed Eng. 1989;36:165–171. doi: 10.1109/10.16463. [DOI] [PubMed] [Google Scholar]
- Hanslmayr S, Aslan A, Staudigl T, Klimesch W, Herrmann CS, Bauml KH. Prestimulus oscillations predict visual perception performance between and within subjects. Neuroimage. 2007;37:1465–73. doi: 10.1016/j.neuroimage.2007.07.011. [DOI] [PubMed] [Google Scholar]
- Hari R. Action-perception connection and the cortical mu rhythm. Prog Brain Res. 2006;159:253–60. doi: 10.1016/S0079-6123(06)59017-X. [DOI] [PubMed] [Google Scholar]
- Hughes SW, Crunelli V. Thalamic mechanisms of EEG alpha rhythms and their pathological implications. Neuroscientist. 2005;11:357–72. doi: 10.1177/1073858405277450. [DOI] [PubMed] [Google Scholar]
- Jones EG. The thalamic matrix and thalamocortical synchrony. Trends Neurosci. 2001;24:595–601. doi: 10.1016/s0166-2236(00)01922-6. [DOI] [PubMed] [Google Scholar]
- Jones SR, Pritchett DL, Sikora MA, Stufflebeam SM, Hamalainen M, Moore CI. Quantitative analysis and biophysically realistic neural modeling of the MEG mu rhythm: Rhythmogenesis and modulation of sensory evoked responses. J Neurophysiol. 2009;102:3554–3572. doi: 10.1152/jn.00535.2009. [DOI] [PMC free article] [PubMed] [Google Scholar]
- Jones SR, Pritchett DL, Stufflebeam SM, Hamalainen M, Moore CI. Neural correlates of tactile detection: A combined magnetoencephalography and biophysically based computational modeling study. J Neurosci. 2007;27:10751–64. doi: 10.1523/JNEUROSCI.0482-07.2007. [DOI] [PMC free article] [PubMed] [Google Scholar]
- Kakigi R. The effect of aging on somatosensory evoked potentials following stimulation of the posterior tibial nerve in man. Electroencephalogr Clin Neurophysiol. 1987;68:277–86. doi: 10.1016/0168-5597(87)90048-7. [DOI] [PubMed] [Google Scholar]
- Kakigi R, Shibasaki H. Effects of age, gender, and stimulus side on scalp topography of somatosensory evoked potentials following median nerve stimulation. J Clin Neurophysiol. 1991;8:320–30. doi: 10.1097/00004691-199107010-00008. [DOI] [PubMed] [Google Scholar]
- Kolev V, Yordanova J, Basar-Eroglu C, Basar E. Age effects on visual EEG responses reveal distinct frontal alpha networks. Clin Neurophysiol. 2002;113:901–10. doi: 10.1016/s1388-2457(02)00106-2. [DOI] [PubMed] [Google Scholar]
- Kononen M, Partanen JV. Blocking of EEG alpha activity during visual performance in healthy adults. A quantitative study. Electroencephalogr Clin Neurophysiol. 1993;87:164–6. doi: 10.1016/0013-4694(93)90122-c. [DOI] [PubMed] [Google Scholar]
- Kuhlman WN. Functional topography of the human mu rhythm. Electroencephalogr Clin Neurophysiol. 1978;44:83–93. doi: 10.1016/0013-4694(78)90107-4. [DOI] [PubMed] [Google Scholar]
- Lachaux JP, Rodriguez E, Martinerie J, Varela FJ. Measuring phase synchrony in brain signals. Hum Brain Mapp. 1999;8:194–208. doi: 10.1002/(SICI)1097-0193(1999)8:4<194::AID-HBM4>3.0.CO;2-C. [DOI] [PMC free article] [PubMed] [Google Scholar]
- Linkenkaer-Hansen K, Nikulin VV, Palva S, Ilmoniemi RJ, Palva JM. Prestimulus oscillations enhance psychophysical performance in humans. J Neurosci. 2004;24:10186–90. doi: 10.1523/JNEUROSCI.2584-04.2004. [DOI] [PMC free article] [PubMed] [Google Scholar]
- Luders H. The effect of aging on the wave form of the somatosensory cortical evoked potential. Electroencephalogr Clin Neurophysiol. 1970;29:450–60. doi: 10.1016/0013-4694(70)90062-3. [DOI] [PubMed] [Google Scholar]
- Marciani MG, Maschio M, Spanedda F, Caltagirone C, Gigli GL, Bernardi G. Quantitative EEG evaluation in normal elderly subjects during mental processes: Age-related changes. Int J Neurosci. 1994;76:131–40. doi: 10.3109/00207459408985998. [DOI] [PubMed] [Google Scholar]
- Mazaheri A, Jensen O. Asymmetric amplitude modulations of brain oscillations generate slow evoked responses. J Neurosci. 2008;28:7781–7. doi: 10.1523/JNEUROSCI.1631-08.2008. [DOI] [PMC free article] [PubMed] [Google Scholar]
- Moore CI, Stern CE, Corkin S, Fischl B, Gray AC, Rosen BR, Dale AM. Segregation of somatosensory activation in the human rolandic cortex using fmri. J Neurophysiol. 2000;84:558–69. doi: 10.1152/jn.2000.84.1.558. [DOI] [PubMed] [Google Scholar]
- Murakami S, Hirose A, Okada YC. Contribution of ionic currents to magnetoencephalography (MEG) and electroencephalography (EEG) signals generated by guinea-pig ca3 slices. J Physiol. 2003;553:975–85. doi: 10.1113/jphysiol.2003.051144. [DOI] [PMC free article] [PubMed] [Google Scholar]
- Murakami S, Okada Y. Contributions of principal neocortical neurons to magnetoencephalography and electroencephalography signals. J Physiol. 2006;575:925–36. doi: 10.1113/jphysiol.2006.105379. [DOI] [PMC free article] [PubMed] [Google Scholar]
- Nikulin VV, Brismar T. Phase synchronization between alpha and beta oscillations in the human electroencephalogram. Neurosci. 2006;137:647–657. doi: 10.1016/j.neuroscience.2005.10.031. [DOI] [PubMed] [Google Scholar]
- Niedermeyer E. Alpha rhythms as physiological and abnormal phenomena. Int J Psychophysiol. 1997;26:31–49. doi: 10.1016/s0167-8760(97)00754-x. [DOI] [PubMed] [Google Scholar]
- Nikulin VV, Linkenkaer-Hansen K, Nolte G, Lemm S, Muller KR, Ilmoniemi RJ, Curio G. A novel mechanism for evoked responses in the human brain. Eur J Neurosci. 2007;25:3146–54. doi: 10.1111/j.1460-9568.2007.05553.x. [DOI] [PubMed] [Google Scholar]
- Nishitani N, Hari R. Temporal dynamics of cortical representation for action. Proc Natl Acad Sci U S A. 2000;97:913–8. doi: 10.1073/pnas.97.2.913. [DOI] [PMC free article] [PubMed] [Google Scholar]
- Ogata K, Okamoto T, Yamasaki T, Shigeto H, Tobimatsu S. Pre-movement gating of somatosensory-evoked potentials by self-initiated movements: The effects of ageing and its implication. Clin Neurophysiol. 2009;120:1143–8. doi: 10.1016/j.clinph.2009.01.020. [DOI] [PubMed] [Google Scholar]
- Okada YC, Wu J, Kyuhou S. Genesis of MEG signals in a mammalian cns structure. Electroencephalogr Clin Neurophysiol. 1997;103:474–85. doi: 10.1016/s0013-4694(97)00043-6. [DOI] [PubMed] [Google Scholar]
- Onozuka M, Fujita M, Watanabe K, Hirano Y, Niwa M, Nishiyama K, Saito S. Age-related changes in brain regional activity during chewing: A functional magnetic resonance imaging study. J Dent Res. 2003;82:657–60. doi: 10.1177/154405910308200817. [DOI] [PubMed] [Google Scholar]
- Palva S, Linkenkaer-Hansen K, Naatanen R, Palva JM. Early neural correlates of conscious somatosensory perception. J Neurosci. 2005;25:5248–58. doi: 10.1523/JNEUROSCI.0141-05.2005. [DOI] [PMC free article] [PubMed] [Google Scholar]
- Palva JM, Palva S, Kaila K. Phase synchrony among neuronal oscillations in the human cortex. J Neurosci. 2006;25:3962–3972. doi: 10.1523/JNEUROSCI.4250-04.2005. [DOI] [PMC free article] [PubMed] [Google Scholar]
- Penfield W, Rasmusson T. The Cerebral Cortex of Man: A Clinical Study of Localization and Function 1950 [Google Scholar]
- Poe BH, Linville C, Brunso-Bechtold J. Age-related decline of presumptive inhibitory synapses in the sensorimotor cortex as revealed by the physical disector. J Comp Neurol. 2001;439:65–72. doi: 10.1002/cne.1335. [DOI] [PubMed] [Google Scholar]
- Raz N, Rodrigue KM. Differential aging of the brain: Patterns, cognitive correlates and modifiers. Neurosci Biobehav Rev. 2006;30:730–48. doi: 10.1016/j.neubiorev.2006.07.001. [DOI] [PMC free article] [PubMed] [Google Scholar]
- Rossini PM, Rossi S, Babiloni C, Polich J. Clinical neurophysiology of aging brain: From normal aging to neurodegeneration. Prog Neurobiol. 2007;83:375–400. doi: 10.1016/j.pneurobio.2007.07.010. [DOI] [PubMed] [Google Scholar]
- Roubicek J. The electroencephalogram in the middle-aged and the elderly. J Am Geriatr Soc. 1977;25:145–52. doi: 10.1111/j.1532-5415.1977.tb00282.x. [DOI] [PubMed] [Google Scholar]
- Sailer A, Dichgans J, Gerloff C. The influence of normal aging on the cortical processing of a simple motor task. Neurology. 2000;55:979–85. doi: 10.1212/wnl.55.7.979. [DOI] [PubMed] [Google Scholar]
- Sarvas J. Basic mathematical and electromagnetic concepts of the biomagnetic inverse problem. Phys Med Biol. 1987;32:11–22. doi: 10.1088/0031-9155/32/1/004. [DOI] [PubMed] [Google Scholar]
- Sastre-Janer FA, Regis J, Belin P, Mangin JF, Dormont D, Masure MC, Remy P, Frouin V, Samson Y. Three-dimensional reconstruction of the human central sulcus reveals a morphological correlate of the hand area. Cereb Cortex. 1998;8:641–7. doi: 10.1093/cercor/8.7.641. [DOI] [PubMed] [Google Scholar]
- Satorre J, Cano J, Reinoso-Suarez F. Stability of the neuronal population of the dorsal lateral geniculate nucleus (lgnd) of aged rats. Brain Res. 1985;339:375–7. doi: 10.1016/0006-8993(85)90108-8. [DOI] [PubMed] [Google Scholar]
- Schneider BA, Pichora-Fuller MK. Implications of perceptual deterioration for cognitive aging research. In: Craik FI, Salthouse TA, editors. The handbook of aging and cognition. Mahwah, NJ: Lawrence Erlbaum Associates; 2000. pp. 155–219. [Google Scholar]
- Schubert R, Haufe S, Blankenburg F, Villringer A, Curio G. Now you'll feel it-now you won't: EEG rhythms predict the effectiveness of perceptual masking. J Cogn Neurosci. 2008 doi: 10.1162/jocn.2008.21174. [DOI] [PubMed] [Google Scholar]
- Simpson DM, Erwin CW. Evoked potential latency change with age suggests differential aging of primary somatosensory cortex. Neurobiol Aging. 1983;4:59–63. doi: 10.1016/0197-4580(83)90055-6. [DOI] [PubMed] [Google Scholar]
- Stephen JM, Ranken D, Best E, Adair J, Knoefel J, Kovacevic S, Padilla D, Hart B, Aine CJ. Aging changes and gender differences in response to median nerve stimulation measured with MEG. Clin Neurophysiol. 2006;117:131–43. doi: 10.1016/j.clinph.2005.09.003. [DOI] [PubMed] [Google Scholar]
- Sullivan EV, Rosenbloom M, Serventi KL, Pfefferbaum A. Effects of age and sex on volumes of the thalamus, pons, and cortex. Neurobiol Aging. 2004;25:185–92. doi: 10.1016/s0197-4580(03)00044-7. [DOI] [PubMed] [Google Scholar]
- Tesche CD, Uusitalo MA, Ilmoniemi RJ, Huotilainen M, Kajola M, Salonen O. Signal-space projections of MEG data characterize both distributed and well-localized neuronal sources. Electroencephalogr Clin Neurophysiol. 1995;95:189–200. doi: 10.1016/0013-4694(95)00064-6. [DOI] [PubMed] [Google Scholar]
- Uematsu S, Lesser RP, Gordon B. Localization of sensorimotor cortex: The influence of sherrington and cushing on the modern concept. Neurosurgery. 1992;30:904–12. doi: 10.1227/00006123-199206000-00015. discussion 912-3. [DOI] [PubMed] [Google Scholar]
- Uusitalo MA, Ilmoniemi RJ. Signal-space projection method for separating MEG or EEG into components. Med Biol Eng Comput. 1997;35:135–40. doi: 10.1007/BF02534144. [DOI] [PubMed] [Google Scholar]
- Verrillo RT. Effects of aging on the suprathreshold responses to vibration. Percept Psychophys. 1982;32:61–8. doi: 10.3758/bf03204869. [DOI] [PubMed] [Google Scholar]
- Verrillo RT, Bolanowski SJ, Gescheider GA. Effect of aging on the subjective magnitude of vibration. Somatosens Mot Res. 2002;19:238–44. doi: 10.1080/0899022021000009161. [DOI] [PubMed] [Google Scholar]
- Walhovd KB, Fjell AM, Reinvang I, Lundervold A, Dale AM, Eilertsen DE, Quinn BT, Salat D, Makris N, Fischl B. Effects of age on volumes of cortex, white matter and subcortical structures. Neurobiol Aging. 2005;26:1261–70. doi: 10.1016/j.neurobiolaging.2005.05.020. discussion 1275-8. [DOI] [PubMed] [Google Scholar]
- Walhovd KB, Westlye LT, Amlien I, Espeseth T, Reinvang I, Raz N, Agartz I, Salat DH, Greve DN, Fischl B, Dale AM, Fjell AM. Consistent neuroanatomical age-related volume differences across multiple samples. Neurobiol Aging. 2009 doi: 10.1016/j.neurobiolaging.2009.05.013. [DOI] [PMC free article] [PubMed] [Google Scholar]
- White LE, Andrews TJ, Hulette C, Richards A, Groelle M, Paydarfar J, Purves D. Structure of the human sensorimotor system. I: Morphology and cytoarchitecture of the central sulcus. Cereb Cortex. 1997;7:18–30. doi: 10.1093/cercor/7.1.18. [DOI] [PubMed] [Google Scholar]
- Yordanova JY, Kolev VN, Basar E. EEG theta and frontal alpha oscillations during auditory processing change with aging. Electroencephalogr Clin Neurophysiol. 1998;108:497–505. doi: 10.1016/s0168-5597(98)00028-8. [DOI] [PubMed] [Google Scholar]
- Yousry TA, Schmid UD, Alkadhi H, Schmidt D, Peraud A, Buettner A, Winkler P. Localization of the motor hand area to a knob on the precentral gyrus. A new landmark. Brain. 1997;120(Pt 1):141–57. doi: 10.1093/brain/120.1.141. [DOI] [PubMed] [Google Scholar]
- Zhang Y, Ding M. Detection of a weak somatosensory stimulus: Role of the prestimulus mu rhythm and its top-down modulation. J Cogn Neurosci. 2009 doi: 10.1162/jocn.2009.21247. [DOI] [PubMed] [Google Scholar]
- Ziegler DA, Piguet O, Salat DH, Prince K, Connally E, Corkin S. Cognition in healthy aging is related to regional white matter integrity, but not cortical thickness. Neurobiol Aging. 2008 doi: 10.1016/j.neurobiolaging.2008.10.015. [DOI] [PMC free article] [PubMed] [Google Scholar]
Associated Data
This section collects any data citations, data availability statements, or supplementary materials included in this article.
Supplementary Materials
A) Prestimulus TFRs averaged across the YA (top) and MA (bottom) groups. The unit of power is (Am)2. B) mean TFR ratios of prestimulus mu-alpha to mu-beta power in 100 ms time bins against age for the YA (red) and MA (blue).). The TFR ratio was > 1 for YA and < 1 for MA (p = 0.074). For each participant, ratios were averaged over all trials (n=200) and time (1 sec).
A. Local network synaptic connections between multiple compartment pyramidal neurons (PNs, green) and single compartment inhibitory neurons (INs, red). ‘Bold’ outlined dendrites were contacted. Within layer PN-to-PN synapses (not shown) were also present on dark green outlined dendrites. B. Excitatory feedforward input connections. The black arrow is schematic, because lemniscal thalamic input was not explicitly modeled. C. Excitatory feedback-input connections from presumed higher order cortical or non-specific thalamic neurons. The feedforward and feedback inputs were modeled as spike train generators with a predetermined temporal profile and synaptic strength. D. Schematic of the Network Architecture: The network activity of 100 multi-compartment pyramidal neurons (PNs) in layers II/III and V (green), interconnected with 35 inhibitory interneurons (INs) per layer (not shown), were simulated using the software NEURON. (reproduced as in Jones et al., in press with permission from J. Neurophys.)
Every ∼100ms (Gaussian, mean ISI 100ms, s.d.=20ms), 10 ‘bursts’ of input (doublet spike trains, ISI 10ms) excite the SI network in a FF connection pattern followed by an analogous delayed FB input. Red and blue arrows depict intracellular current flow. FF inputs induce current flow up the dendrites and FB inputs current flow down the dendrites. (reproduced as in Jones et al., in press with permission from J. Neurophys.)
For a fixed 5 ms delay between the rhythmic FF and FB input we manipulated the strength of the inputs via changes in the (A.) post-synaptic conductance, (B.) number of spike in the input burst on each cycle of the input, and (C.) variance of spikes in the input burst on each cycle of the input (see Supplimentary Figure 3). TFR plots (top), example waveforms (middle), and mean mu-alpha and mu-beta power calculated from the TFRs (bottom) are shown, for three values of each parameter. The left columns show the effect of increased FF relative to FB parameters, the middle column shows the effect of equal FF and FB parameters, and the right column shows the effect of lower FF compared to FB parameters. In all cases, when the FF input strength is effectively increased compared to the FB input strength, mu-alpha power is increased. In contrast, when the FB input strength is effectively increased compared to the FF input strength, mu-beta power is increased. Further, when the strength of the FF and FB inputs are equal, the mu-alpha and mu-beta are approximately equal.
With a fixed variance of the rhythmic FF inputs on each cycle of 400 ms, increasing the variance of the FB inputs (which increases relative mu-beta amplitude) resulted in a stepwise increase in the peak-to-trough amplitude of oscillations (left). In contrast, when the variance of the rhythmic FB input was fixed, increasing the FF variance (which increases mu-alpha amplitude) led to a decrease in the mean amplitude of oscillations.
We calculated10-20Hz phase-locking statistics (PLS) in our MEG and model SI data using methods as in Lachaux et al., 1999, where we first band passed the signal in the 7-29Hz mu range. A) The PLS was more significant in the YA than in the MA (mean PLS YA=0.04; mean PLS MA=0.08), but there was no significant difference between groups (p=0.39) nor was there B) a significant correlation between PLS and age (p = 0.30). C) The model data showed a similar trend of YA simulations having smaller PLS than MA but neither group reached significance likely due to the smaller sample size (n=25 trials) (model YA PLS =0.19; model MA PLS =.0.69). D) Phase locking statistics did not correlate significantly with symmetry indices (p = .87).