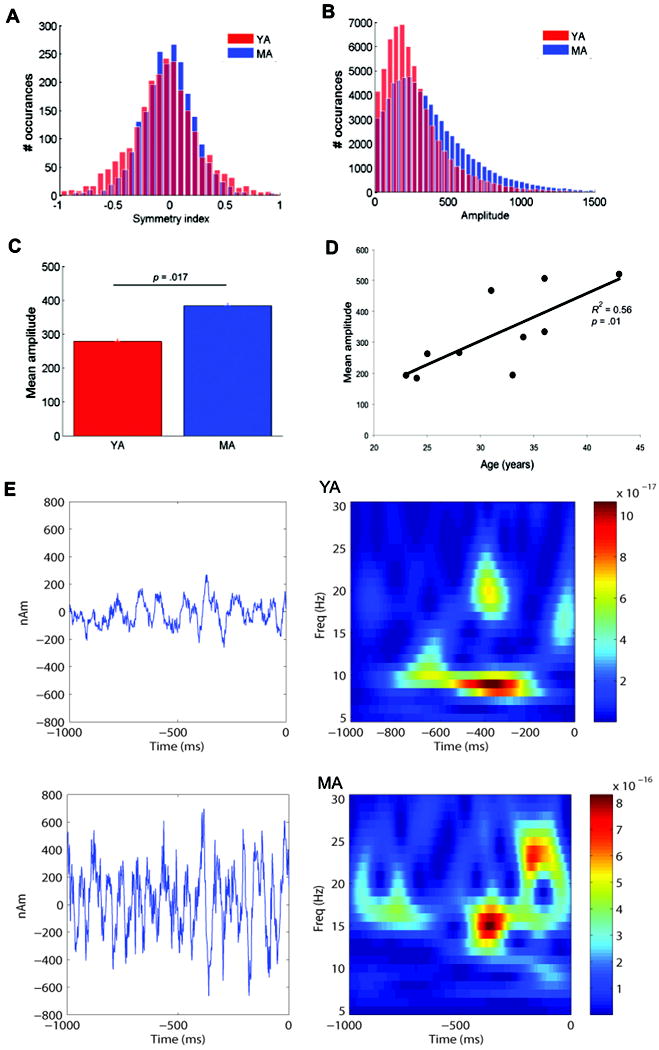
Figure 2. Symmetry and amplitude of prestimulus MEG oscillations.

A. Histogram of symmetry indices for the prestimulus (1000 ms) period over all trials for the YA (red) and MA (blue). B. Histogram of peak-to-trough amplitudes during the prestimulus period for the YA and MA. C. Mean prestimulus peak-to-trough amplitudes for each group (s.e. bars). Amplitudes were significantly greater for the MA (p = 0.017) D. Regression plot of mean amplitudes by age (p = 0.01). E. Example single-trial prestimulus waveforms (left) and corresponding TFR plots (right) for one YA and one MA showing the single trial variability and symmetry of the oscillation around zero in both groups with greater amplitude oscillations in the MA. The unit of power in the TFR is (Am)2.
