

Abstract
Molecular markers that distinguish specific layers of rodent neocortex are increasingly employed to study cortical development and the physiology of cortical circuits. The extent to which these markers represent general features of neocortical cell type identity across mammals is, however, unknown. To assess the conservation of layer markers more broadly, we isolated orthologs for fifteen layer-enriched genes in the ferret, a carnivore with a large, gyrencephalic brain, and analyzed their patterns of neocortical gene expression. Our major findings are: (1) Many but not all layer markers tested show similar patterns of layer-specific gene expression between mouse and ferret cortex, supporting the view that layer-specific cell type identity is conserved at a molecular level across mammalian superorders; (2) Our panel of deep layer markers (ER81/ETV1, SULF2, PCP4, FEZF2/ZNF312, CACNA1H, KCNN2/SK2, SYT6, FOXP2, CTGF) provides molecular evidence that the specific stratifications of layer 5 and 6 into 5a, 5b, 6a and 6b are also conserved between rodents and carnivores. (3) Variations in layer-specific gene expression are more pronounced across areas of ferret cortex than between homologous areas of mouse and ferret cortex; (4) This variation of area gene expression was clearest with the superficial layer markers studied (SERPINE2, MDGA1, CUX1, UNC5D, RORB/NR1F2, EAG2/KCNH5). Most dramatically, the layer 4 markers RORB and EAG2 disclosed a molecular sublamination to ferret visual cortex and demonstrated a molecular dissociation among the so-called agranular areas of the neocortex. Our findings establish molecular markers as a powerful complement to cytoarchitecture for neocortical layer and cell-type comparisons across mammals.
Keywords: Mouse, visual cortex, motor cortex, cingulate cortex, cytoarchitecture, corticospinal motor neuron, SERPINE2, MDGA1, UNC5D, CUX1, EAG2, RORB, ER81, PCP4, SULF2, FEZF2, CACNA1H, KCNN2, FOXP2, SYT6, CTGF
INTRODUCTION
The six-layered cerebral cortex, or neocortex, is a conserved feature of the dorsal telencephalon of all mammals, including the marsupials and monotremes (Northcutt and Kaas, 1995). That the neocortex is stratified is clear from almost any histological preparation, but the specific identification of six neocortical layers is a historical consensus. The Viennese anatomist Meynert (1872) was the first to describe cell-rich neocortical layers, and he recognized five layers in the human brain. Subsequently, the English neurologist Lewis (1880; 1882; 1878) suggested a division of the cortex into six layers based on the cytoarchitecture of pig, sheep, rat, rabbit and cat brains, and Ramon y Cajal (1899–1904) described between 7 – 9 layers in the human cortex, the number depending on the cortical area studied. In 1903 Brodmann adopted and popularized Lewis’ diagram and, through his advocacy, the concept of ‘six layers’ swept the field (Lorente de No, 1943).
The historical disagreement over the number of cortical layers highlights the challenges of using cytoarchitecture to identify neocortical layers and cell types. Lorente de No (1943) was particularly critical of cytoarchitectonics even for layer identification because of the publication of "most inconsistent descriptions" of cortical layers. "(T)he boundaries between layers, with the exception of the boundary between IVb and V, are never sharp, and … if they are ascertained with the help of only the architectonic picture are entirely hypothetical" (Lorente de No, 1943, pp 278–279). Cytoarchitecture is also problematic for cortical cell type identification. Cortical cytoarchitectonics is based on quantitative differences between populations of neurons, such as their packing densities and the relative local percentages of pyramidal neurons. It is not a method that studies specific properties of individual cells. Indeed, it is the population-based analysis of cytoarchitecture that made this method so adaptable to layer comparisons across cortical areas and species.
Cortical layering can be demonstrated with other methods, including single cell tract-tracing anatomy and single unit electrophysiology (Gilbert, 1977; Gilbert and Kelly, 1975; Gilbert and Wiesel, 1985; Jones and Wise, 1977; Lund et al., 1975; Symonds and Rosenquist, 1984). These studies have shown that layers serve to organize neocortical afferent connections, local circuitry, and output projections. One advantage of these studies is that they identify specific cell types at specific locations. Unlike cytoarchitectonics, however, experimental tract-tracing and electrophysiology do not allow study of layering patterns across the whole of the neocortex.
A critical recent advance in the study of cortical layering is the discovery in the rodent of molecular markers with apparent layer-specific expression patterns (Hevner et al., 2003; Leone et al., 2008; Molyneaux et al., 2007). These layer markers represent a wide variety of protein products, and have been gradually identified over the past decade from the work of a number of groups (Table 1). For example, interest in neocortical neuron development led to the characterization of the zinc finger transcription factor Fezf2 as a layer 5 marker (Arlotta et al., 2004; Chen et al., 2005; Inoue et al., 2004; Molyneaux et al., 2005). Interest in physiological properties of the neocortical neurons led to the discovery that the potassium channel Eag2/Kcnh5 is enriched in layer 4 neurons (Ludwig et al., 2000; Saganich et al., 1999). A paramount but largely unexplored consequence of molecular markers for layer-enriched cell types is that it allows for study of populations of defined cortical cell types, which can address long-standing questions involving neocortical structure. These questions include whether excitatory neuronal subtypes are organized into layers divided by sharp boundaries (Lorente de No, 1943), what the full extent of cell type heterogeneity is within the neocortex (Bannister, 2005; Hevner et al., 2003; Masland, 2004; Nelson et al., 2006), and how variable the organization of neocortical layers is across cortical areas and mammalian species. A widely accepted but also deeply controversial hypothesis is that the neocortex is a relatively uniform tissue (Herculano-Houzel et al., 2008; Hutsler et al., 2005; Rakic, 2008; Rockel et al., 1980; Rockland and Ichinohe, 2004; Skoglund et al., 1996). Gene expression studies of layer markers allow a new approach to testing the hypothesis of neocortical uniformity across mammals.
Table 1. Molecular markers for ferret neocortical expression analysis.
Candidate ferret layer markers were chosen based on gene expression patterns seen in rodent cerebral cortex.
| Gene | Encoding Protein Product | Expression in Rodent Cortex |
Rodent Cortex References |
|---|---|---|---|
| ELAVL3/HUC | Neuron-specific RNA binding protein |
Pan-neuronal | Okano and Darnell, 1997 |
| VGLUT1/SLC17A7 | Vesicular glutamate transporter | Excitatory neurons | Fremeau et al., 2001 |
| GAD65/GAD2 | GABA synthetic enzyme | Inhibitory neurons | Feldblum et al., 1993 |
| NEFM | Middle weight neurofilament | Pyramidal neurons |
Hoffman et al., 1987; Kirkcaldie et al., 2002 |
| UNC5D/SVET1 | Netrin receptor | Layers 2 – 4 | Tarabykin et al., 2001 |
| CUX1/CUTL1 | Homeodomain transcription factor | Layers 2 – 4 | Nieto et al., 2004 |
| EAG2/KCNH5 | Potassium channel | Layer 4 |
Ludwig et al., 2000; Saganich et al., 2001 |
| RORB/NR1F2 | Nuclear receptor transcription factor |
Layer 4 | Schaeren-Wiemers et al.,1997 |
| MDGA1 | MAM-domain, GPI anchored | Layer 4 | Takeuchi et al., 2007 |
| ER81/ETV1 | ETS transcription factor | Layer 5 | Hevner et al., 2003 |
| PCP4 | Small peptide of unknown function | Layer 5 | Bulfone et al., 2004 |
| SULF2 | Heparan sulfatase | Layer 5 | Nagamine et al., 2005 |
| FEZF2/ZNF312 | Zinc finger transcription factor | Layer 5 | Inoue et al., 2004 |
| KCNN2/SK2/KCa2.2 | Potassium channel | Layer 5 | Sailer et al., 2002 |
| CACNA1H/Cav3.2 | Calcium channel | Layer 5 | Talley et al., 1999 |
| SERPINE2 | Serpin peptidase inhibitor (nexin) | Layer 5 | Reinhard et al., 1994 |
| SYT6 | Synaptotagmin 6 | Layer 6 | Ullrich and Sudhof, 1995 |
| FOXP2 | Forkhead transcription factor | Layer 6 | Shu et al., 2001 |
| CTGF | Connective tissue growth factor | Layer 6b | Heuer et al., 2003 |
To date, layer markers have been characterized in rodent brains and, to a lesser extent, in primate brains including the macaque and human (Hevner, 2007; Watakabe et al., 2007). We chose the ferret brain for comparative analysis for several reasons. First, unlike the mouse or rat, the ferret has a large, gyrencephalic brain (Smart and McSherry, 1986). Second, ferrets have been widely employed to study the development and the functional organization of neocortical sensory areas, particularly visual cortex (Bizley et al., 2005; Callaway and Lieber, 1996; Crowley and Katz, 2000; Frantz and McConnell, 1996; Law et al., 1988; Manger et al., 2002; Pallas et al., 1990; Ware et al., 1999). Third, according to recent genomic and fossil data, primates and rodents are found in the same mammalian superorder (Euarchontoglires) with carnivores placed in a separate superorder (Laurasiatheria) (Fig. 1) (Goloboff et al., 2009; Lindblad-Toh, 2004; Lunter, 2007; Madsen et al., 2001; Murphy et al., 2001). As the ferret is more distantly related to rodents than to primates, the ferret is an excellent outgroup to test conservation of gene expression patterns across a wide subset of mammals. In particular, similarities between ferret and rodent will likely hold for humans as well.
Figure 1. Phylogeny of living mammals.

Layer marker gene expression patterns have previously been studied in rodents and primates (underlined), which are members of the superorder Euarchontoglires. The ferret and other carnivores (boxed) are members of the separate superorder, Laurasiatheria. Adapted from Lindblad-Toh, 2004.
Our results demonstrate both broad uniformity and substantial variation to the molecular cell type composition of the cortical layers across mammalian species and cortical areas. Primary sensory areas showed strikingly similar layer marker expression patterns between ferret and mouse. By contrast, across ferret cortical areas, we observed substantial variability in upper layer marker gene expression. These results indicate that the structure of the neocortical layers is more variable across cortical areas in the ferret than between homologous areas of ferret and mouse brain. We also provide evidence for molecular sublaminations to ferret layers 2/3, 5 and 6, and for layer 4 in ferret visual cortex. This study demonstrates the utility of molecular markers for neocortical layer and cell type characterization, and endorses molecular architectonics as a powerful addition to conventional cytoarchitectonics for neocortex research.
MATERIALS AND METHODS
Animals and Tissue
Adult male and female ferrets (Mustela putorius furo) were obtained from Marshall Farms (North Rose, NY). Ferrets were deeply anesthetized with sodium pentobarbital and perfused through the heart with 200 ml 0.1M phosphate-buffered saline (PBS, pH = 7.4) followed by 500 ml 4% paraformaldehyde in PBS (PFA). Adult female CD-1 mice were deeply anesthetized and perfused through the heart with 40 ml PFA. With both mice and ferrets, dissected brains were immersed in PFA overnight, and fixed tissue was cryogenically protected by equilibration in 30% sucrose/PFA for 48hrs. Coronal sections were cut at 32 µm on a sledge microtome. Sections were mounted on Superfrost Plus slides (Fisherbrand). Tissue was allowed to dry before processing for in situ hybridization. All animal procedures were reviewed and approved by the IACUC of the University of Chicago.
In situ hybridization (ISH)
PCR primers targeting ferret genes were designed with MacVector software based on dog genome sequence (Supplemental Table 1). Mouse cDNAs were published reagents obtained from colleagues, or were isolated by PCR based on deposited sequence (Supplemental Table 2). PCR fragments ranging in size from 350 – 1200 bp were subcloned in pCRII-TOPO vector (Invitrogen). Digoxigenin(DIG)-labeled riboprobes were synthesized from cDNA plasmids by in vitro transcription. Single-color ISH was carried out as previously described (Grove et al., 1998). Slides were incubated for 15 minutes in PFA, washed three times in PBS for 5 minutes, and incubated in proteinase K solution (1µg/ml of proteinase K in 100mM Tris-HCl, pH = 8.0; 50mM EDTA, pH = 8.0) for 1 hour (ferret tissue) or for 30 minutes (mouse tissue) at 37°C. Sections were post-fixed for 15 minutes in PFA, washed three times in PBS for 5 minutes, and prehybridized for 1 hour at 72°C in hybridization solution (200µg/ml heparin; 12.5mg/ml yeast RNA; 5 × SSC; 1% SDS; 50% formamide). Following prehybridization, 0.5 – 2µg of RNA probe was added to the hybridization solution and incubated overnight at 72°C. After hybridization, slides were washed three times in Solution × (2 × SSC; 1% SDS; 50% formamide) for 45 minutes at 72°C, rinsed three times in TBST (250mM Tris HCl, pH = 7.5; 1.36M NaCl; 26.8 mM KCl; 1% Tween 20) for 15 minutes at room temperature, and blocked in 10% lamb serum in TBST for one hour at 4°C. Riboprobe-mRNA duplexes were detected with Fab fragments coupled to alkaline phosphatase (Roche). The antibody was preabsorbed with chick embryo power/1% lamb serum and added to tissue at a 1:5000 dilution in TBST/1% lamb serum. The antibody reaction proceeded overnight at 4°C. The tissue was washed in TBST and then in NTMT (100mM Tris HCl, pH = 9.5; 100mM NaCl; 50mM MgCl2; 1% Tween 20). The riboprobe-mRNA duplexes were detected by phosphatase histochemistry employing BCIP and nitro blue tetrazolium (NBT). After 1 – 5 days incubation, slides were rinsed, postfixed and coverslipped with Eukitt mounting medium.
Two-color fluorescence ISH
Two-color fluorescence ISH (FISH) was carried with DIG-, fluoroscein (FL)-, or 2,4-dinitrophenol (DNP)- labeled ribroprobes. In all cases, probes were hybridized in a single reaction, but were detected sequentially. After high-stringency washes the tissue was blocked in TBST/B (20% DIG Blocking solution from Roche in TBST). Riboprobe-mRNA duplexes were incubated for 2 hours at room temperature with anti-DIG, anti-DNP or anti-FL horseradish peroxidase antibodies at a final concentration of 1:200 in TBST/B. These antibodies were not preabsorbed. After antibody reaction, slides were washed three times in TBST for 15 minutes, and then washed twice in TNT (0.1M Tris HCl, pH = 7.5; 0.15M NaCl; 0.05% Tween 20) for five minutes. Signal was demonstrated by incubation with FITC, Cy3 or Cy5 tyramide dyes (1:50 in 1× Plus Amplification Diluent, Perkin-Elmer) for one hour at room temperature. Slides were washed three times in TNT for 15 minutes at room temperature, washed two times in detergent mix (1% Nonidet P-40; 1% SDS; 0.5% Deoxycholate; 50mM Tris-HCl, pH = 7.5; 1mM EDTA, pH = 8.0; 150 mM NaCl) for 15 minutes at 72°C, washed for 30 minutes in Solution × at 72°C, and washed three times in TBST for 15 minutes at room temperature. The slides were blocked again in TBST/B before antibody application in the second color. After fluorescence processing, the slides were rinsed in PBS and coverslipped in ProLong Gold Antifade Reagent (Invitrogen).
Antibody Characterization
Please see Supplemental Table 3 for a list of the four commercial antibodies employed in this study. The antibodies bind digoxinenin, 2,4-dinitrophenyl and fluorescein, which are not endogenous to vetebrate tissue. To test for nonspecific binding of the antibodies to ferret and mouse brain sections, we performed control experiments in which the labeled RNA was omitted from the hybridization mix (Supplemental Figure 1). No signal was detected in the absence of the hapten-labeled riboprobe, demonstrating that the antibodies react specifically with the synthetic RNA.
Microscopy
Single color tetrazolium sections were studied on an Axioskop 40 Microscope (Zeiss). Fluorescent signals were imaged on a TIRF Live Cell Microscope (Olympus), a DSU Fixed Sample Spinning Disk Confocal Microscope (Olympus) or a SP5 2-Photon Confocal Microscope (Leica). Images were processed with Photoshop CS3 and ImageJ, where the hue, saturation, brightness, and contrast were altered as necessary. For documentation where the image did not fall within the field of view of the microscope, two images were captured and stitched together using Photoshop CS3 (see Figure Legends).
Technical considerations
Direct comparisons of NBT and fluorescence ISH results established that the NBT technique was uniformly more sensitive than the fluorescent techniques. For example, single color NBT data indicated that ferret PCP4 was expressed throughout layer 5, but PCP4 fluorescence signal could only be detected in the lower part of layer 5, where the PCP4 message was stronger (compare Fig. 5B to 6A′). We concluded that the FISH technique failed to detect sites of low expression. Accordingly, we did not calculate coexpression percentages for FISH pairwise comparisons because these numbers would be fundamentally misleading. Positive FISH coexpression data are, however, reliable and are reported in the Results.
Figure 5. ‘Layer 5’ molecular markers are expressed in layers 5 and 6 of the ferret neocortex.

A – F: Layer 5 marker expression patterns in adult ferret primary visual cortex (area 17). A: ER81 is expressed throughout layers 5 and 6. B, C: PCP4 (B) and SULF2 (C) ISH labels neurons in layer 5 and deep layer 6. D: FEZF2 is strongly expressed in deep layer 5 and weakly in upper layer 6. E, F: CACNA1H (E) and KCNN2 (F) are expressed particularly strongly in the lower part of layer 5 and in upper layer 6. Scale bars are 100µm.
Figure 6. Molecular markers demonstrate layer 5 sublamination in ferret motor cortex.
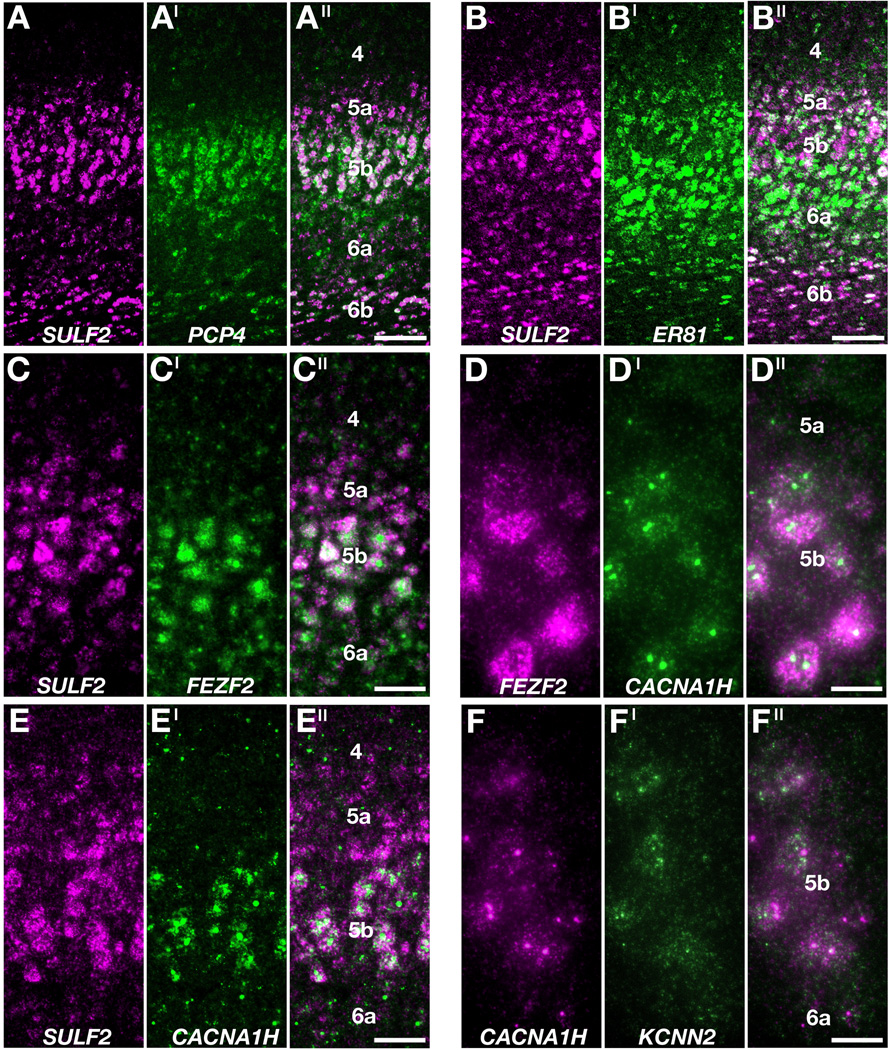
A – F′′: Two color coexpression profiles in adult ferret motor cortex (area 4). A – A′′: SULF2 (magenta in A, A′′) but not PCP4 (green in A′, A′′) message labels layer 5a, but these genes are extensively coexpressed in layer 5b and deep layer 6. B – B′′: Comparison of SULF2 (magenta in B, B′′) and ER81 (green in B′, B′′) mRNA distributions demonstrates that ER81 is expressed throughout layers 5 and 6. C – C′′: FEZF2 mRNA selectively labels neurons in layer 5b (green in C′, C′′), as demonstrated by comparison with SULF2 expression (magenta in C, C′′). D – D′′: FEZF2 (magenta in D, D′′) and CACNA1H (green in D′, D′′) coexpression in layer 5b. E – E′′: Comparison of SULF2 (magenta in E, E′′) and CACNA1H (green in E′, E′′) demonstrates that CACNA1H message is enriched in layer 5b. F – F′′: CACNA1H (magenta in F, F′′) and KCNN2 (green in F′, F′′) coexpression in layer 5b. The mRNA of both genes localize as puncta within cell bodies. Scale bars in A′′ (for A – A′′) and B′′ (for B – B′′) are 100µm, in C′′ (for C – C′′) and D′′ (for D – D′′) are 50µm, in E′′ (for E – E′′) and F′′ (for F – F′′) are 25µm.
RESULTS
Molecular markers of neocortical layers in mouse
The goal of this study is a comprehensive comparison of layer marker gene expression patterns across mammalian species. To this end we identified a panel of candidate layer markers to study in ferret neocortex based on gene expression patterns reported in rodent brains (Table 1). In addition we isolated a subset of these markers in the mouse to allow for direct comparison of message distributions using identical in situ hybridization (ISH) protocols. Figure 2 depicts our results for mouse visual cortex. As expected from published reports, we found that Cux1 and Unc5d were expressed in layers 2 – 4 (Fig. 2A,B), Eag2 and Rorb showed enhanced expression in layer 4 (Fig. 2C,D), Er81 message selectively labeled neurons in layer 5 (Fig. 2E), Pcp4 ISH labeling was pronounced throughout layers 5 and 6 (Fig. 2F), Fezf2 ISH showed heavy labeling in deep layer 5 and deep layer 6 (Fig. 2G), Cacna1h expression was concentrated in deep layer 5 (Fig. 2H), Sulf2 message was enriched in layer 5 and deep layer 6 (Fig. 2I), Foxp2 and Syt6 expression was pronounced in layer 6 (Fig. 2J,K), and Ctgf selectively identified neurons in deep layer 6 (Fig. 2L). These results indicate that layer marker expression in mice is remarkably specific for, but seldom restricted to, individual cortical layers. For example, with our methods the layer 4 markers Eag2 and Rorb identified many neurons in layer 5 (Fig. 2C,D), and the layer 6 marker Foxp2 labeled cells throughout the cell-rich layers (Fig. 2J). The expression patterns reported here for mouse are similar to those of the Allen Mouse Brain Atlas, a gene expression database (www.brain-map.org; Lein et al., 2007; Ng et al., 2009; Ng et al., 2010). A detailed comparison of our findings with Allen Brain Altas images can be found in Supplemental Table 4.
Figure 2. Layer marker gene expression in adult mouse visual cortex.

Gene expression patterns of upper layer markers Cux1 (A), Unc5d (B), Eag2 (C) and Rorb (D), and deep layer markers Er81 (E), Pcp4 (F), Fezf2 (G), Cacna1h (H), Sulf2 (I), Foxp2 (J), Syt6 (K) and Ctgf (L) are depicted. Scale bar is 100µm.
Molecular identification of neocortical layers in ferret
We isolated cDNAs for fifteen candidate layer markers in the ferret (Table 1). To identify cytoarchitectonic laminar patterns in ferret neocortex, we also isolated genes commonly employed as molecular markers for broad subsets of cortical neurons. This included ELAVL3, a pan-neuronal marker, VGLUT1, a marker of excitatory neurons, and NEFM, which is expressed strongly in medium to large neocortical pyramidal cells (see Table 1). We examined the expression patterns of these genes in sections of adult ferret tissue by single color ISH. We found that ELAVL3, VGLUT1 and NEFM identified neocortical layers with varying degrees of clarity (Fig. 3A – C). ELAVL3 expression (Fig. 3A) most closely resembled a Nissl stain, but proved less informative than VGLUT1 and NEFM for layer identification. As illustrated in Figure 3 for ferret visual cortex, VGLUT1 and NEFM ISH identified a layer 2/3 containing pyramidal cells which increased in size and packing density with cortex depth, a layer 4 marked by its dense packing of small non-pyramidal cells, a layer 5 consisting of the largest but least densely packed pyramidal cells, and a layer 6 that in comparison with layer 5 contained smaller and more densely packed cells (Fig. 3B,C). As expected, the GAD65-rich inhibitory neurons were scattered throughout the neocortical layers and white matter and showed little lamination (Fig. 3D, Feldblum et al., 1993; Gabbott and Somogyi, 1986). We conclude that among these four genes NEFM is the most informative molecular marker for identifying ferret neocortical layers based on cytoarchitecture.
Figure 3. Ferret neocortical layers can be identified with pan-neuronal genes and ‘rodent’ layer markers.

A – E: Expression patterns of ELAVL3 (A), VGLUT1 (B), NEFM (C, E) and GAD65 (D) in adult ferret visual cortex. Panels A – C illustrate serially adjoining sections. F – H: Two color expression profiles of candidate layer markers (green) and NEFM (magenta) in adult ferret visual cortex. F: RORB (green) is expressed in layer 4 (gap in NEFM expression between layers 2/3 and 5). G: ER81 (green) is expressed in layers 5 and 6 (the center of layer 5 contains the largest NEFM expressing cells, arrowhead). H: SYT6 (green) is expressed in layer 6 (small, densely packed NEFM expressing cells below layer 5). Panels F, G, and H are photomicrograph pairs stitched together with Photoshop CS3 software. Scale bars are 100µm.
We employed two-color fluorescence in situ hybridization (FISH) in adult ferret tissue to determine whether candidate ferret layer marker genes are expressed in the predicted cytoarchitectonically defined layers. We found that the candidate ferret layer 4 marker RORB was expressed in the laminar territory identified as layer 4 by a marked reduction in NEFM expression (Fig. 3F). Similarly, candidate ferret layer 5 marker ER81 and layer 6 marker SYT6 were expressed in layers 5 and 6 of the ferret cortex as defined by NEFM cytoarchitecture (Fig. 3G,H). These data establish that ferret orthologs of key mouse layer marker genes are enriched in the corresponding layers of the ferret neocortex.
Layer 4 of ferret visual cortex is stratified
We isolated two candidate layer 4 markers, RORB and EAG2, and found both genes to be expressed in layer 4 of ferret neocortex across many regions of cortex (Fig. 4). These included primary motor cortex, an area that is classically described as agranular and where the identification of a layer 4 by cytoarchitecture is challenging (Fig. 4D–F). Throughout much of ferret neocortex, the expression of RORB and EAG2 was dense in layer 4 but extended into layers 2/3 and 5 (Fig. 4A – F). Unexpectedly, we found EAG2 expressed in upper layer 6 (Fig. 4C,D,F). The cat receives substantial dorsal thalamic input to layer 4 and upper layer 6 (Ferster and LeVay, 1978; LeVay and Gilbert, 1976), raising the possibility that in ferret EAG2 identifies thalamorecipient cells more broadly.
Figure 4. Layer 4 marker gene expression patterns in ferret and mouse neocortex.

A – C: Expression patterns of RORB and EAG2 in ferret primary visual cortex (area 17). RORB ISH labels layer 4 (A, B), whereas EAG2 mRNA identifies layers 4 and 6 (C). D – F: Expression patterns of RORB and EAG2 in ferret motor cortex (area 4). Similar to visual cortex, RORB mRNA is enriched in layer 4 (E), while EAG2 is expressed in layers 4 and 6 (D, F). The width of EAG2+ layer 6 is expanded at the top of the coronal gyrus (F), reflecting the changes in the relative thickness of layers across smooth, gyral, and sulcal cortices (Brodmann, 1909; Smart and McSherry, 1986). G – G′′: Two color expression profile of RORB (magenta in G, G′′) and EAG2 (green in G′, G′′) in ferret visual cortex. H – H′′: Two-color expression profile of Rorb (magenta in H, H′′) and Eag2 (green in H′, H′′) in mouse visual cortex. Sublamination of layer 4 is evident in ferret (G′′) but not mouse (H′′) visual cortex. Panel D constructed from two images by Photoshop CS3. In panels A and D the scale bar is 1mm; in all other panels scales bar are 100µm. cru, cruciate sulcus; cor, coronal sulcus; 17, visual cortex; 4, motor cortex; 3, somatosensory cortex.
Single-color ISH suggested that EAG2 and RORB expression patterns were not coextensive in ferret primary visual cortex (Fig. 4B,C). RORB-rich neurons were more densely packed than EAG2-rich neurons, and EAG2 expression was shifted superficially relative to RORB expression (Fig. 4B,C). We confirmed in two-color FISH experiments with EAG2 and RORB that there is a layer 4 sublamination of ferret visual cortex with a RORB+/EAG2+ center, and a deep layer 4 that is RORB-rich and nearly free of EAG2-positive cells (Fig. 4G – G′′, Supplemental Figure 2A – C). We found that the intensity of EAG2 fluorescence peaks in upper layer 4, and gradually drops off in layer 2/3 above and in layer 4 below. By contrast, RORB fluorescence intensity in layer 4 increases with depth, peaks at the bottom of layer 4, but drops off rapidly beyond the layer 4 – 5 boundary (Supplemental Figure 2D). Thus, with our methods, EAG2 and RORB mRNA appeared to be present in opposing gradients in layer 4 of ferret primary visual cortex.
In mouse visual cortex, no similar sublamination was evident (Fig. 4H – H′′, Supplemental Figure 2M – P), suggesting that the layer 4 sublamination in visual cortex is a species-specific trait. Layer 4 sublamination was detected but was less pronounced in ferret primary somatosensory cortex (Supplemental Figure 2E – H), and was not seen in ferret motor cortex (Supplemental Figure 2I – L). These molecular findings raise the possibility that there may be a functional subdivision to layer 4 of ferret primary visual cortex.
‘Layer 5’ molecular markers are expressed in layers 5 and 6 of ferret cortex
Many layer 5 markers have been reported in the mouse. We isolated six of these layer 5 markers in the ferret: ER81, PCP4, SULF2, FEZF2, CACNA1H and KCNN2. Single color ISH demonstrated heterogeneous expression patterns of these markers in both layer 5 and layer 6 of ferret neocortex (Fig. 5). ER81, PCP4, and SULF2 were expressed broadly within layer 5, and consistently identified a clear boundary between layers 4 and 5 (Fig. 5A – C). ER81 was expressed throughout layers 5 and 6 (Fig. 3G, Fig. 5A), and SULF2 and PCP4 ISH labeled layer 5 and deep layer 6, with only weak expression in upper layer 6 (Fig. 5B, C).
In a variety of mammalian species layer 5 has been divided into two sublamina, 5a and 5b, based on cytoarchitectonics and connectivity (Lund et al., 1979; Lund et al., 1975). In ferret a similar cytoarchitectonic sublamination to layer 5 was evident, with deep layer 5 (5b) containing markedly larger pyramidal neurons than upper layer 5 (5a) (Fig. 3G, arrowhead). Layers 5a and 5b differed molecularly, with FEZF2, CACNA1H and KCNN2 demonstrating strong expression in large pyramidal neurons in layer 5b (Fig. 5D – F). Expression of these genes was not restricted to layer 5b. FEZF2 was also expressed weakly in layer 5a and upper layer 6 (Fig. 5D), CACNA1H message was demonstrated in upper layer 6 and layers 2/3 (Fig. 5E), and KCNN2 ISH identified upper layer 6 (Fig. 5F). In mouse FEZF2, CACNA1H, and KCNN2 were also expressed strongly in deep layer 5 (Figure 2G,H and Supplemental Figure 3), indicating a shared molecular sublamination to layer 5 between mouse and ferret.
Layer 5 sublamination studied in motor cortex
We explored the molecular architecture of layer 5 in motor cortex with two-color FISH. For these experiments SULF2 gene expression proved to be particularly valuable because it identified all of layer 5 and, by its reduced expression in upper layer 6, it clearly demarcated the boundary between layers 5 and 6 (Fig. 5C, 6). We found PCP4 and SULF2 to be extensively coexpressed in layer 5b and deep layer 6 (Fig. 6A – A′′). While SULF2 expression levels were strong throughout layer 5, we found that PCP4 expression in layer 5a was undetectable using the less sensitive FISH technique (Fig. 6A ′, A′′), molecularly distinguishing a layer 5a and layer 5b. Two-color FISH with ER81 and SULF2 demonstrated that ER81 is expressed weakly in layer 5a, but strongly labels large cells in deep layer 5 and upper layer 6 (Fig. 6B – B′′).
We tested the extent of FEZF2, CACNA1H, and KCNN2 mRNA coexpression in layer 5b of ferret motor cortex with two-color FISH. FEZF2 and CACNA1H colocalized with SULF2 in large, pyramidal-shaped neurons in layer 5b (Fig. 6C – C′′, E – E′′). Pairwise comparisons not involving SULF2 directly demonstrated extensive coexpression of FEZF2 and CACNA1H (Fig. 6D – D′′) and of CACNA1H and KCNN2 (Fig. 6F – F′′) in layer 5b. This suggests that layer 5b features a neuronal subtype characterized by combined FEZF2/CACNA1H/KCNN2 expression. Interestingly, CACNA1H and KCNN2 were expressed in non-overlapping punctate patterns, suggesting that the mRNAs of these ion channel genes are localized to distinct subcellular compartments (Fig. 6F′′).
Molecular identification of layers 6a and 6b
Two candidate layer 6 markers showed strong patterned expression in the adult ferret neocortex. Single color ISH demonstrated that SYT6 was expressed in layer 6 and scattered layer 5 neurons throughout the cortex, including primary visual and motor areas (Fig. 7A,C). FOXP2 expression in primary visual cortex was enriched in layer 6 with conspicuous expression throughout the cell-rich layers (Fig. 7B), whereas in motor cortex FOXP2 was expressed more evenly with very little layer 6 selectivity (Fig. 7D). These results establish SYT6 as a more specific layer 6 marker than FOXP2 in ferret.
Figure 7. Molecular identification of a layer 6a and layer 6b in ferret cortex.

A – D: Expression of SYT6 (A,C) and FOXP2 (B,D) in adult ferret visual cortex (A,B) and motor cortex (C,D). A, C: SYT6 ISH selectively identifies cells in layer 6 across cortical areas. B, D: FOXP2 expression is enhanced in layer 6 of visual cortex (B), but layer 6 selectivity is almost absent from motor cortex (D). E – L′′: Two color gene expression profiles in ferret visual cortex (area 17). E – F′′: Layer 6a is characterized by strong SYT6 (green in E′, E′′) and EAG2 (green in F′, F′′) gene expression, whereas neurons in layer 6b are enriched with SULF2 mRNA (magenta in E, E′′, F, F′′). G: Comparing EAG2 (green in G′, G′′) and SYT6 (magenta in G, G′′) expression demonstrates that EAG2 message is enriched in the upper part of layer 6a, although scattered EAG2+ neurons are located throughout layer 6a. H: SYT6 (green) and GAD65 (magenta) gene expression in layer 6a (Box I) and in the white matter (Box J). I – I′′: Higher magnification of tissue in Box I. SYT6 (green in I, I′′) and GAD65 (magenta in I′, I′′) are not coexpressed in layer 6a. J – J ′′: Higher magnification of Box J. Neurons enriched in SYT6 mRNA (green in J, J′′; arrowhead) in the white matter coexpress GAD65 (magenta in J′, J′′; arrowhead). K – L′′: PCP4- (green in K′, K′′) and SULF2- (green in L′, L′′) enriched neurons in layer 6b express the glutamatergic marker VGLUT1 (magenta in panels K, K′′, L, L′′). Scale bars are 100µm. WM, white matter.
Two-color FISH experiments demonstrated a molecular sublamination to layer 6, with EAG2 and SYT6 mRNA expressed in layer 6a, and SULF2 and PCP4 message enriched in layer 6b (Fig. 7E – G′′). This dissociation was not absolute, as we saw scattered SYT6+ neurons in layer 6b, and weakly expressing SULF2+ neurons in layer 6a (Fig. 7E – E′′). Two-color FISH experiments demonstrated that SYT6 and EAG2 mRNA were broadly coexpressed within layer 6a (Fig. 7G – G′′), and that SULF2 and PCP4 were broadly coexpressed within layer 6b (Fig. 6A – A′′).
In the cat a laminar subdivision of layer 6 has been identified based on cell morphology (Peters and Yilmaz, 1993). We found that our molecular results correlate with a similar cytoarchitectonic sublamination in ferret, as SYT6 and EAG2-rich neurons in layer 6a were often pyramidal in shape, while SULF2-rich neurons in layer 6b were typically fusiform in shape. We confirmed that the fusiform neurons were excitatory by demonstrating coexpression of VGLUT1 with both SULF2 and PCP4 in layer 6b (Figure 7K– L′′).
There is a similar subdivision of layer 6 in the mouse neocortex, with the expression of Syt6 in the pyramidal neurons of layer 6a and Ctfg and Sulf2 in the fusiform neurons of layer 6b (Fig. I, K, L and Supplemental Figure 4), often called the subplate (Allendoerfer and Shatz, 1994). In ferret we found that CTGF was not expressed strongly or selectively in layer 6b, but was found in scattered cells throughout the neocortical layers with modest layer 6 selectivity (Supplemental Figure 5). In addition, Eag2 was only weakly expressed in the upper part of layer 6 in the mouse neocortex (Supplemental Table 4), not strongly as in ferret. These results indicate that there is a conserved subdivision of layer 6 across ferret and mouse, with important differences in their molecular characteristics.
In ferret, SYT6 was expressed densely in layer 6a, in scattered cells in layer 6b and in cells in the underlying white matter (Fig. 7H – J′′). Very few VGLUT1+ neurons were detected in the white matter with the sensitive NBT ISH protocol (Supplemental Figure 6A), which suggested that the deep SYT6+ cells might be inhibitory neurons. To test this possibility directly we performed two color FISH for SYT6 with GAD65 (Fig. 7H – J′′) and VGLUT1 (Supplemental Figure 6B – B′′). In layer 6a, SYT6+ neurons expressed VGLUT1 mRNA and not GAD65 message (Fig. 7I – I′′ and Supplemental Figure 6B – B′′). Deep white matter SYT6+ cells, by contrast, were GAD65-rich (Fig. 7J – J′′). These results establish that cortical SYT6-rich neurons are a heterogeneous population, and include excitatory neurons within layer 6a and inhibitory neurons in the cortical white matter (Higo et al., 2007; Rockland, 1985).
Expression of superficial layer markers is particularly selective for layers 2/3 in sensory cortex
We isolated four genes that labeled neurons in layers 2/3 in ferret: CUX1, UNC5D, SERPINE2, and MDGA1 (Fig. 8). We found that UNC5D and CUX1 showed substantial variability in their expression patterns across ferret neocortical areas. In visual cortex, CUX1 was expressed throughout layers 2 – 4 (Fig. 8E), and UNC5D expression was strongest in layer 2/3 (Fig. 8D). This selectivity for upper layer gene expression, also present in somatosensory cortex (Fig. 8I,J), was greatly reduced in ferret motor cortex (Fig. 8N,O) and in other, non-sensory cortical areas (Fig. 9D). These results establish that there is a concentration in ferret sensory areas of upper layer cells that strongly express CUX1 and UNC5D.
Figure 8. Upper layer marker gene expression patterns across ferret cortical areas.

A – O: Expression of upper layer markers in primary visual (A – E), somatosensory (F – J), and motor (K – O) cortex. A, F, K: Low-power images of tissue probed for NEFM in visual (A) and somatomotor (F, K) areas. Boxes indicate the territory from which high-power images were taken. B, G, L: SERPINE2 mRNA is dense in the superficial part of layer 2/3, with extensive expression in scattered cells throughout the cortical layers. C, H, M: MDGA1 is expressed in the superficial part of layer 2/3, and is also enriched in layer 6, particularly in motor cortex (M). D, I, N: UNC5D is expressed strongly in the upper layers of visual (D) and somatosensory (I) cortex but not motor cortex (N). E, J O: CUX1 mRNA is enriched in the upper layers of visual (E) and somatosensory (J) cortex, but not motor (O) cortex. Scale bars in A, F, K are 1mm, and in all other panels are 100µm. cru, cruciate sulcus; cor, coronal sulcus;17, visual cortex; 4, motor cortex; 3, somatosensory cortex.
Figure 9. Ferret layer marker gene expression in the medial limbic cortex.

A– E: Expression patterns in the anterior limbic cortex. A: EAG2-labeled tissue at low-power magnification, with the boxed area indicating the region photographed in panels B – E. B – E: In the agranular anterior limbic area EAG2 expression in layer 4 is dramatically reduced (B) whereas RORB message enrichment in layer 4 is maintained (C). CUX1 mRNA does not show enrichment in layers 2 – 4 (D), and ER81 ISH labels layers 5 and 6 (E). F – J: Expression patterns in the posterior limbic cortex. F: EAG2 expression with the box identifying the territory photographed in panels G – J. G – J: Arrowhead marks the transition between the posterior cingulate cortex (above arrowhead) and the retrosplenial cortex (below arrowhead). With the transition from posterior cingulate to retrosplenial cortex, EAG2 expression in layer 4 splits into two bands (G), layer 4 RORB expression is lost (H), CUX1 expression in the upper layers dramatically increases in density and intensity (I), but ER81 mRNA maintains its expression pattern in layers 5 and 6. Scale bars are 1mm (A,F), or 100µm (B – E, G – J). cc, corpus callosum; cru, cruciate sulcus; cor, coronal sulcus; la, lateral sulcus; sp, splenial sulcus; WM, white matter.
We isolated MDGA1 and SERPINE2 cDNA fragments because these genes were reported in mouse to identify layer 4 (Mdga1) and layer 5 (Serpine2) of sensory cortex (Reinhard et al., 1994; Takeuchi et al., 2007). In ferret primary sensory areas, we found that MDGA1 and SERPINE2 showed enhanced expression in a band of cells just underneath the molecular layer (Fig. 8). We saw very few MDGA1+ neurons in layer 4 of ferret primary visual cortex (Fig. 8C) or somatosensory cortex (Fig. 8H), but we did observe low-level expression of MDGA1 in layer 6 (Fig. 8C,H,M). SERPINE2 was expressed in scattered cells throughout the neocortex, with only modest enrichment in layer 5 of somatomotor cortex (Fig. 8B,G,L). Thus, the most pronounced gene expression pattern for these markers in ferret neocortex was strong expression in upper layer 2/3, which potentially distinguishes a layer 2 from 3. This point deserves further investigation as additional layer 2/3 markers are identified (Molyneaux et al., 2009).
Expression patterns of upper layer markers in medial limbic neocortex
Carnivore neocortex has extensive non-sensory and motor districts that are well characterized by cytoarchitectonics and tract-tracing anatomy. We examined layer marker gene expression patterns in one such district, the medial limbic cortex. In the cat, this region is broadly subdivided into the anterior and posterior limbic areas (Brodmann, 1909; Krettek and Price, 1977; Rose and Woolsey, 1948). The anterior limbic area is agranular, whereas the posterior limbic area contains the granular posterior cingulate cortex, and the agranular and granular restrosplenial areas. We found that the expression patterns of three superficial layer markers, EAG2, RORB, and CUX1, readily distinguished these areas of medial limbic cortex.
In the agranular anterior limbic area, EAG2 expression in layer 6 was maintained, but that in layer 4 was dramatically reduced (Fig. 9A,B). By contrast, layer 4 RORB expression was robust (Fig. 9C). These results indicate a layer 4 can be identified with the molecular marker RORB in anterior limbic cortex, but that the reduction of granularity here is accompanied a loss of layer 4 EAG2 expression.
In the posterior limbic cortex, gene expression identified a clear boundary between the posterior cingulate and agranular retrosplenial areas. In layer 4 of the granular posterior cingulate area EAG2 and RORB expression was strong. With the transition into the ventrally adjoining agranular retrosplenial area, EAG2 expression in layer 4 split into two separate bands (Fig. 9G), RORB expression was dramatically reduced (Fig. H), and CUX1 expression in superficial layers increased in density but decreased in thickness (Fig. 9I). Finally, in all medial limbic areas examined, including the anterior limbic cortex, deep layer marker expression patterns appeared unchanged in comparison to the patterns seen in sensory and motor areas (Fig. 9E,J).
DISCUSSION
Our results on the molecularly defined cell type composition of neocortical layers in the adult ferret and mouse visual cortex are summarized in Figure 10. As a general finding, gene expression patterns proved to be broadly conserved between rodents and carnivores, supporting evolutionary constancy in the cell type composition of the neocortical layers. In detailed examination, however, we identified substantial expression pattern variability across species and cortical areas. Across mammalian species we observed variation particularly within layer 6, and across ferret cortical areas we observed differences in expression patterns of upper layer markers. Our results provide molecular evidence that cortical layers 2/3, 4, 5 and 6 contain heterogeneous populations of molecularly defined neuronal subtypes that often segregate into sublayers, and that the molecular composition of these sublayers is largely conserved across mammalian superorders. Here we discuss the potential connectional and functional implications of these molecular and anatomical results.
Figure 10. Comparison of ferret and mouse layer marker gene expression profiles for visual cortex.

Upper (2 – 4) layer markers are indicated in green, and deep (5,6) layer markers are indicated in magenta. Gene expression patterns in mouse and ferret neocortex are strikingly similar. Note the consistently sharp gene expression boundary between layers 4 and 5 in both species.
Molecular markers identify sublaminations in the cell-rich layers
Carnivores have a relatively complex and well-studied visual system, and layer 4 of cat visual cortex is divided into two sublamina based on cytoarchitectonic and connectivity studies. Layer 4a contains larger, more widely separated neurons that receive substantial input from Y-cells of the lateral geniculate nucleus, and layer 4b contains smaller, densely packed neurons that are targeted by X-cells (Humphrey et al., 1985; Lund et al., 1979; O'Leary, 1941). One attractive possibility is that the molecular sublamination of layer 4 in ferret visual cortex (Fig. 4) correlates with neurons differentially receiving X and Y inputs. If so, we predict a similar gene expression pattern to be present in the cat. An even more complex pattern might be present in primate visual cortex, where layer 4 can be subdivided into four sublamina, each with specific cytoarchitectonics and connectivity (Lund, 1988). Rodents are thought to have a less complex visual cortex and, in accord with this view, we were unable to detect a molecular sublamination to layer 4 in mouse visual cortex (Fig. 4).
Stratification of layer 5 has long been recognized by cytoarchitectonics and connectivity (Jones and Wise, 1977; Larkman and Mason, 1990; Lorente de No, 1943; Lund et al., 1979; Molnar and Cheung, 2006; O'Leary, 1941; Ramon y Cajal, 1899–1904; Thomson and Bannister, 2003). Lorente de No subdivided layer 5 into layers 5a, 5b, and 5c, with layer 5b containing the largest pyramidal neurons (Lorente de No, 1943). Modern authors typically only recognize a layer 5a and 5b, but some place the layer 5a – layer 5b boundary above the large pyramidal cells (Jones and Wise, 1977; Lund et al., 1979), while others place it below these cells (Larkman and Mason, 1990; Molnar and Cheung, 2006; Thomson and Bannister, 2003). Our molecular data securely identify a molecular layer 5 sublamination where layer 5b consists of the lower two-thirds of layer 5 and includes the large pyramidal cells (Fig. 5,6,10).
In carnivores, primates and rodents large pyramidal neurons near the top of layer 5b project subcortically to the brainstem and spinal cord (Gilbert and Kelly, 1975; Jones and Wise, 1977; Lund et al., 1979; Wise and Jones, 1977). In the mouse, it has been shown that the zinc-finger transcription factor Fezf2 is expressed in these neurons, and genetic studies have demonstrated that Fezf2 is involved in their development (Arlotta et al., 2004; Chen et al., 2005; Kwan et al., 2008; Molyneaux et al., 2005). We found that FEZF2/Fezf2, as well as two ion channel genes, CACNA1H/Cacna1h and KCNN2/Kcnn2, identify layer 5b in ferret and mouse, indicating a conserved molecular sublamination to mammalian layer 5. Our results suggest that FEZF2 and the two ion channel genes identify subcortically projecting neurons: the FEZF2/CACNA1H/KCNN2-positive neurons were particularly enriched in layer 5b of motor cortex, and many of these neurons had remarkably large cell bodies. These results suggest that molecular markers of key projection cell types, including corticospinal and corticotectal neurons, are conserved across mammals.
In mouse and ferret we observed a similar, but not identical, molecular sublamination to layer 6 (Fig. 7). This conserved molecular sublamination correlates with an established cytoarchitectonic subdivision of layer 6 into layer 6a and 6b (O'Leary, 1941; Peters and Yilmaz, 1993). Studies in primates and rodents suggest that upper and lower layer 6 differ in their efferent projections (Friedlander and Torres-Reveron, 2009; Gilbert and Kelly, 1975; Killackey and Sherman, 2003; LeVay and Sherk, 1981; Lund et al., 1975; Zhang and Deschenes, 1997). One specific possibility worth exploring in combination ISH and tracing experiments is that layers 6a and 6b target distinct thalamic nuclei (Killackey and Sherman, 2003; Zhang and Deschenes, 1997). In ferret and mouse there may be additional molecularly defined stratifications to layer 6 (see Fig. 10). For example, EAG2 gene expression in ferret shows a gradient in layer 6a, potentially distinguishing an upper and lower layer 6a. It is possible that some of the connectional studies cited above reflect an upper and lower layer 6a subdivision, while others may follow the layer 6a/6b sublamination.
A cytoarchitectonic boundary between layer 2 and layer 3 has proved problematic for many authors (Bureau et al., 2006; Lorente de No, 1943; Lund, 1973; O'Leary, 1941). In cat, the size and packing density of pyramidal neurons increases in a graded manner within layers 2 and 3 (O'Leary, 1941). In ferret, we found that SERPINE2 and MDGA1 gene expression identified neurons at the top of layer 2/3, establishing that molecularly defined neuronal subtypes differentially populate these layers, and that these subtypes are organized into sublamina. In mouse barrel cortex, layer 2 has been distinguished from layer 3 as receiving paralemniscal input from the thalamus (Bureau et al., 2006), and our molecular subdivision of layer 2/3 may correlate with a similar connectional sublamination in the ferret.
Layer 4 markers and agranular cortical areas
Von Economo (1929) distinguished five fundamental types of neocortex according to the relative prominence of pyramidal cells and non-pyramidal “granular” cells within the cortical layers. In this scheme, agranular (type 1) cortex was identified in several territories, including motor, anterior cingulate and retrosplenial cortex (Rose and Woolsey, 1948). We found with the layer 4 markers EAG2 and RORB clear molecular variability across these agranular areas (Fig. 4, 9), indicating that the molecular character of layer 4 is variable across classic agranular areas, although in a manner not predicted in previous classification schemes. Importantly, however, all the agranular areas examined expressed at least one layer 4 molecular marker. This observation suggests that agranular cortices have a functional layer 4, but that processing within layer 4 may be fundamentally different among motor cortex and the agranular medial limbic cortices.
Agranular motor cortex expressed both layer 4 markers EAG2 and RORB. A transient cytoarchitectonic layer 4 has been identified early in development in the primary motor cortex of human and macaque monkey brains (Amunts et al., 1995; Brodmann, 1909; Huntley and Jones, 1991; Marin-Padilla, 1970). Our gene expression evidence in primary ferret motor cortex indicates the persistence of layer 4 cell types defined molecularly in the adult brain. It is likely that the EAG2+/RORB+ cells we observed in the motor cortex represent the target of input from the VL nucleus of the thalamus, as described in primate, carnivore and rodent brains (Kuramoto et al., 2009; Sloper and Powell, 1979; Strick and Sterling, 1974).
Conclusions
Our results establish molecular markers as a powerful complement to cytoarchitectonics and connection studies for layer and neuronal cell type definition. In the ferret cortex, we identified molecular markers for the cell-rich layers, and also identified molecular sublaminations to layers 2/3, 4, 5 and 6. In addition, we found that in both species the only consistently sharp boundary in gene expression within the cell-rich layers was between layers 4 and 5, confirming a prediction of Lorente de No (1943). This supports the notion that the cell-rich layers can be divided broadly into two major territories: the upper layers 2 – 4, and the deep layers 5 and 6. Upper layer marker expression varied more across cortical areas within species than in homologous areas between species. By contrast, deep layer gene expression remained constant across ferret cortical areas, but in layer 6 varied substantially across species. Despite this divergence, the organization of layer 6 into a 6a and 6b appears conserved.
Our data provide insight into the evolutionary constancy of the neocortical layers across mammals. The striking similarities in layer marker expression patterns support the notion that the neocortical layers and sublayers are evolutionarily stable, and are present in their essentials across all mammals. The ferret, as a representative carnivore, is currently thought to be an outgroup to both primates and rodents (Lindblad-Toh, 2004). As such, similarities in expression patterns between ferret and mouse should hold in primates too, including humans.
Supplementary Material
ACKNOWLEDGMENTS
We thank Christine Labno and Vytas Bindokas of the University of Chicago IDDRC microscope facility, the University of Chicago ARC veterinary staff, Rahul Parnaik who developed the multi-color fluorescence ISH technique, and Elizabeth Grove, Ray Guillery and Murray Sherman who read the manuscript.
Grant Information
Grant sponsor: National Institutes of Health; Grant number: R01 EY016838.
LITERATURE CITED
- Allendoerfer K, Shatz C. The subplate, a transient neocortical structure: its role in the development of connections between thalamus and cortex. Annu Rev Neurosci. 1994;17:185–218. doi: 10.1146/annurev.ne.17.030194.001153. [DOI] [PubMed] [Google Scholar]
- Amunts K, Istomin V, Schleicher A, Zilles K. Postnatal development of the human primary motor cortex: a quantitative cytoarchitectonic analysis. Anat Embryol. 1995;192:557–571. doi: 10.1007/BF00187186. [DOI] [PubMed] [Google Scholar]
- Arlotta P, Molyneaux BJ, Chen J, Inoue J, Kominami R, Macklis JD. Neuronal subtype-specific genes that control corticospinal motor neuron development in vivo. Neuron. 2004;45:207–221. doi: 10.1016/j.neuron.2004.12.036. [DOI] [PubMed] [Google Scholar]
- Bannister AP. Inter- and intra-laminar connections of pyramidal cells in the neocortex. Neuroscience Research. 2005;53:95–103. doi: 10.1016/j.neures.2005.06.019. [DOI] [PubMed] [Google Scholar]
- Bizley JK, Nodal FR, Nelken I, King AJ. Functional organization of ferret auditory cortex. Cereb Cortex. 2005;15:1637–1653. doi: 10.1093/cercor/bhi042. [DOI] [PubMed] [Google Scholar]
- Brodmann K. In: Lokalisationslehre der groshirnrinde in ihren principen dargestellt aus grund des zellen baue. Garey LJ, translator. Leipzig: World Scientific Publishing Co; 1909. Barth. Translated by, 2006. [Google Scholar]
- Bulfone A, Caccioppoli C, Pardini C, Faedo A, Martinez S, Banfi S. Pcp4l1, a novel gene encoding a Pcp4-like polypeptide, is expressed in specific domains of the developing brain. Gene Expression Patterns. 2004;4:297–301. doi: 10.1016/j.modgep.2003.11.001. [DOI] [PubMed] [Google Scholar]
- Bureau I, von Saint Paul F, Svoboda K. Interdigitated paralemniscal and lemniscal pathways in the mouse barrel cortex. PLoS Biol. 2006;4:e382. doi: 10.1371/journal.pbio.0040382. [DOI] [PMC free article] [PubMed] [Google Scholar]
- Callaway EM, Lieber JL. Development of axonal arbors of layer 6 pyramidal neurons in ferret primary visual cortex. J Comp Neurol. 1996;376:295–305. doi: 10.1002/(SICI)1096-9861(19961209)376:2<295::AID-CNE10>3.0.CO;2-L. [DOI] [PubMed] [Google Scholar]
- Chen B, Schaevitz L, McConnell SK. Fezl regulates the differentiation and axon targeting of layer 5 subcortical projection neurons in cerebral cortex. Proc Natl Acad Sci U S A. 2005;22:17184–17189. doi: 10.1073/pnas.0508732102. [DOI] [PMC free article] [PubMed] [Google Scholar]
- Crowley JC, Katz LC. Early development of ocular dominance columns. Science. 2000;290:1321–1324. doi: 10.1126/science.290.5495.1321. [DOI] [PubMed] [Google Scholar]
- Feldblum S, Erlander MG, Tobin AJ. Different distributions of GAD65 and GAD67 mRNAs suggest that the two glutamate decarboxylases play distinctive functional roles. J Neurosci Res. 1993;34:689–706. doi: 10.1002/jnr.490340612. [DOI] [PubMed] [Google Scholar]
- Ferster D, LeVay S. The axonal arborizations of lateral geniculate neurons in the striate cortex of the cat. J Comp Neurol. 1978;182:923–944. doi: 10.1002/cne.901820510. [DOI] [PubMed] [Google Scholar]
- Frantz GD, McConnell SK. Restriction of late cerebral cortical progenitors to an upper-layer fate. 1996;17:55–61. doi: 10.1016/s0896-6273(00)80280-9. [DOI] [PubMed] [Google Scholar]
- Fremeau RT, Troyer MD, Pahner I, Nygaard GO, Tran CH, Reimer RJ, Bellocchio EE, Fortin D, Storm-Mathisen J, Edwards RH. The expression of vesicular glutamate transporters defines two classes of excitatory synapse. Neuron. 2001;31:247–260. doi: 10.1016/s0896-6273(01)00344-0. [DOI] [PubMed] [Google Scholar]
- Friedlander M, Torres-Reveron J. The changing roles of neurons in the cortical subplate. Front Neuroanat. 2009;3 doi: 10.3389/neuro.05.015.2009. Epub. [DOI] [PMC free article] [PubMed] [Google Scholar]
- Gabbott P, Somogyi P. Quantitative distribution of GABA-immunoreactive neurons in the visual cortex (area 17) of the cat. Exp Brain Res. 1986;61:323–331. doi: 10.1007/BF00239522. [DOI] [PubMed] [Google Scholar]
- Gilbert CD. Laminar differences in receptive field properties of cells in cat primary visual cortex. J Phsiol. 1977;268:391–421. doi: 10.1113/jphysiol.1977.sp011863. [DOI] [PMC free article] [PubMed] [Google Scholar]
- Gilbert CD, Kelly JP. The projections of cells in different layers of the cat's visual cortex. J Comp Neurol. 1975;163:81–106. doi: 10.1002/cne.901630106. [DOI] [PubMed] [Google Scholar]
- Gilbert CD, Wiesel TN. Intrinsic connectivity and receptive field properties in visual cortex. Vis Res. 1985;25:365–374. doi: 10.1016/0042-6989(85)90061-6. [DOI] [PubMed] [Google Scholar]
- Goloboff P, Catalano S, Mirande J, Szumik C, Arias J, Kallersjo M, Farris J. Phylogenetic analysis of 73060 taxa corroborates major eukaryotic groups. Cladistics. 2009;25:211–230. doi: 10.1111/j.1096-0031.2009.00255.x. [DOI] [PubMed] [Google Scholar]
- Grove EA, Tole S, Limon J, Yip L, Ragsdale CW. The hem of the embryonic cerebral cortex is defined by the expression of multiple Wnt genes and is compromised in Gli3-deficient mice. Development. 1998;125:2315–2325. doi: 10.1242/dev.125.12.2315. [DOI] [PubMed] [Google Scholar]
- Herculano-Houzel S, Collins CE, Wong P, Kaas JH, Lent R. The basic nonuniformity of the cerebral cortex. Proc Natl Acad Sci U S A. 2008;105:12593–12598. doi: 10.1073/pnas.0805417105. [DOI] [PMC free article] [PubMed] [Google Scholar]
- Heuer H, Christ S, Friedrichsen S, Brauer D, Winckler M, Bauer K, Raivich G. Connective tissue growth factor: a novel marker of layer VII neurons in the rat cerebral cortex. Neuroscience. 2003;119:43–52. doi: 10.1016/s0306-4522(03)00100-3. [DOI] [PubMed] [Google Scholar]
- Hevner RF. Layer-specific markers as probes for neuron type identity in human neocortex and malformations of cortical development. Journal of Neuropathology & Experimental Neurology. 2007;66:101–109. doi: 10.1097/nen.0b013e3180301c06. [DOI] [PubMed] [Google Scholar]
- Hevner RF, Daza R, Rubenstein J, Stunnenberg H, Olavarria J, Englund C. Beyond laminar fate: toward a molecular classification of cortical projection/pyramidal neurons. Dev Neurosci. 2003;25:139–151. doi: 10.1159/000072263. [DOI] [PubMed] [Google Scholar]
- Higo S, Udaka N, Tamamaki N. Long-range GABAergic projection neurons in the cat neocortex. J Comp Neurol. 2007;503:421. doi: 10.1002/cne.21395. [DOI] [PubMed] [Google Scholar]
- Hoffman PN, Cleveland DW, Griffin JW, Landes PW, Cowan NJ, Price DL. Neurofilament gene expression: A major determinant of axonal caliber. Proc Natl Acad Sci U S A. 1987;84:3472–3476. doi: 10.1073/pnas.84.10.3472. [DOI] [PMC free article] [PubMed] [Google Scholar]
- Humphrey A, Sur M, Uhlrich D, Sherman S. Projection patterns of individual X- and Y-cell axons from the lateral geniculate nucleus to cortical area 17 in the cat. J Comp Neurol. 1985;233:159–189. doi: 10.1002/cne.902330203. [DOI] [PubMed] [Google Scholar]
- Huntley G, Jones E. The emergence of architectonic field structure and areal borders in developing monkey sensorimotor cortex. Neuroscience. 1991;44:287–310. doi: 10.1016/0306-4522(91)90055-s. [DOI] [PubMed] [Google Scholar]
- Hutsler JJ, Lee D-G, Porter KK. Comparative analysis of cortical layering and supragranular layer enlargement in rodent carnivore and primate species. Brain Research. 2005;1052:71–81. doi: 10.1016/j.brainres.2005.06.015. [DOI] [PubMed] [Google Scholar]
- Inoue K, Terashima T, Nishikawa T, Takumi T. Fez1 is layer-specifically expressed in the adult mouse neocortex. European Journal of Neuroscience. 2004;20:2909–2916. doi: 10.1111/j.1460-9568.2004.03763.x. [DOI] [PubMed] [Google Scholar]
- Jones E, Wise S. Size, laminar and columnar distribution of efferent cells in the sensory-motor cortex of monkeys. J Comp Neurol. 1977;175:391–438. doi: 10.1002/cne.901750403. [DOI] [PubMed] [Google Scholar]
- Killackey H, Sherman SM. Corticothalamic projections from the rat primary somatosensory cortex. J Neurosci. 2003;23:7381–7384. doi: 10.1523/JNEUROSCI.23-19-07381.2003. [DOI] [PMC free article] [PubMed] [Google Scholar]
- Kirkcaldie MTK, Dickson TC, King CE, Grasby D, Riederer BM, Vickers JC. Neurofilament triplet proteins are restricted to a subset of neurons in the rat neocortex. Journal of Chemical Neuroanatomy. 2002;24:163–171. doi: 10.1016/s0891-0618(02)00043-1. [DOI] [PubMed] [Google Scholar]
- Krettek J, Price J. Projections from the amygdaloid complex to the cerebral cortex and thalamus in the rat and cat. J Comp Neurol. 1977;172:687–722. doi: 10.1002/cne.901720408. [DOI] [PubMed] [Google Scholar]
- Kuramoto E, Furuta T, Nakamura KC, Unzai T, Hioki H, Kaneko T. Two types of thalamocortical projections from the motor thalamic nuclei of the rat: a single neuron-tracing study using viral vectors. Cereb Cortex. 2009;19:2065–2077. doi: 10.1093/cercor/bhn231. [DOI] [PubMed] [Google Scholar]
- Kwan K, Lam M, Krsnik Z, Kawasawa Y, Lefebvre V, Sestan N. SOX5 postmitotically regulates migration, postmigratory differentiation, and projections of subplate and deep-layer neocortical neurons. Proc Natl Acad Sci U S A. 2008;105:16021–16026. doi: 10.1073/pnas.0806791105. [DOI] [PMC free article] [PubMed] [Google Scholar]
- Larkman A, Mason A. Correlations between morphology and electrophysiology of pyramidal neurons in slices of rat visual cortex. I. Establishment of cell classes. J Neurosci. 1990;10:1407–1414. doi: 10.1523/JNEUROSCI.10-05-01407.1990. [DOI] [PMC free article] [PubMed] [Google Scholar]
- Law MI, Zahs KR, Stryker MP. Organization of primary visual cortex (area 17) in the ferret. J Comp Neurol. 1988;278:157–180. doi: 10.1002/cne.902780202. [DOI] [PubMed] [Google Scholar]
- Lein ES, Hawrylycz MJ, Ao N, Ayres M, Bensinger A, Bernard A, Boe AF, Boguski MS, Brockway KS, Byrnes EJ, Chen L, Chen L, Chen T-M, Chi Chin M, Chong J, Crook BE, Czaplinska A, Dang CN, Datta S, Dee NR, Desaki AL, Desta T, Diep E, Dolbeare TA, Donelan MJ, Dong H-W, Dougherty JG, Duncan BJ, Ebbert AJ, Eichele G, Estin LK, Faber C, Facer BA, Fields R, Fischer SR, Fliss TP, Frensley C, Gates SN, Glattfelder KJ, Halverson KR, Hart MR, Hohmann JG, Howell MP, Jeung DP, Johnson RA, Karr PT, Kawal R, Kidney JM, Knapik RH, Kuan CL, Lake JH, Laramee AR, Larsen KD, Lau C, Lemon TA, Liang AJ, Liu Y, Luong LT, Michaels J, Morgan JJ, Morgan RJ, Mortrud MT, Mosqueda NF, Ng LL, Ng R, Orta GJ, Overly CC, Pak TH, Parry SE, Pathak SD, Pearson OC, Puchalski RB, Riley ZL, Rockett HR, Rowland SA, Royall JJ, Ruiz MJ, Sarno NR, Schaffnit K, Shapovalova NV, Sivisay T, Slaughterbeck CR, Smith SC, Smith KA, Smith BI, Sodt AJ, Stewart NN, Stumpf K-R, Sunkin SM, Sutram M, Tam A, Teemer CD, Thaller C, Thompson CL, Varnam LR, Visel A, Whitlock RM, Wohnoutka PE, Wolkey CK, Wong VY, Wood M, Yaylaoglu MB, Young RC, Youngstrom BL, Feng Yuan X, Zhang B, Zwingman TA, Jones AR. Genome-wide atlas of gene expression in the adult mouse brain. Nature. 2007;445:168–176. doi: 10.1038/nature05453. [DOI] [PubMed] [Google Scholar]
- Leone DP, Srinivasan K, Chen B, Alcamo E, McConnell SK. The determination of projection neuron identity in the developing cerebral cortex. Current Opinion in Neurobiology. 2008;18:28–35. doi: 10.1016/j.conb.2008.05.006. [DOI] [PMC free article] [PubMed] [Google Scholar]
- LeVay S, Gilbert CD. Laminar patterns of geniculocortical projections in the cat. Brain Research. 1976;113:1–19. doi: 10.1016/0006-8993(76)90002-0. [DOI] [PubMed] [Google Scholar]
- LeVay S, Sherk H. The visual claustrum of the cat. I. Structure and connections. J Neurosci. 1981;1:956–980. doi: 10.1523/JNEUROSCI.01-09-00956.1981. [DOI] [PMC free article] [PubMed] [Google Scholar]
- Lewis WB. Researches on the comparative structure of the cortex cerebri. Philosophical Transactions of the Royal Society of London. 1880;171:35–64. [Google Scholar]
- Lewis WB. On the comparative structure of the brain in rodents. Philosophical Transactions of the Royal Society of London. 1882;173:699–794. [Google Scholar]
- Lewis WB, Clarke H. The cortical lamination of the motor area of the brain. Proceedings of the Royal Society of London. 1878;27:38–49. [Google Scholar]
- Lindblad-Toh K. Genome sequencing: three's company. Nature. 2004;428:475–476. doi: 10.1038/428475a. [DOI] [PubMed] [Google Scholar]
- Lorente de No R. Cerebral cortex: architecture, intracortical connections, motor projections. In: Fulton JF, editor. Physiology of the nervous system. London: Oxford University Press; 1943. pp. 274–298. [Google Scholar]
- Ludwig J, Weseloh R, Karschin C, Liu Q, Netzer R, Engeland B, Stansfeld C, Pongs O. Cloning and functional expression of rat eag2, a new member of the ether-a-go-go family of potassium channels and comparison of Its distribution with that of eag1. Molecular and Cellular Neuroscience. 2000;16:59–70. doi: 10.1006/mcne.2000.0851. [DOI] [PubMed] [Google Scholar]
- Lund J. Organisation of neurons in the visual cortex, area 17, of the monkey (Macaca mulattu) J Comp Neurol. 1973;147:455–496. doi: 10.1002/cne.901470404. [DOI] [PubMed] [Google Scholar]
- Lund J. Anatomical organization of macaque monkey striate visual cortex. Annu Rev Neurosci. 1988;11:253–288. doi: 10.1146/annurev.ne.11.030188.001345. [DOI] [PubMed] [Google Scholar]
- Lund J, Henry G, Macqueen C, Harvey A. Anatomical organization of the primary visual cortex (area 17) of the cat. A comparison with area 17 of the macaque monkey. J Comp Neurol. 1979;184:599–618. doi: 10.1002/cne.901840402. [DOI] [PubMed] [Google Scholar]
- Lund J, Lund R, Hendrickson A, Bunt A, Fuchs A. The origin of efferent pathways from the primary visual cortex, area 17, of the macaque monkey as shown by retrograde transport of horseradish peroxidase. J Comp Neurol. 1975;164:287–304. doi: 10.1002/cne.901640303. [DOI] [PubMed] [Google Scholar]
- Lunter G. Dog as an outgroup to human and mouse. PLoS Comput Biol. 2007;3:e74. doi: 10.1371/journal.pcbi.0030074. [DOI] [PMC free article] [PubMed] [Google Scholar]
- Madsen O, Scally M, Douady CJ, Kao DJ, DeBry RW, Adkins R, Amrine HM, Stanhope MJ, de Jong WW, Springer MS. Parallel adaptive radiations in two major clades of placental mammals. Nature. 2001;409:610–614. doi: 10.1038/35054544. [DOI] [PubMed] [Google Scholar]
- Manger PR, Kiper D, Masiello I, Murillo L, Tettoni L, Hunyadi Z, Innocenti GM. The representation of the visual field in three extrastriate areas of the ferret (Mustela putorius) and the relationship of retinotopy and field boundaries to callosal connectivity. Cereb Cortex. 2002;12:423–437. doi: 10.1093/cercor/12.4.423. [DOI] [PubMed] [Google Scholar]
- Marin-Padilla M. Prenatal and early postnatal ontogenesis of the human motor cortex: a Golgi study. I. The sequential development of the cortical layers. Brain Res. 1970;23:167–183. doi: 10.1016/0006-8993(70)90037-5. [DOI] [PubMed] [Google Scholar]
- Masland RH. Neuronal cell types. Current Biology. 2004;14:R497–R500. doi: 10.1016/j.cub.2004.06.035. [DOI] [PubMed] [Google Scholar]
- Meynert T. The brain of mammals. In: Stricker S, editor. Manual of Human and Comparative Histology. London: The New Sydenham Society; 1872. pp. 367–411. [Google Scholar]
- Molnar Z, Cheung AFP. Towards the classification of subpopulations of layer V pyramidal projection neurons. Neuroscience Research. 2006;55:105–115. doi: 10.1016/j.neures.2006.02.008. [DOI] [PubMed] [Google Scholar]
- Molyneaux BJ, Arlotta P, Hirata T, Hibi M, Macklis JD. Fezl is required for the birth and specification of corticospinal motor neurons. 2005;47:817–831. doi: 10.1016/j.neuron.2005.08.030. [DOI] [PubMed] [Google Scholar]
- Molyneaux BJ, Arlotta P, MacDonald J, MacQuarrie K, Macklis JD. Novel subtype-specific genes identify distinct subpopulations of callosal projection neurons. J Neurosci. 2009;29:12343–12354. doi: 10.1523/JNEUROSCI.6108-08.2009. [DOI] [PMC free article] [PubMed] [Google Scholar]
- Molyneaux BJ, Arlotta P, Menezes JRL, Macklis JD. Neuronal subtype specification in the cerebral cortex. Nat Rev Neurosci. 2007;8:427–437. doi: 10.1038/nrn2151. [DOI] [PubMed] [Google Scholar]
- Murphy WJ, Eizirik E, Johnson WE, Zhang YP, Ryder OA, O'Brien SJ. Molecular phylogenetics and the origins of placental mammals. Nature. 2001;6820:614–618. doi: 10.1038/35054550. [DOI] [PubMed] [Google Scholar]
- Nagamine S, Koike S, Keino-Masu K, Masu M. Expression of a heparan sulfate remodeling enzyme, heparan sulfate 6-O-endosulfatase sulfatase FP2, in the rat nervous system. Developmental Brain Research. 2005;159:135–143. doi: 10.1016/j.devbrainres.2005.07.006. [DOI] [PubMed] [Google Scholar]
- Nelson SB, Sugino K, Hempel CM. The problem of neuronal cell types: a physiological genomics approach. Trends in Neurosciences. 2006;29:339–345. doi: 10.1016/j.tins.2006.05.004. [DOI] [PubMed] [Google Scholar]
- Ng L, Bernard A, Lau C, Overly CC, Dong H-W, Kuan C, Pathak S, Sunkin SM, Dang C, Bohland JW, Bokil H, Mitra PP, Puelles L, Hohmann J, Anderson DJ, Lein ES, Jones AR, Hawrylycz M. An anatomic gene expression atlas of the adult mouse brain. Nat Neurosci. 2009;12:356–362. doi: 10.1038/nn.2281. [DOI] [PubMed] [Google Scholar]
- Ng L, Lau C, Sunkin SM, Bernard A, Chakravarty M, Lein ES, Jones AR, Hawrylycz M. Surface-based mapping of gene expression and probabilistic expression maps in the mouse cortex. Methods. 2010;50:55–62. doi: 10.1016/j.ymeth.2009.10.001. [DOI] [PubMed] [Google Scholar]
- Nieto M, Monuki ES, Tang H, Imitola J, Haubst N, Khoury SJ, Cunningham J, Gotz M, Walsh CA. Expression of Cux-1 and Cux-2 in the subventricular zone and upper layers II-IV of the cerebral cortex. The Journal of Comparative Neurology. 2004;479:168–180. doi: 10.1002/cne.20322. [DOI] [PubMed] [Google Scholar]
- Northcutt RG, Kaas JH. The emergence and evolution of mammalian neocortex. Trends in Neurosciences. 1995;18:373–379. doi: 10.1016/0166-2236(95)93932-n. [DOI] [PubMed] [Google Scholar]
- O'Leary J. Structure of the area striate of the cat. J Comp Neurol. 1941;75:131–161. [Google Scholar]
- Okano HJ, Darnell RB. A hierarchy of Hu RNA binding proteins in developing and adult neurons. J Neurosci. 1997;17:3024–3037. doi: 10.1523/JNEUROSCI.17-09-03024.1997. [DOI] [PMC free article] [PubMed] [Google Scholar]
- Pallas SL, Roe AW, Sur M. Visual projections induced into the auditory pathway of ferrets. I. Novel inputs to primary auditory cortex (AI) from the LP/pulvinar complex and the topography of the MGN-AI projection. J Comp Neurol. 1990;298:50–68. doi: 10.1002/cne.902980105. [DOI] [PubMed] [Google Scholar]
- Peters A, Yilmaz E. Neuronal organization in area 17 of cat visual cortex. Cereb Cortex. 1993;3:49–68. doi: 10.1093/cercor/3.1.49. [DOI] [PubMed] [Google Scholar]
- Rakic P. Confusing cortical columns. Proc Natl Acad Sci U S A. 2008;105:12099–12100. doi: 10.1073/pnas.0807271105. [DOI] [PMC free article] [PubMed] [Google Scholar]
- Ramon y Cajal S. Textura del sistema nervioso del hombre y de los vertebrados. Estudios sobre el plan estructural y composición histológica de los centros nerviosos adicionados de consideraciones fisiológicas fundadas en los nuevos descubrimientos. In: Moya N, editor. Madrid: Oxford University Press; 1899–1904. Translated from the Spanish by L. Azoulay. Translated from the French by N. Swanson and L.W. Swanson, 1995. [Google Scholar]
- Reinhard E, Suidan H, Pavlik A, Monard D. Glia-derived nexin/protease nexin-1 is expressed by a subset of neurons in the rat brain. J Neursci Res. 1994;37:256–270. doi: 10.1002/jnr.490370211. [DOI] [PubMed] [Google Scholar]
- Rockel AJ, Hiorns RW, Powell TPS. The basic uniformity in structure of the neocortex. Brain. 1980;103:221–244. doi: 10.1093/brain/103.2.221. [DOI] [PubMed] [Google Scholar]
- Rockland KS. Anatomical organization of primary visual cortex (area 17) in the ferret. J Comp Neurol. 1985;241:225–236. doi: 10.1002/cne.902410209. [DOI] [PubMed] [Google Scholar]
- Rockland KS, Ichinohe N. Some thoughts on cortical minicolumns. Exp Brain Res. 2004;158:265–277. doi: 10.1007/s00221-004-2024-9. [DOI] [PubMed] [Google Scholar]
- Rose J, Woolsey C. Structure and relations of limbic cortex and anterior thalamic nuclei in rabbit and cat. J Comp Neurol. 1948;89:279–347. doi: 10.1002/cne.900890307. [DOI] [PubMed] [Google Scholar]
- Saganich MJ, de Miera EV-S, Nadal MS, Baker H, Coetzee WA, Rudy B. Cloning of components of a novel subthreshold-activating K+ channel with a unique pattern of expression in the cerebral cortex. J Neurosci. 1999;19:10789–10802. doi: 10.1523/JNEUROSCI.19-24-10789.1999. [DOI] [PMC free article] [PubMed] [Google Scholar]
- Sailer CA, Hu H, Kaufmann WA, Trieb M, Schwarzer C, Storm JF, Knaus H-G. Regional differences in distribution and functional expression of small-conductance Ca2+-activated K+ channels in rat brain. J Neurosci. 2002;22:9698–9707. doi: 10.1523/JNEUROSCI.22-22-09698.2002. [DOI] [PMC free article] [PubMed] [Google Scholar]
- Schaeren-Wiemers N, Andre E, Kapfhammer JP, Becker-Andre M. The expression pattern of the orphan nuclear receptor RORbeta in the developing and adult rat nervous system suggests a role in the processing of sensory information and in circadian rhythm. Eur J Neurosci. 1997;9:2687–2701. doi: 10.1111/j.1460-9568.1997.tb01698.x. [DOI] [PubMed] [Google Scholar]
- Shu W, Yang H, Zhang L, Lu MM, Morrisey EE. Characterization of a new subfamily of winged-helix/forkhead (Fox) genes that are expressed in the lung and act as transcriptional repressors. J Biol Chem. 2001;276:27488–27497. doi: 10.1074/jbc.M100636200. [DOI] [PubMed] [Google Scholar]
- Skoglund TS, Pascher R, Berthold CH. Heterogeneity in the columnar number of neurons in different neocortical areas in the rat. Neuroscience Letters. 1996;208:97–100. doi: 10.1016/0304-3940(96)12569-6. [DOI] [PubMed] [Google Scholar]
- Sloper JJ, Powell TPS. An experimental electron microscopic study of afferent connections to the primate motor and somatic sensory cortices. Philosophical Transactions of the Royal Society of London. 1979;285:199–226. doi: 10.1098/rstb.1979.0005. [DOI] [PubMed] [Google Scholar]
- Smart I, McSherry G. Gyrus formation in the cerebral cortex of the ferret. II. Description of the internal histological changes. J Anat. 1986;147:27–43. [PMC free article] [PubMed] [Google Scholar]
- Strick P, Sterling P. Synaptic termination of afferents from the ventrolateral nucleus of the thalamus in the cat motor cortex. A light and electron microscopy study. J Comp Neurol. 1974;153:77–106. doi: 10.1002/cne.901530107. [DOI] [PubMed] [Google Scholar]
- Symonds L, Rosenquist A. Laminar origins of visual corticocortical connections in the cat. J Comp Neurol. 1984;229:39–47. doi: 10.1002/cne.902290104. [DOI] [PubMed] [Google Scholar]
- Takeuchi A, Hamasaki T, Litwack ED, O'Leary DDM. Novel IgCAM, MDGA1, expressed in unique cortical area- and layer-specific patterns and transiently by distinct forebrain populations of cajal-retzius neurons. Cereb Cortex. 2007;17:1531–1541. doi: 10.1093/cercor/bhl064. [DOI] [PubMed] [Google Scholar]
- Talley EM, Cribbs LL, Lee J-H, Daud A, Perez-Reyes E, Bayliss DA. Differential distribution of three members of a gene family encoding low voltage-activated (T-type) calcium channels. J Neurosci. 1999;19:1895–1911. doi: 10.1523/JNEUROSCI.19-06-01895.1999. [DOI] [PMC free article] [PubMed] [Google Scholar]
- Tarabykin V, Stoykova A, Usman N, Gruss P. Cortical upper layer neurons derive from the subventricular zone as indicated by Svet1 gene expression. Development. 2001;128:1983–1993. doi: 10.1242/dev.128.11.1983. [DOI] [PubMed] [Google Scholar]
- Thomson AM, Bannister AP. Interlaminar connections in the neocortex. Cereb Cortex. 2003;13:5–14. doi: 10.1093/cercor/13.1.5. [DOI] [PubMed] [Google Scholar]
- Ullrich B, Sudhof TC. Differential distributions of novel synaptotagmins: Comparison to synapsins. Neuropharmacology. 1995;34:1371–1377. doi: 10.1016/0028-3908(95)00132-p. [DOI] [PubMed] [Google Scholar]
- von Economo C. In: The cytoarchitectonics of the human cerebral cortex. Parker S, translator. London: Oxford University Press; 1929. [Google Scholar]
- Ware ML, Tavazoie SF, Reid CB, Walsh CA. Coexistence of widespread clones and large radial clones in early embryonic ferret cortex. Cereb Cortex. 1999;9:636–645. doi: 10.1093/cercor/9.6.636. [DOI] [PubMed] [Google Scholar]
- Watakabe A, Ichinohe N, Ohsawa S, Hashikawa T, Komatsu Y, Rockland KS, Yamamori T. Comparative analysis of layer-specific genes in mammalian neocortex. Cereb Cortex. 2007;17:1918–1933. doi: 10.1093/cercor/bhl102. [DOI] [PubMed] [Google Scholar]
- Wise S, Jones E. Cells of origin and terminal distribution of descending projections of the rat somatic sensory cortex. J Comp Neurol. 1977;175:129–158. doi: 10.1002/cne.901750202. [DOI] [PubMed] [Google Scholar]
- Zhang Z-W, Deschenes M. Intracortical axonal projections of lamina VI cells of the primary somatosensory cortex in the rat: A single-cell labeling study. J Neurosci. 1997;17:6365–6379. doi: 10.1523/JNEUROSCI.17-16-06365.1997. [DOI] [PMC free article] [PubMed] [Google Scholar]
Associated Data
This section collects any data citations, data availability statements, or supplementary materials included in this article.