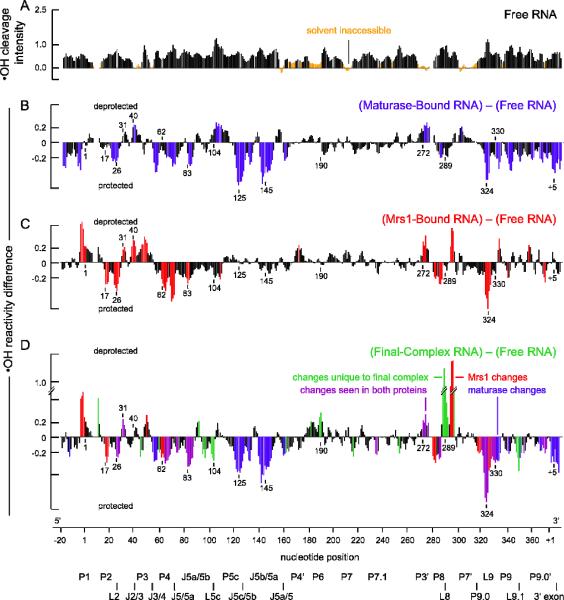
Figure 3.
Protein-mediated changes in backbone solvent accessibility in the bI3 RNA. (A) Cleavage intensity versus nucleotide position for the free RNA. Nucleotides with reactivities less than one-half the mean are indicated in orange. Difference plot histograms for RNAs bound by (B) maturase alone, (C) Mrs1 alone, and (D) both proteins. Nucleotides with large protein-induced changes in reactivity are colored as in Figure 2. Structural landmarks are indicated below the axis.

