Abstract
Sustained activity-dependent synaptic modifications require protein synthesis. Although proteins can be synthesized locally in dendrites, long-term changes also require nuclear signaling. Amyloid-β protein precursor intracellular domain-associated protein-1 (AIDA-1), an abundant component of the biochemical postsynaptic density fraction, contains a nuclear localization sequence, making it a plausible candidate for synapse-to-nucleus signaling. We used immunohistochemistry to study the regional, cellular, and subcellular distribution of AIDA-1. Immunostaining was prominent in the hippocampus, cerebral cortex, and neostriatum. Along with diffuse staining of neuropil, fluorescence microscopy revealed immunostaining of excitatory synapses throughout the forebrain, and immunoreactive puncta within and directly outside the nucleus. Presynaptic staining was conspicuous in hippocampal mossy fibers. Electron microscopic analysis of material processed for postembedding immunogold revealed AIDA-1 label within postsynaptic densities in both hippocampus and cortex. Together with previous work, these data suggest that AIDA-1 serves as a direct signaling link between synapses and the nucleus in adult rat brain.
Keywords: AIDA-1, AICD, APP, synapse-to-nucleus signaling, immunogold, synaptic plasticity, PSD
Introduction
The intercellular appositions at synapses are specialized sites of communication between neurons. Transmitter receptors concentrate in the postsynaptic density (PSD), a protein-rich zone that acts as a general organizer of signal transduction, including pathways associated with synaptic plasticity (Ziff, 1997; Okabe, 2007; Sheng et al., 2007). Available data suggest that long-term plasticity requires synthesis of new protein to be sustained (Krug et al., 1984; Nguyen et al., 1994; Abraham et al., 2008). While the precise balance between local dendritic versus remote somatic protein translation is a topic of continued study (Schuman et al., 2006; Skup, 2008), nuclear transcription leading to subsequent protein translation is required for sustained expression of several types of long-term synaptic plasticity (Frey et al.,1989; Calixto et al., 2003; Reymann et al., 2007).
β-amyloid, a cleavage product of amyloid-β protein precursor (APP), is a major component of amyloid plaques, a hallmark of the Alzheimer’s disease (Duyckaerts et al., 2009). Another cleavage product, APP intracellular domain (AID, or AICD), may play a role in apoptosis, calcium homeostasis, and transcriptional regulation (Hamid et al., 2007; Müller et al., 2008; Slomnicki et al., 2008); however, whether AID plays a role in Alzheimer disease remains controversial. AID-associated protein-1 (AIDA-1) is a recently discovered protein that binds AID (Ghersi, Noviello et al., 2004; Ghersi, Vito et al., 2004). Proteomic studies suggest that AIDA-1 is a major component of the biochemically-isolated PSD fraction (Jordan et al., 2004; Peng et al., 2004; Yoshimura et al., 2004). Its function remains rather mysterious, but recent evidence suggests that AIDA-1 provides a novel route of communication between synapses and nuclei. In cultured hippocampal neurons, AIDA-1 translocates to the nucleus in an NMDAR-dependent manner, leading to downstream increases in protein translation (Jordan et al., 2007). A recent study confirmed that AIDA-1 contains a nuclear localization signal (Kurabi et al., 2009). Together, this evidence suggests that AIDA-1 might link synaptic activity to a nuclear response.
AIDA-1 has been studied in culture systems, but little is known about its distribution in vivo. Here, we use immunocytochemistry to study the organization of AIDA-1 in adult rat brain. Our results show both nuclear and synaptic localization, providing new clues concerning possible functions of AIDA-1 in neurons.
Experimental Procedures
Tissue Preparation
Experiments were carried out on 13 adult male Sprague-Dawley rats ranging from 3 to 10 months old, from Charles River Laboratories (Raleigh, NC, USA). Four were used for DAB staining, 4 were used for confocal microscopy, 2 were used for preembedding electron microscopy, and 3 were used for postembedding electron microscopy. All procedures related to the care and treatment of animals were conducted according to institutional and NIH guidelines. Animals were deeply anesthetized with sodium pentobarbital (60 mg/kg) and intracardially perfused with saline followed by ~ 500 mL of fixative. For light microscopy, fixation was with 4% depolymerized paraformaldehyde (PFA) in 0.1 M phosphate buffer, pH 7.4 (PB); for electron microscopy, fixation was with either a mixture of 2% PFA and 2% glutaraldehyde (GA) in PB or 4% PFA and 0.5% GA in PB. The brains were removed and postfixed for 2 hours in the same fixative at 4°C. Coronal sections containing hippocampus and cerebral cortex were cut on a Vibratome at 40-60 μm (for light and electron microscopy) or 200-250 μm (for freeze substitution electron microscopy) and collected in cold PB.
Antibodies
Primary antibodies used were affinity-purified polyclonal antibodies against AIDA-1 raised in rabbit (2.5 – 6.3 μg/mL, Zymed, San Francisco, CA; 36-7000); against vesicular glutamate transporter 1 in guinea pig (VGLUT1, 0.2 μg/mL, Chemicon, Temecula, CA; AB5905); against glutamate decarboxylase-65 in mouse (GAD-65, 8 μg/mL, Chemicon; AB5082), and a mouse monoclonal antibody raised against nuclear pore complex proteins (NPC; 1 μg/mL, Covance, Princeton, NJ; MAb414).
To prepare the AIDA-1 antibody, rabbits were injected repeatedly with a peptide conjugate corresponding to the sequence RLHDDPPQKPPRSIT starting at position 172 on AIDA-1d. This antibody recognizes both cleaved and uncleaved AIDA-1. (See Results for further details on antibody characterization.)
The VGLUT1 antibody was raised against a 19-residue peptide sequence (GATHSTVQPPRPPPPVRDY) found at the C terminus of rat VGLUT1. The specificity of this antibody has been confirmed by Western blot; the VGLUT1 antibody recognized a single ~60 kDa band (Melone et al., 2005).
The GAD-65 antibody, raised against human GAD-65 from baculovirus-infected cells, recognized two bands on Western blot. A 65 kDa band corresponded to GAD-65, and a 62kDa corresponding to a protease fragment. Results from this antibody have been reported in numerous publications, and it yields a pattern of staining in many brain regions characteristic of GABAergic innervation (Mi et al., 2002; Swanwick et al., 2006; Belichenko et al., 2009).
The widely-used NPC antibody, raised against a nuclear pore complex mixture and purified via protein-G chromatography, recognizes the conserved domain FXFG repeats in nucleoporins. In Western blot, the antibody recognized a single band at 62 kD. Immunofluorescence staining revealed punctate staining along the nuclear border. Immunoelectron microscopy confirmed this finding (Davis et al., 1986).
Immunocytochemistry for Light Microscopy
All incubations were carried out on a shaker at room temperature. Fixed sections were treated with 3% H2O2 in 0.01M phosphate-buffered saline, pH 7.2 (PBS) to suppress endogenous peroxidases, and 10% normal donkey serum (NDS; Jackson ImmunoResearch, West Grove PA, USA) in PBS to mask secondary antibody binding sites. Sections were then incubated overnight with primary antibodies in various combinations. For immunoperoxidase staining, sections were rinsed in PBS and blocked with 2% NDS before treatment with biotin-conjugated donkey anti-rabbit antibody (5 μg/mL; Jackson ImmunoResearch) in PBS. After rinsing in PBS, sections were treated with Extravidin-peroxidase (0.4-0.5 μg/mL ; Sigma, St Louis, MO, USA) and processed with nickel-intensified 3,3′– diaminobenzidine tetrahydrochloride (Ni-DAB). Sections were then mounted on gelatin-coated slides, air-dried, cleared with xylene, and coverslipped with DPX (BDH Laboratory Supplies, Poole, UK). For immunofluorescence, sections were washed in PBS, incubated in a fluorochrome-conjugated secondary antibody (Cy3, FITC, or Cy5, 7.5 μg/mL in PBS; Jackson Immunoresearch), rinsed, mounted on slides, and coverslipped with Vectashield mounting medium (Vector, Burlingame, CA, USA). To counterstain nuclei, 4′,6-diamidino-2-phenylindole dihydrochloride (DAPI, 0.5 μg/mL in PBS; Molecular Probes, Eugene, OR) was applied after the secondary antibody. Sections were then mounted on gelatin-coated slides and coverslipped. DAB sections were examined with a Leitz DMR microscope (Lecia, Wetzlar, Germany), and images were collected using a 12-bit cooled charge-coupled device camera(Retiga EX, QImaging, Canada) coupled to a Macintosh computer (Apple Inc., Cupertino, CA, USA). Confocal images were collected with a Zeiss 510-LSM confocal microscope.
Immunocytochemistry for Electron Microscopy
For pre-embedding electron microscopy, sections were treated sequentially for 30 minutes in 1% sodium borohydride in PB, in 3% H2O2 in 0.01M PBS, and in 10% NDS, and then incubated overnight with the primary antibody. Following rinses in PBS, sections were either treated with Extravidin-peroxidase (0.4-0.5 μg/mL) followed by Ni-DAB (for immunoperoxidase staining), or incubated in streptavidin coupled to 1.4 nm gold particles (1:100, Nanoprobes Inc., Yaphank, NY, USA) for 2 hrs at room temperature (for immunogold detection). Gold-treated sections were rinsed in 0.1 M sodium acetate (to remove phosphate and chloride ions) and underwent silver enhancement with an Amersham IntenSE™ M kit (GE Healthcare, Buckinghamshire, UK ). Immunoreacted sections were postfixed in 0.5-1% osmium tetroxide in 0.1 PB for 45 min, and then stained en bloc with 1% uranyl acetate for 45 mins. After dehydration in ascending ethanol series and propylene oxide, sections were infiltrated with Epon/Spurr resin (Electron Microscopy Science, Hatfield, PA, USA) and mounted between sheets of Aclar within glass slides. Sections were cut at ~100 nm, mounted on 200 mesh copper grids, and contrasted with uranyl acetate and Sato’s lead.
Postembedding immunogold staining was performed on sections according to a freeze-substitution protocol: sections, some pretreated with 0.1% 0.1 M CaCl2 in sodium acetate, were cryoprotected in 30% glycerol overnight. Areas of interest were removed and frozen in isopentane chilled with dry ice. Frozen tissue blocks were immersed in 4% uranyl acetate in methanol at −90°C for 48 hours in a freeze-substitution instrument (AFS, Lecia). Following gradual warming, blocks were infiltrated with Lowicryl (HM-20, Electron Microscopy Science) at −45°C and polymerized under UV light. Sixty nm sections were cut from the polymerized blocks and collected on nickel grids for post-embedding staining. Grids were treated with 1% bovine serum albumin in TRIS-buffered saline with 0.005% Tergitol NP-10 (TBSN), pH 7.6, followed by overnight treatment with the primary antibody. Section then underwent treatment with 1% normal goat serum in TBSN pH 8.2 before application of gold-conjugated secondary (10 or 18 nm, Jackson ImmunoResearch). The sections were post-stained using uranyl acetate and Sato’s lead salts. Grids were examined on a Philips Tecnai electron microscope (Hillsboro, OR) at 80 kV; images were collected with a Gatan 12 bit 1024 × 1024 cooled CCD camera (Pleasanton, CA).
Image Processing
Figures were composed and contrast and brightness were adjusted with Adobe Photoshop CS (v 9.0.2, Adobe Systems, Mountain View, CA USA). Color tools were used to enhance visibility in double-labeling images, and many images were sharpened using the Photoshop “unsharp filter” tool. All processing procedures were applied uniformly across the entire image.
Analysis of AIDA-1 Nuclear and Nuclear Pore Association
Data was taken from confocal images collected using a 63x oil objective (numerical aperture1.4) of material immunostained for both AIDA-1 and NPC. To determine nuclear association, puncta contained entirely within the border of nuclei were counted and recorded. To determine NPC association, AIDA-1 puncta colocalizing with NPC were counted. Puncta were defined by both size and brightness; in 300 dpi images, “large” puncta contained a minimum of 25 pixels at an intensity of 100 out of 256 and 7 pixels at an intensity of 200 out of 256. Data was taken in Adobe Photoshop CS and analyzed and graphed in Excel (Microsoft, Redmond, WA, USA).
Analysis of Presynaptic Immunogold Labeling
Electron micrographs containing presynaptic vesicle pools were collected from both CA1 stratum radiatum and CA3 stratum lucidum. The area of the presynaptic vesicle pool was measured, and the number of gold particles contained in the vesicle pool was counted in NIH ImageJ (v1.42; see http://rsb.info.nih.gov/ij) permitting us to calculate particle densities in Excel.
Analysis of Synaptic Immunogold Labeling
To determine the percentage of synapses containing AIDA-1, all synapses within randomly observed fields in AIDA-1-stained grids of stratum radiatum in hippocampus, cerebral cortex, and cerebellum were counted. Synapses containing gold particles within 50 nm of the PSD were counted as AIDA-1-positive; all other synapses were negative. Percentage of synapse expression was calculated from this data.
Electron micrographs of randomly-selected fields containing gold particles within 100 nm of the PSD were taken from CA1 stratum radiatum. For clearly-defined synapses, the distance of gold particles from the postsynaptic membrane (“axo-dendritic position”) and tangentially away from the edge of the postsynaptic density (“lateral position”) were measured. When computing the axo-dendritic position, particles that were >25 nm away from the lateral ends of the PSD were ignored, and when computing lateral position, particles far from the postsynaptic membrane (< −50 or > 75 nm away) were ignored, since these particles were unlikely to be related to the PSD. When graphing axo-dendritic position, the data was smoothed using a three-point weight running average. For all but the end points, yj(smoothed) = [y(j-1) + 2yj + y(j+1)]/4. For the end points, y1(smoothed) = (2y1 + y2)/3 and yn(smoothed) = [y(n-1) + 2yn]/3. The lateral position was normalized, to estimate the position of the particles along the PSD. This was computed using the following formula:
Thus, a value of 0 corresponds to a particle centered in the synapse; a value of 1.0 corresponds to a particle at the PSD edge. (For further details,see Kharazia et al, 1997 and Valtschanoff et al, 2001.) Data were collected in an Excel spreadsheet (Microsoft) for further analysis. DataDesk (Data Description, Ithaca, NY) and KaleidaGraph (Synergy Software, Reading, PA, USA) were used to compute statistics. CricketGraph (Computer Associates, Islandia, NY) was used to generate graphs and perform data smoothing.
Results
AIDA antibody characterization and biochemical distribution
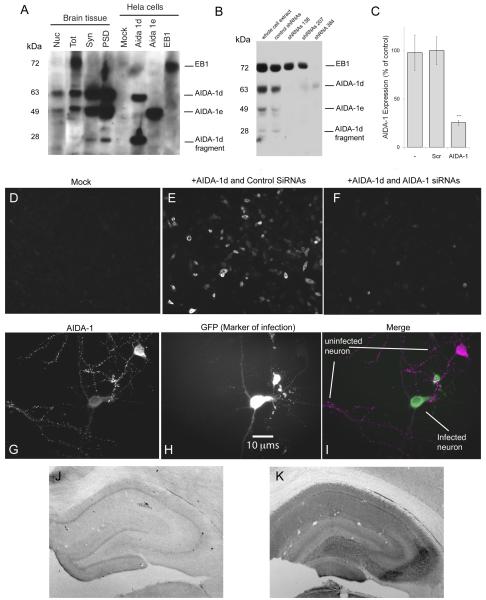
To confirm the specificity of this antibody, 10 μg of nuclear fraction, total lysate, synaptosomes, and postsynaptic densities were isolated from rat brains (Jordan et al., 2007) and subjected to SDS-PAGE (Fig 1A). Western blots showed staining for at least 4 different bands corresponding to different isoforms: AIDA-1d (~60 kDa and ~28 kDa), AIDA-1e (~49 kDa) and EB-1 (~72 kDa). The identities of these bands were confirmed by comparing the immunoreactivity in brain lysates to that observed in extracts from HeLa cells transfected with specific AIDA-1 isoforms. For further confirmation, we generated lentiviruses expressing AIDA-1-specific shRNAs, using the pTRIP vector system as described elsewhere (Janas et al., 2006). We generated 19 basepair shRNAs against sequences starting at bp 138, 207, and 384. Cultured hippocampal neurons (Jordan et al., 2007) infected at DIV 10, incubated for 7 days and then lysed, showed a nearly complete downregulation of most isoforms using shRNAs targeting bp 138 and 207 on AIDA-1d, and all isoforms with shRNAs targeting bp 384 (Fig 1B). The average downregulation observed by shRNA 384 was 74.5% ± 2.6 (Fig 1C). HEK-293T cells transfected with AIDA-1d and stained with the Zymed Ab showed no staining when co-tranfected with AIDA-1 specific siRNAs (Ambion; Austin, Texas; s232460), while HEK-293T cells co-transfected with AIDA-1d and control siRNAs stained prominently (Fig 1D-F). Primary hippocampal neurons infected with AIDA-1 specific shRNA 384 showed a marked reduction in AIDA-1 staining (Fig 1G-I). To confirm method specificity, we performed immunoperoxidase staining on brain sections without including the AIDA-1 antibody. Sections lacking this antibody showed very weak nonspecific staining (Fig 1J), while sections stained with the AIDA-1 antibody had high levels of staining (Fig 1K).
Fig 1.
Characterization of AIDA-1 antibody. The AIDA-1 antibody (Zymed, Invitrogen) was raised against a peptide conjugate corresponding to the sequence RLHDDPPQKPPRSIT at position 172 on AIDA-1. A: Western blot; the AIDA-1 antibody detected for at least 4 different bands corresponding to different AIDA-1 isoforms: 1d (~60 kDa and ~28 kDa), 1e (~49 kDa) and EB-1 (~72 kDa). Nuclei (Nuc) contained prominent bands corresponding to AIDA-1d and AIDA-1e; total lysate (Tot) contained prominent bands corresponding to EB-1, AIDA-1d, and AIDA-1e; and synaptosomes (Syn) and postsynaptic densities (PSD) contained prominent bands corresponding to AIDA-1d, AIDA-1e, and the AIDA-1d fragment. HeLa cells transfected with specific AIDA-1 isoforms confirmed identities of these bands. B: Lentivirus transfection with AIDA-1-specific shRNAs downregulated AIDA expression in cultured hippocampal neurons. ShRNAs targeting bp 138 and 207 on AIDA-1 downregulated 1d and 1e isoforms, while shRNA 384 downregulated all isoforms. C: shRNA 384 reduced expression by 74.5% ± 2.6 (AIDA-1) vs. nonspecific shRNA (SCR) (densitometry, N =8 gels, *** p-value < 0.001). No changes were observed for other markers (data not shown). D-F: HEK-293T cells mock-transfected displayed no staining (D). Cells cotransfected with AIDA-1d and control SiRNAs stained with the Zymed Ab (E), while cells cotranfected with AIDA- and AIDA-1 specific shRNAs showed very little staining (F). G-I: Div 14 hippocampal neurons infected with AIDA-1 specific shRNA 384 showed a marked reduction in AIDA-1 staining (I). AIDA-1 immunoreactivity in the infected (green, H) neuron is reduced in both soma and dendrites vs. an uninfected neuron (magenta, G). J-K: When primary antibody against AIDA-1 is omitted, immunoperoxidase staining in hippocampus is weak, exhibiting a nonspecific pattern (J). A section with primary antibody added displays high levels of staining (K). Contrast in J is greatly enhanced to increase visibility.
Light Microscopic Immunohistochemistry
We performed immunoperoxidase staining to assess the general organization of AIDA-1. Immunoreactivity was found throughout the brain, generally concentrating in gray matter and much weaker in white matter. Immunopositive neurons were scattered throughout the brain, standing out from diffusely stained neuropil. Staining was strong in forebrain, including hippocampus, cerebral cortex, and striatum, and in cerebellum; and weaker in brain stem and spinal cord.
The olfactory bulb had moderate overall levels of staining. The external plexiform layer and mitral cell layer had the strongest staining; some mitral cells contained prominently stained nuclei (Fig 2). The internal plexiform layer and the internal granule cell layer had modest staining, while glomeruli were more weakly stained than the matrix.
Fig 2.

Immunoperoxidase staining for AIDA-1 in olfactory bulb. The external plexiform layer (EPL) and mitral cell layer (MCL) had the strongest staining; some mitral cells contained stained nuclei. Staining was weaker in glomeruli (GL), internal plexiform layer (IPL), and internal granule cell layer (IGL) had modest staining. Scale bar = 250 μm.
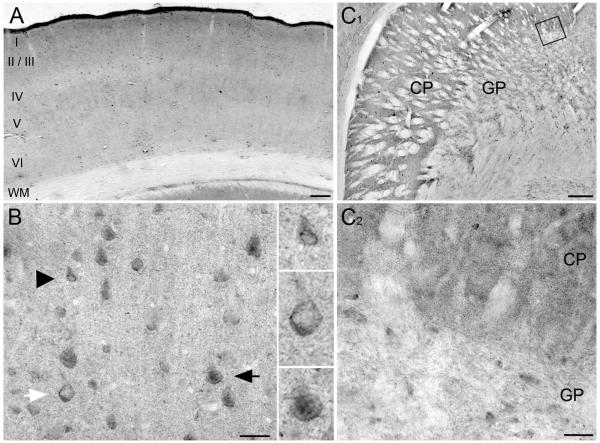
AIDA-1 staining extended throughout the layers of cerebral cortex, somewhat weaker in layer IV; no obvious differences in staining intensity were detected tangentially along the cortex (Fig 3A). Staining of somata seemed evenly distributed through the cell layers; the weaker staining in layer IV reflected a decrease in neuropil staining. AIDA-1 labeled some nuclei, but not all of them (Fig 3B). Staining often concentrated around the perimeter of nuclei (black arrowhead).
Fig 3.
Immunoperoxidase staining for AIDA-1 in cerebral cortex and striatum. A: Immunostaining for AIDA-1 in cerebral cortex. Staining is found throughout cortical layers, somewhat weaker in layer IV. No obvious differences in staining were detected tangentially. B: Higher magnification micrograph of cortex illustrates various patterns of cellular staining. Some nuclei stain for AIDA-1 (black arrow), while others lack AIDA-1 staining, though cytoplasm is stained (white arrow). In many neurons, staining is especially prominent along the nuclear border (black arrowhead). Immunopositive and negative nuclei are clearly visible at increased magnification (2x). C: In striatum, AIDA-1 is confined to the neuropil between fascicles of myelinated fibers. Staining is stronger in the caudate-putamen (CP) than the globus pallidus (GP). C1: Higher magnification view of boxed area in C; staining in neuropil appears punctate Scale bars: A = 250 μm, B = 40 μm, C = 250 μm, C1 = 40 μm.
Striatum exhibited strong neuropil staining, which was largely excluded from the fascicles of myelinated fibers. Staining was stronger in caudate-putamen than globus pallidus. Much of this staining was organized into small puncta, perhaps related to the spines of medium spiny cells in the caudate-putamen (Fig 3C-D).
In the hippocampus, staining for AIDA-1 was strong in areas with high concentrations of cell bodies, especially the pyramidal cell layer of Ammon’s horn, with weaker staining throughout the hippocampal formation (Fig 4A-B). Staining was especially prominent in large puncta in stratum lucidum of CA3, likely to correspond to the boutons of mossy fibers (Fig 4C).
Fig 4.

Immunoperoxidase staining for AIDA-1 in hippocampus. A: Low magnification view of the hippocampal formation. Pyramidal cells in Ammon’s horn stain for AIDA-1. Granule cells in dentate gyrus (DG) stain more weakly than pyramidal cells; note scattered darkly-stained interneurons. B: Higher magnification view of the boxed area in CA1 shows that AIDA-1 staining in both stratum oriens (SO) and stratum radiatum (SR) is organized into small puncta; note somatic staining within the pyramidal cell layer (PCL). C: Darkly-stained large puncta in stratum lucidum (SL) likely correspond to the mossy fiber connections between dentate gyrus and CA3. In contrast, staining in SO is diffuse, with tiny puncta. Prominent staining is visible in the pyramidal cell layer. Scale bars A = 500 μm; B, C = 50 μm.
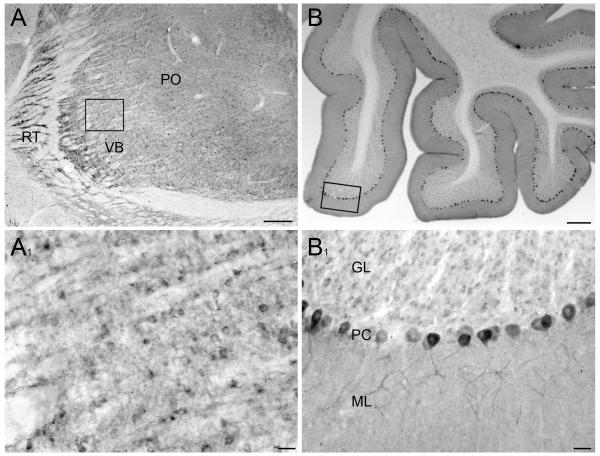
Staining was moderate in the thalamus, with little obvious distinction among thalamic nuclei (Fig 5A). Within cerebellum, Purkinje cells stained strongly for AIDA-1, with staining extending into the proximal dendritic arbor. Unlike most brain areas, the large majority of Purkinje cell nuclei were immunonegative (Fig 5B). Granule cells displayed low levels of staining, while moderate diffuse staining was seen in the molecular layer.
Fig 5.
Immunoperoxidase staining in thalamus and cerebellum A: Immunostaining within the thalamus. Moderate levels of staining were seen uniformly across most of the thalamus; the reticular thalamic (RT) nucleus and the lateral areas of the ventrobasal nucleus (VB) contained comparable staining levels. Slightly stronger staining is visible in the posterior nuclear complex (PO). A1: Higher magnification of the VPL revealed strongly stained cell bodies, whose nuclei were mostly devoid of staining. Diffuse staining is also visible. B: Immunostaining within cerebellum. Low magnification view of the cerebellum reveals strongly stained Purkinje neurons, a moderately stained molecular layer, and lightly stained granule cells. B1: At higher magnification, nuclei of Purkinje cells usually lack staining, although staining is visible in a few scattered neurons. Scale bars: A, B = 250 μm; A1, B1 = 50 μm.
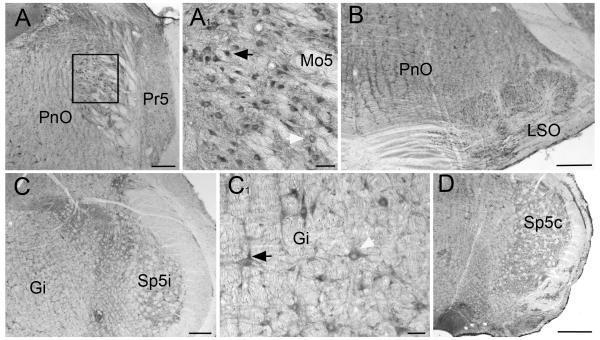
Overall, the brain stem stained more weakly than forebrain and cerebellum (Fig. 6). Superior and inferior colliculus, pons, and medulla generally exhibited relatively weak diffuse staining, although some areas stained more strongly. Strongly stained neurons were present in a number of regions. Prominent staining was observed in the red nucleus, pontine nucleus, and the ventral cochlear nucleus (not shown), in motoneurons of the motor trigeminal nucleus (Fig 6A1), neurons in the superior olivary complex (Fig 6B), and large neurons in the gigantocellular reticular nucleus (Fig 6C1). The nuclei of many, but not all, of the strongly-stained neurons were immunopositive.
Fig 6.
Staining in brain stem. Moderate levels of diffuse staining are present throughout brain stem. A: Pontine reticular nucleus (PnO) and principle sensory trigeminal nucleus (Pr5) have similar levels of diffuse staining. Neurons throughout these areas display somatic and nuclear staining. A1: Higher magnification view of motor trigeminal nucleus (Mo5) show well-stained motor neurons, some containing immunopositive nuclei (black arrowhead) whereas other nuclei are negative (white arrowhead). B: Field illustrates relatively strong immunostaining within the superior olivary complex (LSO). C: Section through rostral medulla. Diffuse staining is generally weak. C1: Higher magnification view of well-stained gigantocellular neurons (Gi); some containing immunopositive nuclei (black arrowhead), whereas other nuclei are negative (white arrowhead). D: Section through caudal medulla; note staining in spinal trigemial nucleus (Sp5c). Scale bars: A, B, C = 250 μm; A1, C1 = 50 μm; D = 500 μm.
The spinal cord displayed generally low levels of staining (Fig 7). Motoneurons in the ventral horn stained for AIDA-1, and many of these contained AIDA-1 positive nuclei. Pronounced diffuse staining was detected in the superficial dorsal horn.
Fig 7.
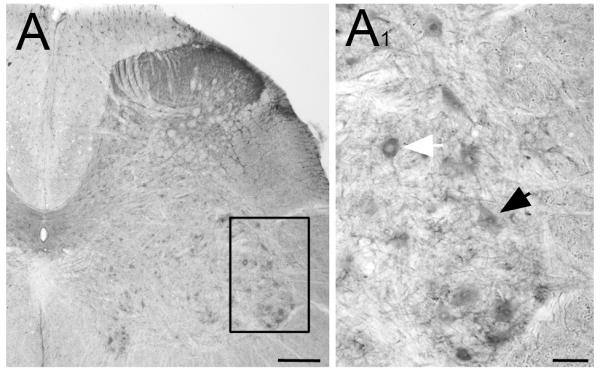
Immunoperoxidase staining in spinal cord. A: Low power magnification of the lumbar enlargement of spinal cord (L5). Diffuse staining is visible in the dorsal horn. A1: A higher magnification view of the ventral horn shows staining in motoneurons. Some contain immunopositive nuclei (black arrowhead), whereas other nuclei are negative (white arrowhead). Scale bars: A= 250 μm; A1 = 50 μm.
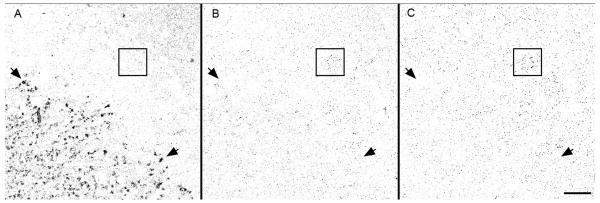
To assess the locus of staining at higher resolution, we performed high-resolution confocal microscopy on AIDA-1-stained sections, focusing on the cerebral cortex and hippocampus. In both cortex and hippocampus, immunofluorescent staining was organized into puncta of different sizes and subcellular locations, presumably representing distinct pools of AIDA-1. The pattern of staining varied with depth, presumably due to variable antibody penetration (Fig 8). At the section surface, the most prominent staining was diffuse or organized into numerous small puncta in the neuropil; this pattern dissipated rapidly with depth. A few μm beneath the surface, staining was largely confined to large puncta associated with cell bodies.
Fig 8.
Confocal images of AIDA-1 immunofluorescence in CA3 hippocampus; optical sections illustrate how immunolabel varies with depth. Gray scale has been inverted to improve visibility. A: At the surface, staining is present in large puncta in stratum lucidum (arrows), while staining in the pyramidal cell layer is very weak. At 2.5 μm (B) and 5 μm (C) below surface, mossy fiber staining is barely detectable, whereas somatic staining becomes more obvious (open box). Scale bar = 20 μm.
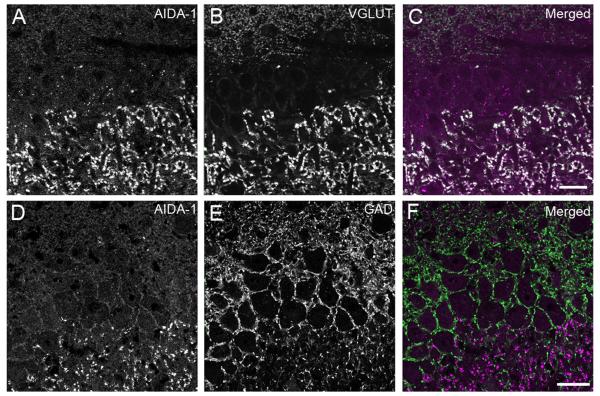
The most prominent staining was in stratum lucidum of CA3, which contained numerous very large puncta. To clarify the nature of these puncta, sections were stained with AIDA-1 and either VGLUT1 (a presynaptic excitatory marker) or GAD-65 (a presynaptic inhibitory marker). AIDA-1 colocalized with VGLUT1 in large puncta, but showed little colocalization with GAD-65 (Fig 9), suggesting that AIDA-1 concentrates in the excitatory terminations of mossy fibers onto the thorny excrescences of CA3 neurons.
Fig 9.
Double-label immunofluorescence in hippocampal CA3. A, B, C: Double labeling for AIDA-1 (A) and VGLUT1 (B). C superimposes the AIDA-1 channel (magenta) and the VGLUT1 channel (green). Colocalization is apparent in large puncta in stratum lucidum. D, E, F: Double labeling with AIDA-1 (D) and GAD-65 (E). F superimposes the AIDA-1 channel (magenta) and the VGLUT1 channel (green), where little evidence of colocalization can be seen. Slight bleedthrough of GAD-65 in the left panel outlines the cell bodies. These images were collected from the section surface: therefore, cytoplasmic/nuclear AIDA-1 is not clearly visible (compare Fig 8). Scale bar = 20 μm.
Another population of AIDA-1 puncta (best defined 3-5 μm beneath the surface of the section) lay within nuclei of neurons. Z series confocal stacks were acquired to ensure that staining was within the nucleus, and not restricted to the nuclear border. Nuclei generally were either essentially devoid of AIDA-1 staining, or contained many large puncta throughout each optical section (Fig 10). These were present in both excitatory and inhibitory cells. This staining was usually excluded from nucleoli, although AIDA-1 puncta occasionally lay adjacent to nucleoli.
Fig 10.
Expression of AIDA-1 in the nucleus. Confocal image of AIDA-1 staining (red) within the pyramidal cell layer of CA1 (A) and layer 5 of cerebral cortex (B); DAPI counterstain (blue) identifies nuclei. In many cells, large AIDA-1 puncta distribute throughout the nucleus, but these are generally absent from nucleoli. White arrowheads indicate nuclei containing prominent AIDA-1 puncta; white arrow points to nucleus containing little AIDA-1. Large AIDA-1 puncta outside nuclei are likely to lie within somatic cytoplasm. Smaller AIDA-1 puncta seen throughout the section may represent synaptic staining. C, D: Graphs showing the number of large puncta in nuclei in hippocampus (left) and cerebral cortex (right). Staining is bimodal; nuclei generally contain either very few or many large puncta. E: Confocal image of AIDA-1 staining (red) and granule cell nuclei (blue) in dentate gyrus. Tight packing of cells did not allow for further analysis, but both AIDA-1 positive (white arrowhead) and negative (white arrow) nuclei are visible. Scale bars = 10 μm.
In both cerebral cortex and hippocampus, nuclei generally contained either ten or more of these large puncta, or none (Fig 10C-D). We therefore dichotomized nuclei into “positive” and “negative” populations, defining immunopositive nuclei as those containing ≥5 large puncta in the nucleus in a given optical section. In cerebral cortex, 55% of nuclei (78/142) were immunopositive. The prevalence of nuclear staining was relatively constant through the layers of cortex; 57% of nuclei (36/63) in layer 2/3 were immunopositive, and 54% (45/82) in layer 4/5. The prevalence of nuclear staining in hippocampus was similar: 61% of nuclei (45/73) in CA1 and 56% in CA3 (37/66) were immunopositive. We conclude that AIDA-1 is expressed at substantial levels in ~ 60% of the nuclei of neurons throughout cerebral cortex and Ammon’s horn. Due to tight packing of cells, we were unable to perform quantitative analysis of nuclei within dentate gyrus, but it was apparent that both positive and negative nuclei were common.
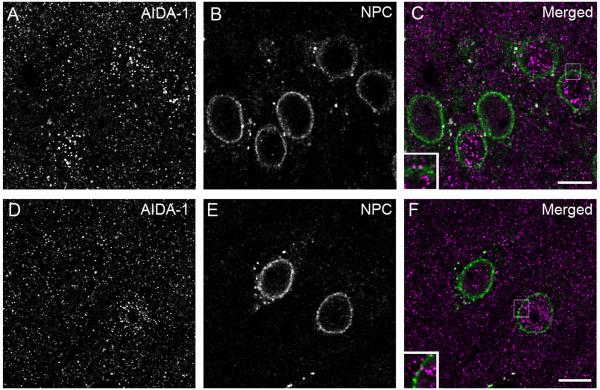
AIDA-1 puncta could also be seen in the cytoplasm, especially near the nuclear border. Confocal microscopic analysis of double staining with AIDA-1 and NPC (a core protein of the nuclear pore complex) showed large AIDA-1 puncta associated with the nuclear membrane, with immunopositive nuclei exhibiting more nuclear envelope-associated puncta (Fig 11). Assessing staining 3-6 μm beneath the section surface, AIDA-1-positive nuclei in the hippocampus had 2.8 ± 0.2 nuclear envelope-associated puncta (n=82), while nuclei lacking AIDA-1 had 2.0 ± 0.2 puncta (n=55). Cerebral cortex exhibited a similar relationship, with positive nuclei having 1.9 ± 0.2 puncta (n=81) and nuclei lacking AIDA-1 having 1.3 ± 0.2 nuclear envelope-associated puncta (n=64).
Fig 11.
Expression of AIDA-1 at the nuclear membrane. Confocal images of material double-stained for AIDA-1 (left panels) and the nuclear pore complex (NPC, middle panels). The right panels merge the AIDA-1 channel (magenta) and the NPC channel (green). Some AIDA-1 puncta lie adjacent to the nuclear membrane in hippocampus (A, B, C) and cerebral cortex (D, E, F). Note that AIDA-1-positive nuclei generally exhibit more NPC-associated puncta. Small boxes in the right panels are enlargements, illustrating AIDA-1 puncta close to the nuclear membrane. Scale bar = 10 μm.
Ultrastructural Observations
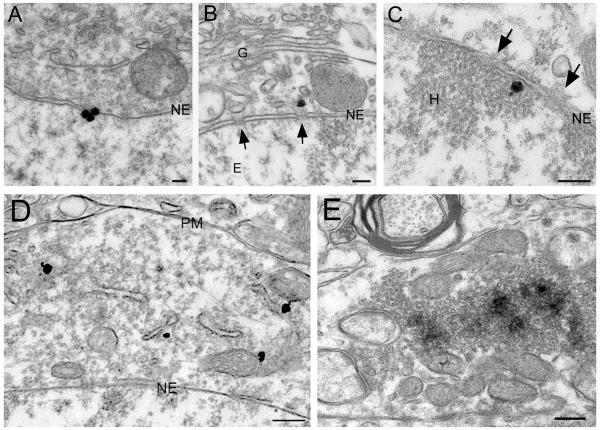
To gain a clearer understanding of its subcellular organization, we performed immunoelectron microscopy for AIDA-1 in hippocampus. Pre-embedding immunogold staining revealed silver-enhanced gold particles associated with the nuclear envelope and nuclear pores, on both cytoplasmic and nuclear surfaces (Fig 12A-C). Cytoplasmic staining was also observed, often associated with intracellular membranes (Fig 12D).
Fig 12.
Pre-embedding immunostaining for AIDA-1. A-C: AIDA-1 associated with nuclear pores and the nuclear membrane. Silver-enhanced gold particles coding for AIDA-1 are at the nuclear membrane (A); some lie directly outside (B) and inside (C) nuclear pores (arrows). D: Immunogold particles in the cytoplasm, often associated with endomembranes. E: Electron-dense DAB reaction product shows staining of AIDA-1 in mossy fiber terminals. Staining typically concentrates in the middle of vesicle pools. Abbreviations: G, Golgi apparatus; NE, nuclear envelope; E, euchromatin; H, heterochromatin; PM, plasma membrane. Scale bars: A-C = 100 nm; D-E = 250 nm.
Pre-embedding immunoperoxidase showed AIDA-1 staining in mossy fiber terminals (Fig 12E); staining concentrated at the center of vesicle pools and was seldom seen close to the plasma membrane. A similar pattern of staining in mossy fibers was seen with immunogold in postembedded material (data not shown). In contrast, presynaptic terminals in CA1 did not share this high level of expression. However, mossy fibers terminals are exceptionally large. To explore whether the difference in size could explain the observed difference in presynaptic label, we computed staining density over vesicle pools in both CA1 and CA3. Staining in CA3 synapses proved to be 4 times denser than in CA1 synapses, confirming our qualitative impression that the difference is not merely an artifact arising from the size of mossy fibers.
We seldom observed labeling associated with the postsynaptic specialization in pre-embedding material, but pre-embedding techniques often fail to detect antigens in the PSD, presumably due to the poor penetration of antibodies into this protein-dense compartment. Therefore, we performed postembedding immunogold labeling on tissue processed with freeze-substitution techniques. As with pre-embedding, staining was prominent along the nuclear envelope and within mossy fiber terminals was prominent, but synaptic staining was especially conspicuous, concentrating at the PSD (Fig 13A-C). Approximately 37% of asymmetric excitatory synapses (174/467) in the CA1 region of the hippocampus and 26% of excitatory synapses within cerebral cortex (40/150) displayed immunogold labeling. In contrast, labeling was uncommon in the molecular layer of cerebellar cortex, where only 6% (15/235) of synapses labeled.
Fig 13.
Postembedding immunogold staining for AIDA-1. A-C: Electron micrographs show immunogold labeling for AIDA-1; note association of particles with the PSD. Scale bars = 100 nm. D: Graph showing the “axo-dendritic” position of AIDA-1 labeling. Only particles within the width of the PSD were counted (see Methods for details). AIDA-1 concentrates postsynaptically, centered over the external part of the PSD. E: Graph showing the “lateral” distribution of AIDA-1. Only particles between −50 to +75 nm from the postsynaptic membrane were counted. To pool data, position was normalized: 0 corresponds to the PSD edge and 1 corresponds to the PSD center (see methods for details). AIDA-1 distributes fairly uniformly along the PSD, decreasing rapidly at its edge. Very little labeling is associated with the spine plasma membrane away from the synaptic specialization.
We performed quantitative analysis of postembedding immunogold material in hippocampus, to determine the position of gold particles in relation to the synaptic cleft, and found that AIDA-1 was closely associated with the PSD. To analyze antigen position in relation to the PSD, gold particles more than 25 nm beyond the lateral ends of the PSD were ignored. For this subgroup, particles coding for AIDA-1 lay at a mean distance of 13 ± 2 nm from the postsynaptic plasma membrane (n = 334). Particles clustered into a peak −20 to 50 nm from the membrane, resembling a Gaussian distribution with an added cytoplasmic tail (Fig 13D). In the tangential axis, particles far from the postsynaptic membrane (< −50 or > 75 nm away) were ignored, since these particles were unlikely to be related to the PSD. Labeling distributed fairly uniformly along the PSD, rapidly dropping off at its edge (Fig. 13E).
Discussion
Synaptic activity is linked to transcription via a variety of signals that translocate from the synapse to the nucleus (Deisseroth et al., 2003; West et al., 2002). Ca2+ from the synapse can spread into to the nucleus and directly activate the transcription factor DREAM (downstream regulatory element antagonist modulator, Osawa et al., 2001). Alternatively, Ca2+ can bind to calmodulin at synapses to trigger nuclear translocation of calmodulin and other downstream signals that activate CREB (cAMP response element binding; Deisseroth et al., 1996; Deisseroth et al., 1998; Dolmetch et al., 2001). Several transcription factors have been shown to travel from the synapse to the nucleus, where they can modulate gene expression (Graef et al., 1999; Kaltcshmidt et al., 1995; Lai et al., 2008). AIDA-1 uses a different strategy: after being cleaved at the PSD, the AIDA-1 fragment containing a nuclear localization sequence translocates to the nucleus (Jordan et al., 2007).
High levels of AIDA-1 have been reported in biochemically-isolated PSD fractions (Yoshimura et al., 2004, Peng et al., 2004, Jordan et al., 2004), but little information is available concerning its anatomical localization. Our study in adult rat brain reveals strong staining in forebrain regions rich in spiny dendrites containing excitatory synapses. Staining difference in striatum are noteworthy; caudate-putamen, which contains many excitatory synaptic connections on spiny neurons, exhibits stronger staining than globus pallidus, which contains inhibitory connections from the caudate-putamen (Gerfen et al.,1988; Difiglia et al., 1988).
Purkinje cells stained prominently for AIDA-1. This was unexpected, since Western blot failed to detect AIDA-1 in biochemically-isolated PSDs from cerebellum (Jordan et al., 2007). Likewise, in the present study we found that synapses in cerebellar cortex were only seldom immunopositive for AIDA-1. Multiple splice variants of AIDA-1 have been identified (Ghersi, Noviello et al., 2004;.Ghersi, Vito, et al., 2004; Xu et al., 2005), and these may exhibit different staining patterns. For example, AIDA-1a, but not AIDA1b, is found in nuclei of transfected HeLa cells (Ghersi, Noviello et al., 2004). Likewise, our biochemical data (Fig. 1) suggest differential subcellular expression patterns for different splice variants. We speculate that different splice variants may play distinct functional roles. Synapses of Purkinje cells were seldom labeled, and their nuclei were seldom immunostained, leading us to suggest that AIDA-1 staining in cerebellum represents some isoform not involved in synapse-to-nucleus signaling.
In hippocampus, AIDA-1 was found in a large fraction of excitatory synapses. Within CA1 synapses, AIDA-1 concentrated centrally within PSDs, the same general location previously reported for both PSD-95 and NR2A/B (Valtschanoff et al., 2001). Co-immunoprecipitation experiments have shown that AIDA-1 binds to PSD-95 and associates with NMDARs (Jordan et al., 2007). The present data suggest that AIDA-1 forms similar signaling complexes in vivo. Mossy fiber synapses within CA3 display a strikingly different pattern; AIDA-1 in these synapses associated with vesicle pools. Thus, the pattern of AIDA-1 staining within distinct areas of hippocampus correlates with the locus of LTP expression: AIDA-1 is postsynaptic within synapses that exhibit NMDAR-dependent postsynaptic LTP, and presynaptic in synapses expressing NMDAR-independent presynaptic LTP (Malenka et al., 1999; Nicoll et al., 2005). We suggest that AIDA-1 may serve as a link between synapses and nuclei in both these areas, despite the functional difference in LTP induction and expression.
In our study, more than half of nuclei contained large AIDA-1 puncta in cerebral cortex and hippocampus, in contrast to dissociated hippocampal neuron cultures, where only 15%-20% of nuclei were AIDA-1 positive under basal conditions. This quantitative discrepancy may reflect higher levels of neuronal activity in vivo, since NMDAR activation greatly increased the fraction of cultured neurons with AIDA-1 positive nuclei. Previous in vitro work showed that NMDAR activation caused AIDA-1 to enter the nucleus and stabilize connections between Cajal bodies and nucleoli. This connection may promote mRNA synthesis, leading to increased protein translation (Jordan et al., 2007). In our study, nucleolar AIDA-1 staining was infrequant, but our data do not directly question the hypothesis that AIDA-1 promotes Cajal body/nucleolar interactions; AIDA-1 staining was seen at nucleolar borders in our material. However, the more obvious staining we detected at the nuclear membrane, often in association with the nuclear pore complex (NPC), suggests another mechanism of action. The NPC, a large multimeric assembly of proteins, serves as “gatekeeper” that mediates signals into the nucleus (Schwartz, 2005; D’Angelo et al., 2008). Staining of AIDA-1 at nuclear pores could indicate trafficking of AIDA-1 into the nucleus; however, even in the absence of nuclear AIDA-1 staining, AIDA-1 puncta were found along the nuclear border. We speculate that AIDA-binding at NPC may help to regulate nuclear/cytoplasmic trafficking.
Acknowledgments
The authors thank Kristen Phend for histological support, Alain Burette for valuable comments on a draft of the manuscript and Edward Ziff for advice and support.
Grant Sponsor: K01 MH073759 to B.A.J, NS 39444 to R.J.W, and R01 MH67229 to Edward B. Ziff
References
- Abraham WC, Williams JM. LTP maintenance and its protein synthesis-dependence. Neurobiol Learn Mem. 2008;89:260–268. doi: 10.1016/j.nlm.2007.10.001. [DOI] [PubMed] [Google Scholar]
- Belichenko PV, Kleschevnikov AM, Masliah E, Wu C, Takimoto-Kimura R, Salehi A, Mobley WC. Excitatory-inhibitory relationship in the fascia dentata in the Ts65Dn mouse model of Down syndrome. J Comp Neurol. 2009;512:453–66. doi: 10.1002/cne.21895. [DOI] [PMC free article] [PubMed] [Google Scholar]
- Calixto E, Thiels E, Klann E, Barrionuevo G. Early maintenance of hippocampal mossy fiber--long-term potentiation depends on protein and RNA synthesis and presynaptic granule cell integrity. J Neurosci. 2003;23:4842–4849. doi: 10.1523/JNEUROSCI.23-12-04842.2003. [DOI] [PMC free article] [PubMed] [Google Scholar]
- Chang YC, Gottlieb DI. Characterization of the proteins purified with monoclonal antibodies to glutamic acid decarboxylase. J Neurosci. 1988;8:2123–2130. doi: 10.1523/JNEUROSCI.08-06-02123.1988. [DOI] [PMC free article] [PubMed] [Google Scholar]
- D’Angelo MA, Hetzer MW. Structure, dynamics and function of nuclear pore complexes. Trends Cell Biol. 2008;18:456–466. doi: 10.1016/j.tcb.2008.07.009. [DOI] [PMC free article] [PubMed] [Google Scholar]
- Davis LI, Blobel G. Identification and characterization of nuclear pore complex protein. Cell. 1986;45:699–709. doi: 10.1016/0092-8674(86)90784-1. [DOI] [PubMed] [Google Scholar]
- Deisseroth K, Bito H, Tsien RW. Signaling from synapse to nucleus: postsynaptic CREB phosphorylation during multiple forms of hippocampal synaptic plasticity. Neuron. 1996;16:89–101. doi: 10.1016/s0896-6273(00)80026-4. [DOI] [PubMed] [Google Scholar]
- Deisseroth K, Heist EK, Tsien RW. Translocation of calmodulin to the nucleus supports CREB phosphorylation in hippocampal neurons. Nature. 1998;392:198–202. doi: 10.1038/32448. [DOI] [PubMed] [Google Scholar]
- Deisseroth K, Mermelstein PG, Xia H, Tsien RW. Signaling from synapse to nucleus: the logic behind the mechanisms. Curr Opin Neurobiol. 2003;13:354–65. doi: 10.1016/s0959-4388(03)00076-x. [DOI] [PubMed] [Google Scholar]
- Difiglia M, Pasik P, Pasik T. A Golgi and ultrastructural study of the monkey globus pallidus. J Comp Neurol. 1982;212:53–75. doi: 10.1002/cne.902120105. [DOI] [PubMed] [Google Scholar]
- Dolmetsch RE, Pajvani U, Fife K, Spotts JM, Greenberg ME. Signaling to the nucleus by an L-type calcium channel-calmodulin complex through the MAP kinase pathway. Science. 2001;294:333–9. doi: 10.1126/science.1063395. [DOI] [PubMed] [Google Scholar]
- Duyckaerts C, Delatour B, Potier MC. Classification and basic pathology of Alzheimer disease. Acta Neuropathol. 2009;118:5–36. doi: 10.1007/s00401-009-0532-1. [DOI] [PubMed] [Google Scholar]
- Frey U, Krug M, Brodemann R, Reymann K, Matthies H. Long-term potentiation induced in dendrites separated from rat’s CA1 pyramidal somata does not establish a late phase. Neuroscience Letters. 1989;97:135–39. doi: 10.1016/0304-3940(89)90152-3. [DOI] [PubMed] [Google Scholar]
- Gerfen CR. Synaptic organization of the striatum. J Electron Microsc Tech. 1988;10:265–281. doi: 10.1002/jemt.1060100305. [DOI] [PubMed] [Google Scholar]
- Ghersi E, Noviello C, D’Adamio L. Amyloid-beta protein precursor (AβPP) intracellular domain-associated protein-1 proteins bind to AbetaPP and modulate its processing in an isoform-specific manner. J Biol Chem. 2004;279:49105–49112. doi: 10.1074/jbc.M405329200. [DOI] [PubMed] [Google Scholar]
- Ghersi E, Vito P, Lopez P, Abdallah M, D’Adamio L. The intracellular localization of amyloid beta protein precursor (AβPP) intracellular domain associated protein-1 (AIDA-1) is regulated by AbetaPP and alternative splicing. J Alzheimers Dis. 2004;6:67–78. doi: 10.3233/jad-2004-6108. [DOI] [PubMed] [Google Scholar]
- Hamid R, Kilger E, Willem M, Vassallo N, Kostka M, Bornhövd C, Reichert AS, Kretzschmar HA, Haass C, Herms J. Amyloid precursor protein intracellular domain modulates cellular calcium homeostasis and ATP content. J Neurochem. 2007;102:1264–1267. doi: 10.1111/j.1471-4159.2007.04627.x. [DOI] [PubMed] [Google Scholar]
- Janas J, Skowronski J, Van Aelst L. Lentiviral delivery of RNAi in hippocampal neurons. Methods Enzymol. 2006;406:593–605. doi: 10.1016/S0076-6879(06)06046-0. [DOI] [PubMed] [Google Scholar]
- Jordan BA, Fernholz BD, Boussac M, Xu C, Grigorean G, Ziff EB, Neubert TA. Identification and verification of novel rodent postsynaptic density proteins. Mol Cell Proteomics. 2004;3:857–871. doi: 10.1074/mcp.M400045-MCP200. [DOI] [PubMed] [Google Scholar]
- Jordan BA, Fernholz BD, Khatri L, Ziff EB. Activity-dependent AIDA-1 nuclear signaling regulates nucleolar numbers and protein synthesis in neurons. Nat Neurosci. 2007;10:427–35. doi: 10.1038/nn1867. [DOI] [PubMed] [Google Scholar]
- Kaltschmidt C, Kaltschmidt B, Baeuerle PA. Stimulation of ionotrophic glutamate receptors activate transcription factor NF-kappa B in primary neurons. Proc Natl Acad Sci U S A. 1995;10:9618–9622. doi: 10.1073/pnas.92.21.9618. [DOI] [PMC free article] [PubMed] [Google Scholar]
- Kharazia VN, Weinberg RJ. Tangential synaptic distribution of NMDA and AMPA receptors in rat neocortex. Neurosci Lett. 1997;238:41–44. doi: 10.1016/s0304-3940(97)00846-x. [DOI] [PubMed] [Google Scholar]
- Krug M, Lössner B, Ott T. Anisomycin blocks the late phase of long-term potentiation in the dentate gyrus of freely moving rats. Brain Res Bull. 1984;13:39–42. doi: 10.1016/0361-9230(84)90005-4. [DOI] [PubMed] [Google Scholar]
- Kurabi A, Brener S, Mobil M, Kwan JJ, Donaldson LW. A nuclear localization signal at the SAM-SAM domain interface of AIDA-1 suggests a requirement for domain uncoupling prior to nuclear transport. J Mol Biol. 2009;392:1168–77. doi: 10.1016/j.jmb.2009.08.004. [DOI] [PubMed] [Google Scholar]
- Lai KO, Zhao Y, Ch’ng TH, Martin KC. Importin-mediated retrograde transport of CREB2 from distal processes to the nucleus in neurons. Proc Natl Acad Sci U S A. 2008;105:17175–17180. doi: 10.1073/pnas.0803906105. [DOI] [PMC free article] [PubMed] [Google Scholar]
- Malenka RC, Nicoll RA. Long-Term potentiation – a decade of progress? Science. 1999;285:1870–1874. doi: 10.1126/science.285.5435.1870. [DOI] [PubMed] [Google Scholar]
- McBain CJ. Differential mechanisms of transmission and plasticity at mossy fiber synapses. Prog Brain Res. 2008;169:225–240. doi: 10.1016/S0079-6123(07)00013-1. [DOI] [PMC free article] [PubMed] [Google Scholar]
- Melone M, Burette A, Weinberg RJ. Light microscopic identification and immunocytochemical characterization of glutamatergic synapses in brain sections. J Comp Neurol. 2005;492:495–509. doi: 10.1002/cne.20743. [DOI] [PubMed] [Google Scholar]
- Mi R, Tang X, Sutter R, Xu D, Worley P, O’Brian RJ. Differing mechanisms for glutamate receptor aggregation on dendritic spines and shafts in cultured hippocampal neruons. J Neurosci. 2002;22:7606–7616. doi: 10.1523/JNEUROSCI.22-17-07606.2002. [DOI] [PMC free article] [PubMed] [Google Scholar]
- Müller T, Meyer HE, Egensperger R, Marcus K. The amyloid precursor protein intracellular domain (AICD) as modulator of gene expression, apoptosis, and cytoskeletal dynamics-relevance for Alzheimer’s disease. Prog Neurobiol. 2008;85:393–406. doi: 10.1016/j.pneurobio.2008.05.002. [DOI] [PubMed] [Google Scholar]
- Nicoll RA, Schmitz D. Synaptic plasticity at hippocampal mossy fibre synapses. Nat Rev Neurosci. 2005;6:863–876. doi: 10.1038/nrn1786. [DOI] [PubMed] [Google Scholar]
- Nguyen PV, Abel T, Kandel ER. Requirement of a critical period of transcription for induction of late phase LTP. Science. 1994;265:1104–1107. doi: 10.1126/science.8066450. [DOI] [PubMed] [Google Scholar]
- Okabe S. Molecular anatomy of the postsynaptic density. Mol Cell Neurosci. 2007;34:503–518. doi: 10.1016/j.mcn.2007.01.006. [DOI] [PubMed] [Google Scholar]
- Osawa M, Tong KI, Lilliehook C, Wasco W, Buxbaum JD, Cheng HY, Penniger JM, Ikura M, Ames JB. Calcium-regulated DNA binding and oligomerization of the neuronal calcium-sensing protein, calsenilin/DREAM/KChIP3. J Biol Chem. 2001;276:41005–41013. doi: 10.1074/jbc.M105842200. [DOI] [PubMed] [Google Scholar]
- Peng J, Kim MJ, Cheng D, Duong DM, Gygi SP, Sheng M. Semi-quantitative proteomic analysis of rat forebrain postsynaptic density fractions by mass spectrometry. J Biol Chem. 2004;279:21003–21011. doi: 10.1074/jbc.M400103200. [DOI] [PubMed] [Google Scholar]
- Reymann KG, Frey J. The late maintenance of hippocampal LTP: requirements, phases, ‘synaptic tagging’, ‘late-associativity’ and implications. Neuropharmacology. 2007;52:24–40. doi: 10.1016/j.neuropharm.2006.07.026. [DOI] [PubMed] [Google Scholar]
- Schuman EM, Dynes JL, Steward O. Synaptic regulation of translation of dendritic mRNAs. J Neurosci. 2006;26:7143–7146. doi: 10.1523/JNEUROSCI.1796-06.2006. [DOI] [PMC free article] [PubMed] [Google Scholar]
- Schwartz TU. Modularity within the architecture of the nuclear pore complex. Curr Opin Struct Biol. 2005;15:221–226. doi: 10.1016/j.sbi.2005.03.003. [DOI] [PubMed] [Google Scholar]
- Sheng M, Hoogenraad CC. The postsynaptic architecture of excitatory synapses: a more quantitative view. Annu Rev Biochem. 2007;76:823–847. doi: 10.1146/annurev.biochem.76.060805.160029. [DOI] [PubMed] [Google Scholar]
- Skup M. Dendrites as separate compartment - local protein synthesis. Acta Neurobiol Exp. 2008;68:305–321. doi: 10.55782/ane-2008-1697. [DOI] [PubMed] [Google Scholar]
- Slomnicki LP, Lesniak W. A putative role of the amyloid precursor protein intracellular domain (AICD) in transcription. Acta Neurobiol Exp (Wars) 2008;68:219–228. doi: 10.55782/ane-2008-1691. [DOI] [PubMed] [Google Scholar]
- Swanwick CC, Murthy NR, Mtchedlishvili Z, Sieghart W, Kapur J. Development of g-aminobutyric acidergic synapses in cultured hippocampal neurons. J Comp Neurol. 2006;495:497–510. doi: 10.1002/cne.20897. [DOI] [PMC free article] [PubMed] [Google Scholar]
- Valtschanoff JG, Weinberg RJ. Laminar organization of the NMDA receptor complex within the postsynaptic density. J Neurosci. 2001;21:1211–1217. doi: 10.1523/JNEUROSCI.21-04-01211.2001. [DOI] [PMC free article] [PubMed] [Google Scholar]
- West AE, Griffith EC, Greenberg ME. Regulation of transcription factors by neuronal activity. Nat Rev Neurosic. 2002;3:921–931. doi: 10.1038/nrn987. [DOI] [PubMed] [Google Scholar]
- Xu H, Hebert MD. A novel EB-1/AIDA-1 isoform, AIDA-1c, interacts with the Cajal body protein coilin. BMC Cell Biology. 2005;6:23. doi: 10.1186/1471-2121-6-23. [DOI] [PMC free article] [PubMed] [Google Scholar]
- Yoshimura Y, Yamauchi Y, Shinkawa T, Taoka M, Donai H, Takahashi N, Isobe T, Yamauchi T. Molecular constituents of the postsynaptic density fraction revealed by proteomic analysis using multidimensional liquid chromatography-tandem mass spectrometery. J Neurochem. 2004;88:759–768. doi: 10.1046/j.1471-4159.2003.02136.x. [DOI] [PubMed] [Google Scholar]
- Ziff EB. Enlightening the postsynaptic density. Neuron. 1997;19:1163–1174. doi: 10.1016/s0896-6273(00)80409-2. [DOI] [PubMed] [Google Scholar]


