Abstract
Various nanoscale elements are currently being explored for bio-applications, such as in bio-images, bio-detection, and bio-sensors. Among them, nanodiamonds possess remarkable features such as low bio-cytotoxicity, good optical property in fluorescent and Raman spectra, and good photostability for bio-applications. In this work, we devise techniques to position functionalized nanodiamonds on self-assembled monolayer (SAMs) arrays adsorbed on silicon and ITO substrates surface using electron beam lithography techniques. The nanodiamond arrays were functionalized with lysozyme to target a certain biomolecule or protein specifically. The optical properties of the nanodiamond-protein complex arrays were characterized by a high throughput confocal microscope. The synthesized nanodiamond-lysozyme complex arrays were found to still retain their functionality in interacting with E. coli.
Keywords: Nanodiamond, Biosensor, Self-assembled monolayer
Introduction
With recent developments in nanobioscience and nanobiotechnology, nanomaterials (e.g., carbon nanotubes, fullerenes, quantum dots, and nanodiamonds (ND)) have been receiving increased attention [1]. Quantum dots have specifically been applied in fluorescent probes in recent years. However, there are concerns on their bio-cytotoxicity. In comparison, nanodiamonds possess remarkable features of low bio-cytotoxicity and good optical property for bio-applications. Schrand et al. [2] demonstrated that nanodiamonds, with and without surface modification by acid or base, are biocompatible with a variety of cells of different origins. Cells grown on ND-coated substrate show sustained viability over time. NDs are rapidly emerging as promising carriers for next-generation therapeutics and drug delivery. Therefore, it is envisaged that nanodiamonds can serve as good drug carriers, image probes, or implant coatings in biological systems [3-13]. However, developing future nanoscale devices and arrays that harness these nanoparticles will require unprecedented spatial control.
The Raman and photoluminescence properties of nanodiamonds have been intensively studied [14-17]. Core-level photoabsorption has been used to determine the sp2 and sp3 bonding content of nanocrystalline diamond thin film [18]. Extensive Raman and FTIR studies have been reported [19] on nanodiamond powders. Some intrinsic Raman signals can be used as detection markers or can be employed in biological objects. The major Raman peak of diamonds is located at 1,332 cm−1 for the SP3 bonding of carbons. This diamond Raman peak is strong and isolated, so it can be used as an indicator for allocating nanodiamonds. Functionalized diamond films and nanodiamonds (carboxylation or oxidation) facilitate chemical or physical conjugation with biomolecules [18,20-23]. For the aforementioned reasons, functionalized nanodiamonds can be used as bio-labeling materials. If techniques to single out, position, and allocate a single bio-labeled nanodiamond can be developed, the creation of a single nanodiamond that can serve as a platform for observing molecular-molecular interactions via optical means (Raman and/or photoluminescence spectroscopy techniques) can be made.
In this report, we demonstrated techniques to single out, position, and allocate nanodiamond arrays on silicon substrates. Nanodiamond arrays absorb lysozyme and form nanodiamond-lysozyme complex arrays [24,25]. The optical properties of the nanodiamond-lysozyme complex arrays were characterized by a high throughput confocal microscope, and the functionality of the complex was tested with E. coli.
Experimental
The nanodiamond powder used in this study is commercially available (GE Diamond Company), and the samples were produced under high pressure and high temperature (HPHT) conditions. The nanoparticles have an average size of about 100 nm with a size distribution within ±20%, which was confirmed by SEM. In order to well disperse the nanodiamonds, they were treated with a 5:1 mixture of concentrated H2SO4 and HNO3 solutions at 75°C for 6 h, and extensively rinsed several times with DI water. The solution was placed in an ultrasonic bath operated at a vibration frequency of 185 kHz for 30 min to prevent the formation of the nanodiamond clusters. It may be due to the acoustic cavitation effect [26,27] so that the ultrasonic wave heats up the water and breaks the water molecules into H+ and OH− ions. The OH− ions attach onto the nanodiamond surface and induce a Coulomb repulsion force between nanoparticles. Therefore, the clustering of nanodiamonds can be avoided. A test drop of the solution is placed on a bare Si wafer and, after the solution dries out, the scanning electron microscope (SEM) and transmission electron (TEM) images are taken to examine the clustering of the nanodiamond. The concentration of the solution is continuously adjusted until the nanoparticles can be well dispersed on the template. The sediment was then collected and dried. The functional COOH groups, which are commonly used for conjugation with biomolecules, were formed on the ND surface followed by the standard chemical treatment mentioned in Ref. [28,29]. Formation of the COOH group was further confirmed through IR absorption measurements. The oxidative acid-treated ND surfaces contain ~7% of COOH carboxyl groups. It should be noted that this amount of surface carboxyl groups is sufficient for ensuing bio-conjugation [30,31].
A silicon wafer was first diced into 15 × 15 mm chips. A silicon oxide layer was grown on the silicon chips with a thickness of about 400 nm by using PECVD. The substrate was first cleaned with ultrasonic bath in acetone, isopropyl alcohol, and DI water solution for 5 min. Then, the ZEP520 photoresist was spin-coated on the silicon oxide substrates at a rate of 500 rpm for 10 s and 5,000 rpm for 50 s, and baked at 180°C for 2 min. The thickness of the photoresist on the Si chip was about 300 nm.
Two kinds of patterns were designed to be placed on the Si templates. One is the crossmarks and the other is the nanosquare array. Figure 1a shows the schematic of the patterns. The crossmarks have a length of 600 μm and a width of 20 μm. Meanwhile, the square arrays have a length of 1 μm and a pitch size of 5 μm. After being exposed by an electron beam, the photoresist was developed with N50. To form an amino-terminated layer on the surface, the substrates were immersed in 5 vol% solution of 3-aminopropyl triethoxysilane (APTES) in 95% ethanol for 4 h and later rinsed with ethanol and thermally treated at 120°C for 40 min [29].
Figure 1.
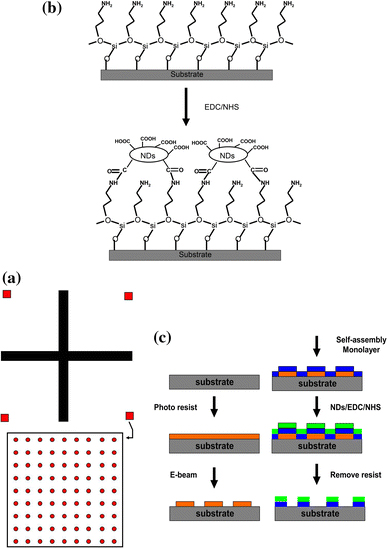
a Schematic of the pattern design, b schematic of the functionalized NDs bonded to the SAM substrates and c flow chart of the template fabrication processes
The NDs solution was prepared by adding 0.1 g of COOH functionalized NDs into 100 ml of DI water followed by an ultrasonic bath for 60 min. The patterned substrate was dipped into 3 ml of the ND solution and 3 ml of 0.1 M MES buffer [2-(N-morpholino) ethane sulfonic acid]. After which, 6 ml of 0.025 M EDC solution 1-ethyl-3-[3-(dimethylamino)propyl]carbodiimide hydrochloride, 0.025 M NHS solution (N-hydroxysuccinimide) (hereafter “EDC/NHS solution”) and 8 ml DI water were added into the reaction and allowed to stabilize for 8 h. After the reaction was completed, the substrate was washed with acetone. The entire template was then immersed into ZDMAC (dimethylacetamide) solution for 4 h to remove the photoresist. The substrate was again washed with acetone and DI water, then dried with N2. Figure 1b and 1c shows how the functionalized NDs were anchored on the patterned silicon templates and processes for the preparation of the substrates. The preparation of the lysozyme functionalized nanodiamond arrays is explained as follows.
The lysozyme protein of 0.1 g was dissolved into 10 ml PBS (phosphate-buffered saline) buffer. To ensure equilibration absorption, the nanodiamond patterned chip was dipped into the lysozyme solution mentioned earlier and mixed together with stirring for 2 h before it was washed by PBS buffer and deionized water. After which, 10 μl of E. coli suspension in 90 μl PBS medium was mixed with the nanodiamonds chip in PBS buffer. The nanodiamond chip was washed with PBS buffer and deionized water.
Results and Discussion
Figure 2a shows the SEM image of one of the corners inside the crossmark. The image of 2D square arrays of 1 μm in length and 5 μm in pitch is shown in Fig. 2b. The NDs array is well patterned according to the SEM images. The optical properties of the patterned NDs are demonstrated in Fig. 3. The Raman spectra of the NDs with and without acid treatment at an excitation wavelength of 488 nm are shown in Fig. 3. The treatment with acid has successfully removed the carbon-like structure from the NDs surface. As shown in the Raman spectrum, the peaks at 1,350 and 1,580 cm−1(the D-band and G-band signals caused by the carbon-like SP2 structure from the ND surface) were clearly attenuated after the acid treatment.
Figure 2.
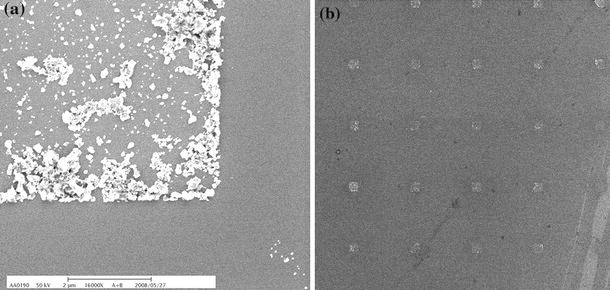
SEM images of a one of the corners of the crossmarks and b the 2D square arrays
Figure 3.
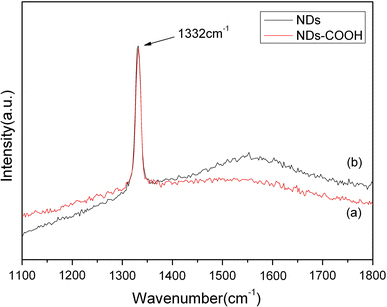
Raman spectra of NDs before and after the acid treatments
The micro-Raman spectra were also excited inside the reference crossmarks and nanosquares, and outside the patterns with a laser beam of about 1 μm in diameter. The Raman signals, as shown in Fig. 4, were only found inside the crossmarks (corssmark-in) and nanosquares (hole-in) where the NDs were anchored. However, with the laser beam placed outside the nanosquares (pattern-out area), no diamond-related signals were collected. This indicates that NDs were only allocated on the SAM inside the crossmarks and the nanosquares. The 2D image of the integrated Raman intensity mapping of the 1,332 cm−1 Raman peak is shown in Fig. 5b. Figure 5a shows the optical microscope image of the nanodiamonds arrays. The red square in the Fig. 5a indicates the area of Raman mapping. Keep in mind that the hole array was designed with a pitch of 5 μm. Compared with the results from the 2D Raman intensity mapping with the corresponding optical image, we found that the intensity distribution was perfectly correlated with the spatial distribution of the nanoarrays.
Figure 4.
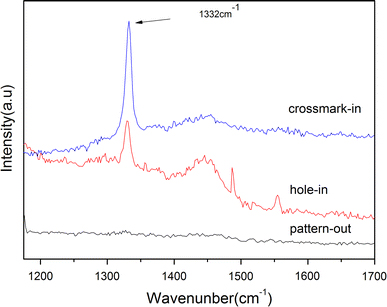
Raman spectra of the pattern-in and pattern-out area
Figure 5.
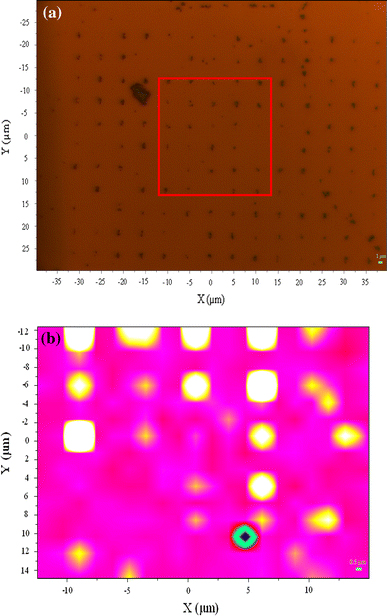
a Optical image of the 2D mapping area, indicated by the square and b image of the 2D Raman intensity mapping
In Fig. 6, the IR absorption spectra are shown for three different samples of (a) pure cNDs, (b) pure lysozyme, and (c) cND + lysozyme chips. For the spectrum (b) shown in Fig. 6, the appearance of amide peaks at 1,490–1,590 cm−1(amide 1), 1,600–1,700 cm−1(amide 2), and 3,100–3,300 cm−1 originate from the lysozyme. Due to the large background from the SiO2 layer for energy larger than 3,000 cm−1 in spectrum (c), detecting any peaks after 3,000 cm−1 is difficult for the ND-lysozyme arrays on chip. However, small peaks of amide at 1,490–1,590 cm−1 and 1,600–1,700 cm−1 that come from lysozymes can still be found, as shown in spectrum (c).
Figure 6.
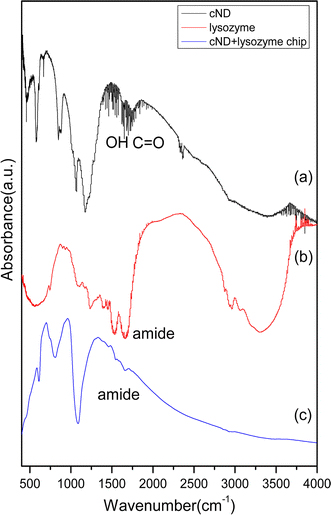
IR spectra of three different samples a cND, b lysozyme and c cND-lysozyme chip
The investigation of Raman spectra for the three different samples of lysozyme, cND + lysozyme in solution, and cND + lysozyme chip are shown in Fig. 7. Figure 7a shows the Raman spectrum of the protein lysozyme. In the region 1,400–1,700 cm−1, some weak peaks were found due to amide in protein, amino acid, CH, and CH2 groups. Figures 7b and 7c show the Raman spectra of NDs-lysozyme in solution and ND-lysozyme arrays, respectively. As shown in the spectra, the NDs-lysozyme complex exhibits both peaks of ND located at 1,332 cm−1 and lysozyme located at the 1,400–1,700 cm−1 region. Within our expectation, the Raman spectrum of the NDs-lysozyme arrays on the silicon template is identical to the NDs-lysozyme complex in the solution.
Figure 7.
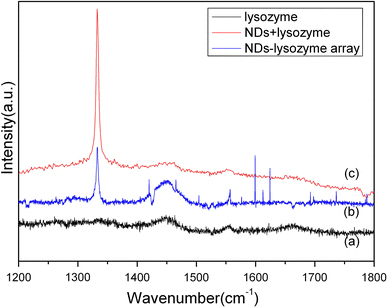
Raman spectra of three different samples a lysozyme, b lysozyme-cND complex in solution, c cND-lysozyme chip
The interaction of the bioactive lysozyme-ND complex array and a control set of stable (non-bioactive) ND array with bacteria were observed by using a scanning electron microscope. Figure 8a and 8b shows the E. coli interaction with the ND-lysozyme arrays on crossmarks and nanoarrays. The lysozyme proteins absorbed on the NDs still retained their antibacterial activity and interacted with the E. coli bacterial cells. As shown in the SEM image, morphology (the cell wall) of the E. coli was badly damaged by the NDs absorbed with the protein lysozyme [32,33]. However, bacteria on the control set did not interact with nanodiamonds and their cell wall remained intact. Although the lysozyme proteins are immobilized at the ND surface, we show that they are still fully functional and active.
Figure 8.
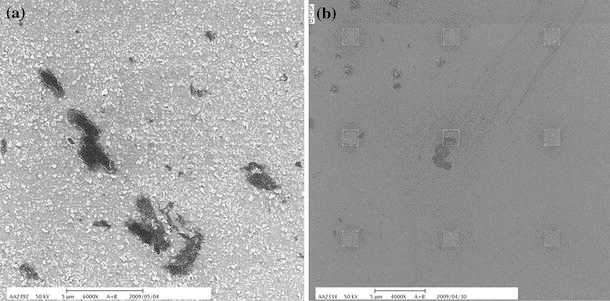
SEM images of E. coli interaction with ND-lysozyme film on a crossmark and b nanoarrays
The bioactive lysozyme-ND complex arrays were tested to be still functional at room temperature up to 10 h after preparation. However, they complete ceased to react with bacteria after 24 h. Nevertheless, it is possible to extend lifetime of the chip up to a week if it was kept under low temperature (5°C) and humid condition.
Conclusion
In this study, we have demonstrated new methods and techniques to anchor bio-functionalized NDs on a patterned silicon template using e-beam lithography and SAM techniques. The lysozyme proteins bound on the NDs still retained their antibacterial activity and interacted with E. coli bacterial cells. The device demonstrated here is suitable for applications in bio-sensing chips and single biomolecule patterning and detection. It facilitates the development of new applications of different biomolecule-nanodiamond complexes that can interact with special targets, as well as the individual observation of their optical property.
Acknowledgment
This work was supported by a grant from the National Science Council, ROC (NSC 96-2112-M-009).
Open Access
This article is distributed under the terms of the Creative Commons Attribution Noncommercial License which permits any noncommercial use, distribution, and reproduction in any medium, provided the original author(s) and source are credited.
References
- Niemeyer CM. Angew. 2001. p. 4128. COI number [1:CAS:528:DC%2BD3MXovFeisr0%3D] [DOI] [PubMed]
- Schrand AM, Huang H, Carlson C, Schlager JJ, Osawa E, Hussain SM, Dai L. J. Phys. Chem. B. 2007. p. 2. COI number [1:CAS:528:DC%2BD28XhtlSrsrrE] [DOI] [PubMed]
- Michalet X, Pinaud FF, Bentolila LA, Tsay M, Doose S, Li JJ, Sundaresan G, Wu AM, Gambhir SS, Weiss S. Science. 2005. p. 538. COI number [1:CAS:528:DC%2BD2MXmslOhtw%3D%3D]; Bibcode number [2005Sci...307..538M] [DOI] [PMC free article] [PubMed]
- Cui Y, Wei QQ, Park HK, Lieber CM. Science. 2001. p. 1289. COI number [1:CAS:528:DC%2BD3MXmtFCrtrs%3D]; Bibcode number [2001Sci...293.1289C] [DOI] [PubMed]
- Baughman RH, Zakhidov AA, de Heer WA. Science. 2002. p. 787. COI number [1:CAS:528:DC%2BD38XlvVyhsrw%3D]; Bibcode number [2002Sci...297..787B] [DOI] [PubMed]
- Bianco A, Prato M. Adv. 2003. p. 1765. COI number [1:CAS:528:DC%2BD3sXovFCktbc%3D] [DOI]
- Wenmackers S, Vermeeren V, vandeVen M, Ameloot M, Bijnens N, Haenen K, Michiels L, Wanger P. Phys. Status Solidi A. 2009. p. 391. COI number [1:CAS:528:DC%2BD1MXktVajurw%3D]; Bibcode number [2009PSSAR.206..391W] [DOI]
- Chen M, Pierstorff ED, Lam R, Li S-Y, Huang H, Osawa E, Ho D. Nano. 2009. p. 2016. COI number [1:CAS:528:DC%2BD1MXnt12ntro%3D] [DOI] [PubMed]
- Loh O, Lam R, Chen M, Moldovan N, Huang H, Ho D, Espinosa HD. Small. 2009. p. 1667. COI number [1:CAS:528:DC%2BD1MXpsV2ltb0%3D] [DOI] [PubMed]
- Lam R, Chen M, Pierstorff E, Huang H, Osawa E, Ho D. Nano. 2008. p. 2095. COI number [1:CAS:528:DC%2BD1cXhtF2isr%2FJ] [DOI] [PubMed]
- Nebel CE, Rezek B, Shin D, Uetsuka H, Yang N. J. 2007. p. 6443. COI number [1:CAS:528:DC%2BD2sXht1yqtLjK]; Bibcode number [2007JPhD...40.6443N] [DOI]
- HÄrtl A, Schmich E, Garrido JA, Hernando J, Catharino SCR, Walter S, Feulner P, Kromka A, Steinmüller D, Stutzann M. Nature materials. 2004. p. 736. Bibcode number [2004NatMa...3..736H] [DOI] [PubMed]
- Yang W, Auciello O, Butler JE, Cai W, Carlisle JA, Gerbi JE, Gruen DM, Knickerbocker T, Lasseter TL, Russell JN, Smith LM, Hamers RJ. Nature Materials. 2003. p. 253. Bibcode number [2002NatMa...1..253Y] [DOI] [PubMed]
- Davies G. Rep. 1981. p. 787. Bibcode number [1981RPPh...44..787D] [DOI]
- Davies G, Lawson S, Collins A, Mainwood A, Sharp S. Phys. 1992. p. 13157. Bibcode number [1992PhRvB..4613157D] [DOI] [PubMed]
- Ellis PJ, Buhaebko DS, Stoner BR. Diamond Relat. 1995. p. 406. COI number [1:CAS:528:DyaK2MXlsFCgs70%3D] [DOI]
- Sails SR, Gardiner DJ, Bowden M, Savage J, Rodway D. Diamond Relat. 1996. p. 589. COI number [1:CAS:528:DyaK28XjsVOlsbk%3D] [DOI]
- Ando T, Ishii M, Kamo M, Sato YJ. Chem. 1993. p. 749. COI number [1:CAS:528:DyaK3sXhslKmu7k%3D] [DOI]
- Gruen DM, Krauss AR, Zuiker CD, Csencsits R, Terminello LJ, Carlisle JA, Jimenez I, Sutherland DG, Shuh DK, Tong W, Himpsel FJ. Appl. 1996. p. 1640. COI number [1:CAS:528:DyaK28XhvVSltbk%3D]; Bibcode number [1996ApPhL..68.1640G] [DOI]
- Tamura H, Zhou H, Sugisako K, Yokoi Y, Takami S, Kubo M, Teraishi K, Miyamoto A. Phys. 2000. p. 11025. Bibcode number [2000PhRvB..6111025T]
- Mironov E, Koretz A, Petrov E. Diamond Relat. 2002. p. 872. COI number [1:CAS:528:DC%2BD38XjvVegtLk%3D] [DOI]
- Wenmackers S, Pop SD, Roodenko K, Vermeeren V, Williams OA, Daenen M, Douheret O, D’Haen J, Hardy A, Van Bael MK, Hinrichs K, Cobet C, vande Ven M, Ameloot M, Haenen K, Michiels L, Esser N, Wanger P. Langmuir. 2008. p. 7269. COI number [1:CAS:528:DC%2BD1cXnt1Cmtrk%3D] [DOI] [PubMed]
- Christiaens P, Vermeeren V, Wenmackers S, Daenen M, Haenen K, Nesladek M, vande Ven M, Ameloot M, Michiels L, Wanger P. Biosensor and Bioelectronics. 2006. p. 170. COI number [1:CAS:528:DC%2BD28Xosl2isL0%3D] [DOI] [PubMed]
- Chung PH, Perevedentseva E, Tu JS, Chang CC, Cheng CL. Diamond Relat. 2006. p. 622. COI number [1:CAS:528:DC%2BD28XmsVCqsrs%3D] [DOI]
- Roach P, Farrar D, Perry CC. J. 2005. p. 8168. COI number [1:CAS:528:DC%2BD2MXktF2ltLw%3D] [DOI] [PubMed]
- Uchida T, Sato T, Takeuchi S, Kuramochi N, Kawashima N. Jpn. 2003. p. 2967. COI number [1:CAS:528:DC%2BD3sXks1Kjs7Y%3D]; Bibcode number [2003JaJAP..42.2967U] [DOI]
- Suslick KS. Science. 1990. p. 1439. COI number [1:CAS:528:DyaK3cXitVCrt7c%3D]; Bibcode number [1990Sci...247.1439S] [DOI] [PubMed]
- Cheng CY, Chung PH, Tu JS, Hsieh YH, Cheng CL. Nanothechnology. 2007. p. 315102. [DOI]
- Shavel A, Gaponik N, Eychmuller A. Chem. 2005. p. 449. COI number [1:CAS:528:DC%2BD2MXjtFejsr8%3D] [DOI] [PubMed]
- Nguyen T-T-B, Chang H-C, Wu VW-K. Diam. 2007. p. 872. COI number [1:CAS:528:DC%2BD2sXkt1alu74%3D] [DOI]
- Vaijayanthimala V, Chang H-C. Nanomedicine. 2009. p. 47. COI number [1:CAS:528:DC%2BD1cXhsFajsbrK] [DOI] [PubMed]
- Pace CN, Vajdos F, Fee L, Grimsley G, Gray T. Protein Sci. 1995. p. 2411. COI number [1:CAS:528:DyaK2MXpsVGqt7k%3D] [DOI] [PMC free article] [PubMed]
- Ibrahim HR, Yamada M, Matsushita K, Kobayashi K, Kato A. J. 1994. p. 5069. [PubMed]


