

Abstract
Relative levels of ribosomal proteins were quantified in crude cell lysate using mass spectrometry. A method for quantifying cellular protein levels using macromolecular standards is presented that does not require complex sample separation, identification of high-responding peptides, affinity purification or post-growth modifications. Perturbations in ribosomal protein levels by overexpression of individual proteins correlate to known autoregulatory mechanisms and extend the network of ribosomal protein regulation.
Introduction
Mass spectrometry (MS) is a powerful technique for proteomic analysis1 and tandem mass spectrometry (MS/MS) in particular allows for the identification of hundreds of proteins from a single sample2. A major challenge in any MS analysis is accurately quantifying the levels of the proteins observed in the experiment, particularly as they respond to changes in the cell3,4. In response to this challenge, several techniques have been developed to measure protein levels using MS. Stable-isotope labeling by amino acids in cell culture (SILAC)5,6 quantifies relative protein levels by comparing two or more differently labeled samples. This is similar to whole cell stable isotope labeling7 which uses uniformly labeled media rather than labeled amino acids. Another method involves the addition of labeled high-responding peptides prepared by chemical synthesis for comparison to the unlabeled peptide in the sample8-10, though identification of such peptides can be difficult11. Labeled peptides have also been incorporated into affinity purification tags for quantitation of specific proteins (ICAT)12 and more recently for quantitation of protein interactions in macromolecular complexes13. Relative quantitation is obtained in all of these methods by comparing the intensities of feature pairs corresponding to unlabeled and labeled protein or peptide pairs.
Here a method is presented where a protein standard is added directly to crude cell lysate and the entire mixture is analyzed by liquid chromatography-coupled mass spectrometry (LC/MS). In the current work labeled standards are combined with unlabeled cell lysate, but unlabeled standards can be combined with labeled cell lysate, allowing commercially available proteins to be used as standards. The goal of this method is to provide accurate quantitation of total cellular protein levels with the simplest possible experimental framework.
This method is validated here using 15N-labeled ribosomes to measure cellular levels of ribosomal proteins in E. coli. The ribosome is a complex macromolecular machine at the heart of protein synthesis in the cell. The bacterial ribosome is composed of 3 strands of RNA and over 50 proteins, and while the three-dimensional structure of the ribosome is known14, many questions remain about its assembly. The entire process of ribosome biogenesis is heavily regulated15,16, beginning with the synthesis of the individual ribosomal components. Several ribosomal proteins are autoregulatory, affecting not only their own translation but also that of other ribosomal and non-ribosomal proteins that are encoded on the same operon. These include the α, β, S10, L11, spc and str operons that are regulated by proteins S4, L10, L4, L1, S8 and S7, respectively17. Perturbation of individual ribosomal protein levels by overexpression should result in alterations of other protein levels, revealing features of the autoregulatory network.
Cellular levels of E. coli ribosomal proteins relative to a wild type reference culture were examined in 20 cultures where each of the small subunit proteins S2-S21 was individually overexpressed. The amount of overexpression was carefully controlled by adjustment of the amount of IPTG to give an approximate 5-fold overexpression At this constant low level of overexpression, rapid growth is maintained, and the cells are not overwhelmed with the expressed protein. In addition, a culture containing an empty expression plasmid was analyzed as a control for possible effects of the plasmid. By comparing protein levels measured in these cultures to the levels found in wild type E. coli, the cellular response to perturbations in the levels of specific ribosomal proteins is observed.
Experimental Section
Sample Preparation
E. coli BL21 (DE3) cells were grown at 37°C in M9 glucose minimal medium supplemented with trace metals and vitamins. Cells had no plasmid, carried an empty plasmid, or carried a wild type clone of one of ribosomal proteins S2-S21 in the vector pET24b with an inducible T7 promoter (these strains were a gift from Gloria Culver). The medium was supplemented with 50 μg/mL kanamycin and 25 μM IPTG for constitutive overexpression of the cloned ribosomal protein, except for overexpression of S7 which required 50 μM IPTG. These IPTG levels are greatly reduced from the ∼1 mM levels used for preparative overexpression of recombinant proteins. The range of 25-50 μM used here gives a several-fold overexpression of ribosomal proteins under steady-state growth conditions. The medium was prepared with 1 g/L 14N ammonium sulfate as the sole nitrogen source. Cells were grown to OD600 0.7 then incubated on ice for 20 minutes and harvested by centrifugation at 6000 rpm for 10 minutes. Cells were stored at −80°C.
Frozen cell pellets were thawed and resuspended in Buffer A (20 mM Tris HCl pH 7.5, 100 mM NH4Cl, 10 mM MgCl2, 0.5 mM EDTA, 6 mM β-mercaptoethanol) and then lysed in a bead-beater (BioSpec Products, Inc, Bartesville, OK) using 0.1 mm zirconia/silica beads. Insoluble debris was removed by centrifugation at 6000 rpm for 10 minutes. An aliquot containing 2500 OD260 units was removed and combined with a previously prepared aliquot of 15N ribosomes containing 1250 OD260 units. This amount of standard was empirically determined to approximately match the concentration of ribosomal proteins in the cell for optimal quantitation. Proteins were precipitated by adding 6.1 M trichloracetic acid (TCA) to a final concentration of 13%. Samples were incubated on ice for a minimum of 1 hour. The protein precipitates were pelleted by centrifugation at 16,000 g for 20 minutes at 4°C. The supernatant was removed and the pellets were rinsed with cold acetone then dried in a Speed-Vac concentrator. Dry pellets were resuspended in 50 μL of 100 mM ammonium bicarbonate (pH 8.5) in 5% acetonitrile. 5 μL of 50 mM DTT was added and the samples were incubated at 65°C for 10 minutes. Cysteine residues were modified by the addition of 5 μL of 100 mM iodoacetamide followed by incubation at 30°C for 30 minutes in the dark. Proteolytic digestion of the proteins was carried out by the addition of 5 μL of 0.1 μg/mL (excess amounts) modified sequencing grade porcine trypsin (Promega, Co., Madison, WI) with incubation overnight at 37°C. Undigested proteins were precipitated by adding 1/3 volume of 20% acetonitrile (ACN) in 2% trifluoroacetic acid and removed by centrifugation. The supernatant was loaded to a PepClean C18 spin column (Thermo Fisher Scientific Inc., Rockford, IL) to remove salts and concentrate the sample. Elutes were dried in a Speed-Vac concentrator and peptides were redissolved in 10 μL of 5% ACN in 0.1% formic acid. An 8 μL aliquot was used for the electrospray ionization time-of-flight (ESI-TOF) analysis.
15N-labeled ribosomes were prepared by growing E.Coli MRE600 cells in 15N M9 minimal medium, and cells were lysed as described above. Insoluble debris was removed by centrifugation at 31,000 g for 40 minutes. The supernatant was layered onto a 5 mL cushion of 1.1 M sucrose in Buffer B (20 mM Tris HCl pH 7.5, 500 mM NH4Cl, 10 mM MgCl2, 6 mM β-mercaptoethanol) and the ribosomes were pelleted by spinning at 37,200 rpm at 4°C in a Ti70.1 rotor (Beckman Coulter, Fullerton, CA) for 22 hours. The supernatant was removed, the tube and the ribosome pellet was rinsed with Buffer C (50 mM Tris HCl pH 7.8, 1 mM MgCl2, 100 mM NH4Cl, 6 mM β-mercaptoethanol) and the pellet was resuspended in Buffer C. The ribosome concentration was estimated by measuring the OD260 value using an extinction coefficient of 3.84 × 10⁷ M-1 cm-1. Ribosomes prepared using this rapid protocol typically contain slightly different amounts of 30S and 50S subunits. Aliquots were frozen and stored at −20°C.
ESI-TOF Mass Spectrometry
The samples were analyzed on an Agilent 1100 Series high performance liquid chromatography (HPLC) instrument coupled to an Agilent ESI-TOF instrument with capillary flow electrospray (Agilent Technologies Inc., Santa Clara, CA). The samples were injected using an autosampler onto an Agilent Zorbax SB C18 150 × 0.5 mm HPLC column. Peptides were separated on an acetonitrile gradient in 0.1 % formic acid at a flow rate of 7 μL/min. The steps of the gradient were 5-15% ACN over 10 minutes, 15-50% ACN over 70 minutes and 50-95% ACN over 4 minutes. Data was collected over the m/z range of 100-1300.
Identification of Peptide Pairs
A liquid chromatography-coupled mass spectrometry (LC/MS) dataset of tryptic peptides from crude E. coli lysate contains thousands of features from the most abundant cellular proteins. Ribosomal proteins are particularly abundant in MS data from crude cell lysate due to the large number of ribosomes in the cytosol18,19. Features in an LC/MS dataset arising from ribosomal proteins can be readily identified by addition of 15N-labeled 70S ribosomes to the crude lysate, providing a convenient stoichiometric mixture of 53 labeled proteins. Peptides from non-ribosomal proteins are present as single features in the LC/MS dataset, while peptides from ribosomal proteins are present as feature pairs corresponding to unlabeled and 15N-labeled versions of the same peptide. A portion of a mass spectrum containing ribosomal peptide feature pairs is shown in Figure 1a and the entire LC/MS dataset is shown in Supplementary Figure S1. The combination of accurate mass and the mass shift due to 15N-content has previously been used to facilitate peptide identification in LC/MS datasets20,21 including studies of purified ribosomal subunits22. This approach is successfully extended here to peptide identification in crude cell lysates.
Figure 1.
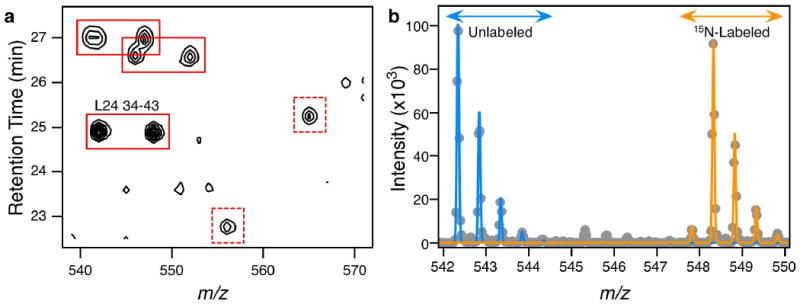
LC/MS data. a) A low-resolution contour plot of a portion of the mass spectrum of crude E. coli cell lysate spiked with 15N-labeled 70S ribosomes. The entire mass spectrum is shown in Supplementary Figure S1. The isotopic envelope consisting of the monoisotopic peak and isotopomers is not resolved in this representation. Solid red boxes indicate pairs of peaks representing unlabeled and 15N-labeled pairs of peptides from ribosomal proteins. Dashed red boxes indicate unpaired peaks from non-ribosomal proteins. The peak pair for ribosomal protein L24, residues 34-43 (VIVEGINLVK, +2) is highlighted. b) A 1D mass spectrum generated by summing in the retention time domain (total width of 0.2 minutes). The spectrum shown here arises from protein L24 residues 34-43, also depicted in the low-resolution contour plot in (a). Data points are indicated by grey dots while the blue and orange lines represent the theoretical distributions of the unlabeled (sample) and 15N-labeled (standard) distributions respectively. These distrbutions are fit to the data using LS-FTC, with a final unlabeled:labeled or sample:standard ratio of 1.08. The peak just below 548 m/z units arises from imperfect 15N-labeling of the 70S ribosome standard (99.3%), and is useful in discriminating between peaks from the standard and those from the lysate that happen to have a similar m/z value.
First a feature list was generated using the Agilent programs Mass Hunter and Mass Profiler. To generate the feature list, Mass Hunter (version 1.0.0.0, A.02.00) was used to read an Agilent .wiff file and generate a .mhd file (signal-to-noise threshold of 3 and “Peptidic isotope distribution” enabled, default parameters otherwise). Mass Profiler (version 1.0.2068.18614) was used to read the .mhd file and export a feature list using the “Export acquired included list” function (default parameters). Subsequent analysis steps were performed using in-house software. A feature corresponds to the entire isotopic envelope from a single ion and contains both a monoisotopic peak and several isotopomers. Features are defined by the m/z value of the monoisotopic peak, the charge of the ion and the retention time on the column. This feature list was compared to a theoretical trypsin digest of all ribosomal proteins from the E. coli 70S ribosome (S2-S21 and L1-L36). The theoretical digest incorporates peptides resulting from both perfect and imperfect trypsin cleavage (up to 4 consecutive missed cleavages were considered) and includes both unlabeled and fully 15N-labeled forms of the resultant peptides at charge states up to +6. Cysteine residues were all treated as modified by iodoacetamide. Possible identities were assigned to a feature when a theoretical ion's charge was identical and its mass was within 50 ppm of the feature's mass. 14N/15N pairs were extracted from the possible identities when the features to which they matched had a retention time within 0.1 minutes of each other. When multiple identities matched the same features or when the same peptide matched multiple proteins they were discarded. For each remaining feature pair, segments of the complete mass spectrum were extracted in widths of 0.2 minutes, centered about the average retention time of the two features and incorporating the entire isotopic envelope of both. The complete mass spectrum was previously converted from an Agilent .wiff file to a text file using the program Analyst QS (build 7222) and the “Data File Export” function (store profile data above 0 counts, default parameters otherwise).
Determination of Unlabeled/Labeled Amplitudes
Theoretical isotope distributions were fit to extracted spectra using the program isodist23. Isodist uses least-squares Fourier transform convolution (LS-FTC) to fit calculated isotope distributions to the entire isotopic envelope observed in the mass spectrum. Two distributions were fit, one unlabeled (all isotope values given by natural abundance), and one fully labeled (15N fixed at 99.3%) to the experimental spectra. An example of such a fit is given in Figure 1b. The amplitudes given by isodist yield the relative amounts of unlabeled and 15N-labeled peptide in the sample. All extracted spectra fit this way were evaluated visually for goodness of fit, and those with poorly fitting theoretical distributions were rejected. Poor fits typically arise from either noise in the mass spectrum or overlap of the isotope distributions from co-eluting peptides of a similar mass/charge ratio. Spurious feature pairs generated from misidentification of a 14N feature as a 15N feature are easily eliminated at this step due to the distinctive isotopic envelope of a 15N-labeled peptide (Figure 1b). For most proteins multiple peptides are identified providing estimates in the errors for quantitation.
Scaling of data and comparison to the control
The initial protein level (Pi) corresponds to the ratio of unlabeled (AU) to labeled (AL) amplitudes as determined by LS-FTC. This value represents the amount of cellular protein relative to the 15N standard for each peptide or charge state of the same peptide identified.
| (1) |
Multiple independent measurements corresponding to different peptides or different charge states of a single peptide are routinely obtained for each protein, as shown for the control culture of E. coli containing an empty expression plasmid (Figure 2a).
Figure 2.
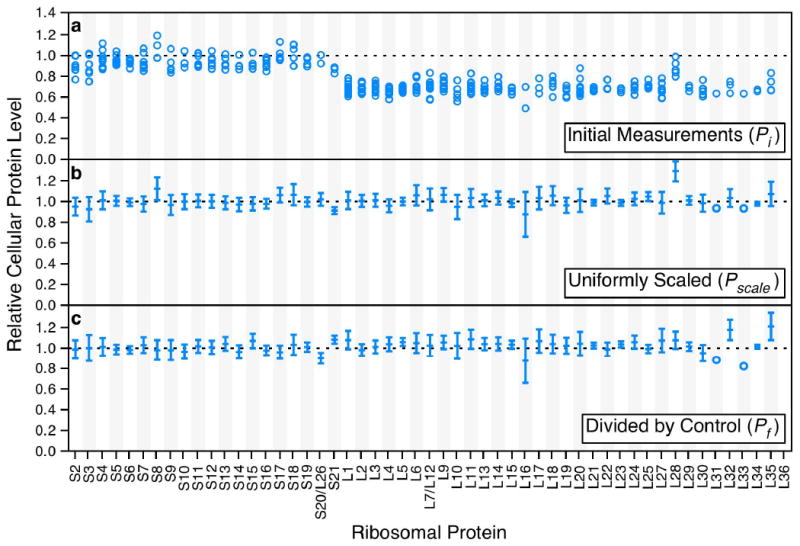
Ribosomal protein level measurements from E. coli containing an empty plasmid. a) Initial relative protein levels compared to the 15N standard. Circles represent individual measurements from different peptides or charge states of the same peptide. b) The same data as in (a), represented as an average value with error bars indicating the standard deviation of measurements. The data is uniformly scaled so that the average values for the reference proteins S4 and L3 are set to 1. c) The same data as in (b), divided on a per-protein basis by the uniformly scaled values from the wild type reference sample. Values now indicate the relative cellular protein level compared to wild type. Errors were propagated from both the sample and reference datasets.
The average of these observations gives the initial relative protein level for a protein, and the error is calculated as the standard deviation of the individual observations. However, the amplitude of the labeled distribution and therefore the ratio depend implicitly on the amount of standard added (see Sample Preparation). To compensate for differences in the amount of standard added between cultures, these initial protein level measurements are uniformly scaled so that an arbitrary reference protein's abundance relative to the standard is set to one, yielding a scaled protein level (Pscale, Figure 2b). This is done by dividing all of the initial protein levels (Pi) by the initial protein level for the reference protein (Pref).
| (2) |
The scaling provides a consistent reference frame for comparison between independent samples. Small ribosomal proteins (S2-S21) and large ribosomal proteins (L1-L36) are scaled separately because the 15N standard contains slightly different amounts of 30S and 50S subunits. Proteins S4 and L3 were chosen as the reference proteins for the respective subunits as they are primary binding proteins with protein levels that appear to be unaffected in the current work. The primary binding protein S17 was chosen as the reference protein in the case where S4 was overexpressed.
The final step is to transform the values into protein levels relative to the wild type reference culture (Pf). This is done by dividing the scaled protein level values from each sample by the scaled protein levels from the wild type reference culture (Pscale•ref) on a per-protein basis.
| (3) |
The errors are propagated from both datasets. The resulting ratio for each protein is the relative amount in the sample compared to the reference (Figure 2c). The average relative cellular protein level in the control culture of E. coli with an empty plasmid is 1.006 ± 0.064. The final results are generally insensitive to the choice of reference protein (Supplementary Figure S2).
Determination of protein level cutoffs
To determine the cutoff for a significant change in the final relative cellular protein level, a histogram of 1072 final protein levels for the 21 experiments was generated, excluding levels of the proteins that were overexpressed. The bulk of the distribution fits well to a Gaussian distribution centered around 1.000, with a mean of 1.025 and a standard deviation of 0.075 (Supplementary Figure S3a). Two small populations are present outside the Gaussian distribution, but fitting is essentially unaffected by these outliers as they are extremely few in number. The fitting parameters closely match the mean and standard deviation (1.006 ± 0.064) of the no plasmid control experiment. Taking a conservative cutoff value of four standard deviations from the mean yields an upper cutoff of 1.325 (for a significantly increased protein level) and a lower cutoff of 0.725 (for a significantly decreased protein level). Inspection of the distribution of measurements reveals a distinct population centered around ∼0.25 (Supplementary Figure 3b). Based on this observation a second cutoff of 0.375 is used to define a highly decreased protein level.
Cases where only a single peptide is observed in either the sample or wild type reference cultures are reported, but noted as potentially insignificant even when the relative protein levels exceed the established cutoffs. In the reference culture only a single measurement was recorded for L31, L34 and L36, thus final protein levels for these three proteins are considered to be insignificant in all of the 20 sample cultures and the control.
Sucrose Gradient Ultracentrifugation
E. coli BL21 (DE3) cells carrying the S4 ribosomal protein in the pET24b vector and an empty BL21 (DE3) plasmid were grown, harvested, and lysed as described above. After removing insoluble debris, 1 mL of the supernatants were layered onto 35 mL 12.9-51.5% (w/w) sucrose gradients in non-dissociating Buffer C (50mM Tris HCL pH 7.8, 10 mM MgCl2, 100 mM NH4Cl, and 6 mM β-mercaptoethanol). Gradients were centrifuged at 26,000 rpm for 18 hours in an SW32 rotor (Beckman Coulter, Fullerton, CA), and UV traces were obtained at 254 nM using a Type 11 Optical Unit (Brandel, Gaithersburg, MD).
Results and Discussion
Ribosomal proteins regulate ribosomal protein expression
Significant effects on proteins levels were observed upon overexpression of a number of ribosomal proteins. Overexpression of S4 resulted in decreased levels of S2, S11 and S13 and an increased level of L28 (Figure 3a). S4 binds to the leader sequence and the start of the S13 gene, and has previously been shown to regulate all of the ribosomal protein genes in the α operon. Interestingly, it has not been shown to regulate the rpoA gene located between the genes for S4 and L1717. A significant decrease in the cellular levels of L17 was not recorded here, suggesting that in this experiment L17 may be decoupled from regulation by S4. Repression of L17 by S4 has been reported to be less effective than the repression of S11 and S13 by S424, so it may be possible that the effect is masked by noise and experimental error. Protein S4 has not been previously reported to regulate either S2 or L28. Overexpression of S7 results in decreased levels of S2 and S12 (Figure 3b). S7 binds between the genes for itself and S12, repressing S12 by retroregulation17. Like S4, S7 has not been previously reported to regulate S2.
Figure 3.
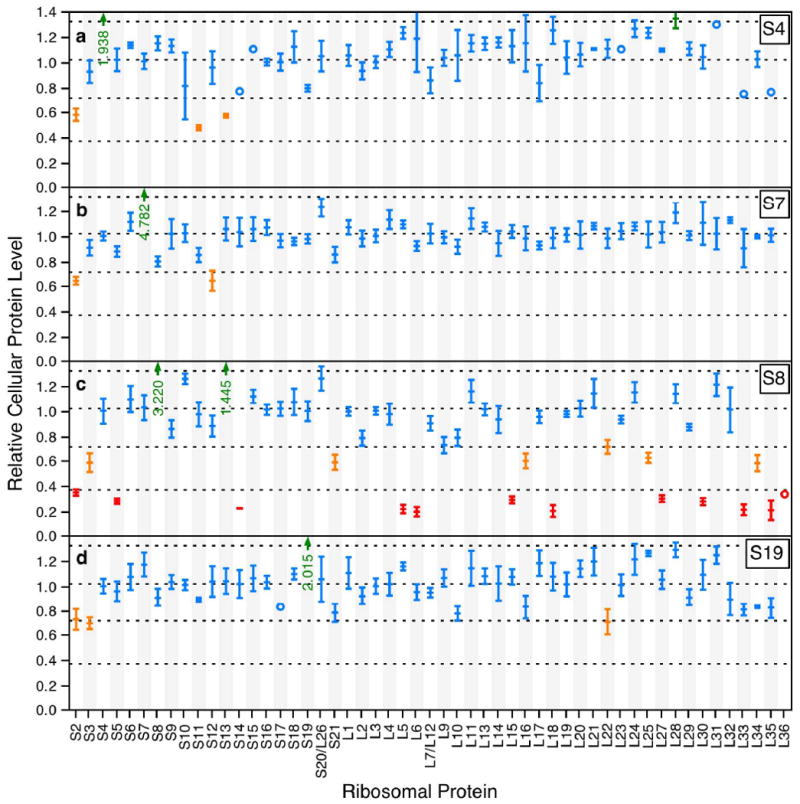
Relative cellular protein levels. Dashed lines are drawn at the mean of 1.025 as well as the cutoffs of 1.325, 0.725 and 0.375 for significantly increased, significantly decreased and highly decreased respectively. Values greater than 1.325 are colored green, values less than 0.725 are colored orange and values less than 0.375 are colored red. All other values are colored blue. Values outside the range of the plots are indicated by green arrows. Error bars are the standard deviation of measurements from multiple 14N/15N feature pairs corresponding to different ions (peptides and charge states) and include error due to normalization by the wild type reference. a) Protein levels for the S4 overexpression experiment. b) Protein levels for the S7 overexpression experiment. c) Protein levels for the S8 overexpression experiment. d) Protein levels for the S19 overexpression experiment.
Overexpresion of S8 resulted in decreased cellular levels for several ribosomal proteins (Figure 3c). S3, S21, L16, L22, L25 and L34 are all present at significantly reduced levels, though only one measurement was recorded for L34 in the reference culture. S2, S5, S14, L5, L6, L15, L18, L27, L30, L33, L35 and L36 are all present at highly reduced levels (< 0.375), though only one measurement was recorded for L36. S8 binds to the spc operon in the region between the L24 and L5 genes, repressing translation of all genes downstream of this site17. This includes the genes for the bulk of the proteins present at highly reduced levels in the experiment. While L14 and L24 have been shown to be retroregulated by S8, the effect is brief25 and thus unlikely to be observed in the current work where proteins are overexpressed at steady state during the entire growth period. Direct regulation of L36 by S8 has not been previously reported, and the current results are inconclusive due to the identification of only one L36 peptide in the S8 overexpression experiment. Regulation of proteins not on the spc operon (S2, S3, S21, L16, L22, L25, L27, L33, L34, L35, L36) by S8 has not been previously observed, nor has the increased level of protein S13 seen here. Overexpression of S19 leads to decreased levels of S2 and S3 and increased levels of L22 (Figure 3d). S19 has not previously been reported to regulate expression of ribosomal proteins.
A regulatory cascade in the cell and the disruption of ribosome assembly
The results from the overexpression experiments are summarized in Figure 4 on a map of the ribosomal operons. Previously known auto-regulatory pathways are observed here, including regulation of the α, str and spc operons by proteins S4, S7 and S8 respectively. Recreating these known pathways is a powerful validation of the simple method presented here. Interestingly, there are also several effects that were not previously observed. Among these are the decreased level of S2 as a result of overexpression of S4, S7, S8 or S19, as well as the decreased levels of S3 and S21 as a result of overexpression of S8. Notably, each of these proteins is a tertiary binding protein in the 30S subunit26. Overexpression of S8 also results in several newly observed effects on large subunit proteins (L16, L22, L25, L27, L33 and L35), and of these, only L22 is not a tertiary binding protein27. The fact that so many tertiary binding proteins are affected outside the known regulatory pathways suggests that many of the novel effects observed may result from a regulatory cascade that includes the disruption of ribosome assembly and the accumulation of partially formed ribosomal subunits lacking late-binding ribosomal proteins. When primary or secondary binding proteins are down-regulated, they will be unavailable to assembling subunits, hampering binding of subsequent proteins and resulting in incomplete subunits. Even if the presence of a protein is not a thermodynamic requirement for the binding of subsequent proteins, its absence may still slow the assembly process and result in the accumulation of partially formed ribosomal subunits that will naturally be lacking the latest binding proteins such as S2 and S3. Interfering with assembly in this way should result in slower growth rates, and doubling times for the S4, S7 and S8 overexpression cultures were on the order of 1.5 times as long as the same strains grown without induction by IPTG (data not shown).
Figure 4.
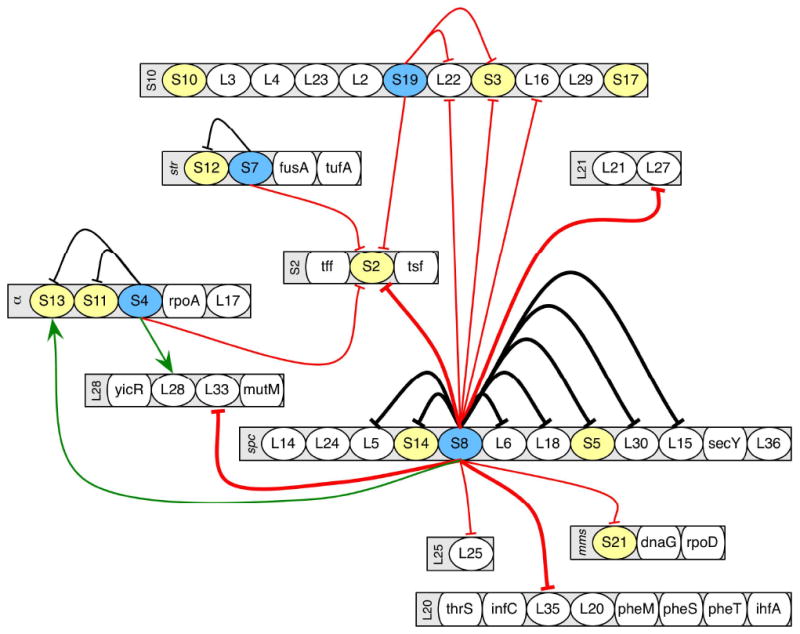
The network of interactions observed as a result of ribosomal protein overexpression. Ribosomal protein genes are organized by operon, and listed by protein name. Other proteins are listed by gene name. Operon names are indicated on the left edge of the operon. Proteins which are overexpressed but for which no significant effects were observed are shaded in yellow, while those for which effects are observed are shaded in blue. Operons that were neither the source nor target of regulatory effects are omitted. The green arrows indicate an increased protein level as a result of overexpression while the red and black arrows indicate a decreased protein level as a result of overexpression. Black arrows are those effects that have also been previously observed. Thin arrows indicate significantly decreased (< 0.725) or increased (> 1.325) while thick arrows indicate highly decreased (< 0.375).
Indeed the large changes in protein levels observed cannot be attributed to variations in the size of the free protein pool alone. Cellular levels of ribosomal proteins as measured here include the pool of free ribosomal proteins, any proteins present in ribosomal assembly intermediates and proteins present in fully assembled ribosomes. The pool of free proteins is small, on the order of a few percent of the total number of ribosomes28, and ribosomes assemble quickly in vivo29; hence, in rapidly growing wild type E. coli, the large majority of ribosomal proteins are part of fully assembled ribosomes. Reducing the free pool alone would only account for a change of a few percent, and many of the changes observed here are much larger than that. In particular, overexpression of S8 leads to highly reduced protein levels for several proteins, as low as 25% relative to wild type. Since some proteins are still present at normal levels, there must be a significant population of partially assembled ribosomal subunits missing those proteins that are present at reduced levels.
A sucrose gradient of cell lysate from an S4 overexpression experiment shows that the population of complete 70S ribosomes is depleted relative to wild type, and shows an accumulation of what appear to be 30S and 50S subunits, along with two small peaks, one sedimenting before each of the two subunits (Figure 5). While it is possible that the accumulated subunits are complete and that their association into 70S ribosomes is being prevented, the protein levels suggest that they are depleted in proteins S2, S11 and S13, each of which are present at a lower level when S4 is overexpressed.
Figure 5.
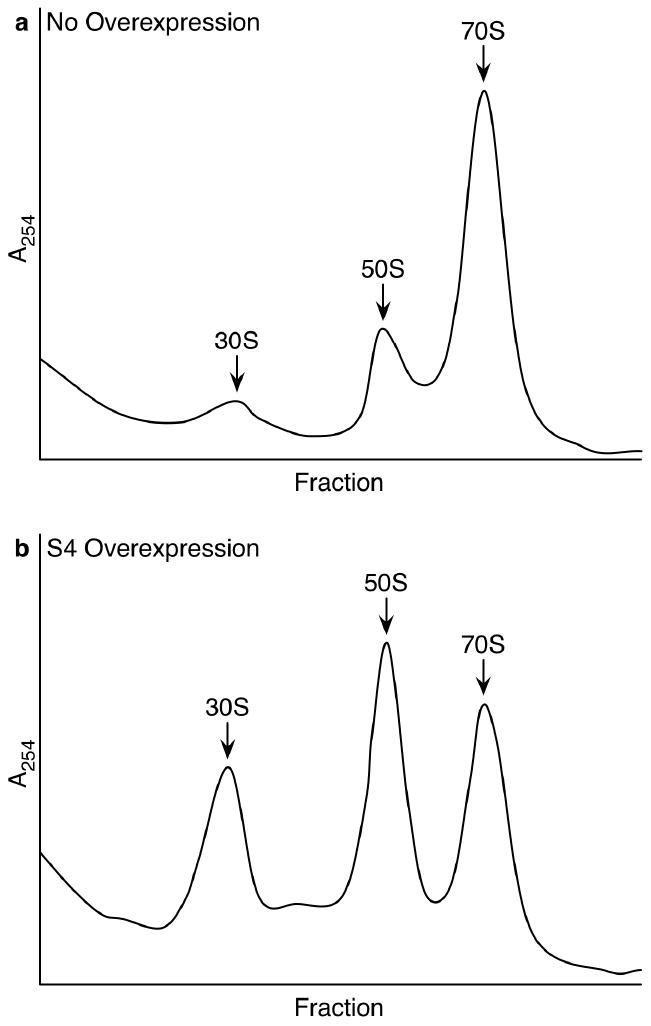
Sucrose gradients of crude cell lysate. a) Wild type E. coli. b) E. coli overexpressing ribosomal protein S4. Relatively reduced levels of 70S ribosomes and increased levels of 30S and 50S subunits are visible. Two small new peaks appear compared to the wild type gradient, one sedimenting before each of the two subunits. Presumably these are the result of accumulation of low levels of ribosomal subunit assembly intermediates.
Though it seems clear that subunit assembly is being affected, that alone is not enough to explain the low levels of tertiary proteins observed. If S2 or other tertiary proteins were being translated at a constant rate, failing to assemble into complete subunits would result in an accumulation of these proteins in the cytoplasm, but no depletion in their overall protein levels. The pool of free ribosomal proteins would simply increase by the same amount that the pool of proteins incorporated into ribosomes decreased. Therefore, some additional regulatory mechanism must be being triggered to counteract the buildup of the free pool of these proteins. In the case of S2, it serves to regulate its own expression30, thereby down-regulating its own synthesis as assembly slows to maintain a relatively constant free protein level but, as shown in the S4, S7, S8 and S19 overexpression experiments, a significantly reduced protein level overall. The gene for S21 is part of the macromolecular synthesis operon31, and while autoregulation by S21 has not been shown it is likely a component of the highly complex regulation of this operon, which is known to regulate each gene individually. More unusual is the reduced protein level of S3, whose gene is part of the S10 operon regulated by protein L4. Since the L4 levels remain constant in all of the experiments, and since not all of the genes on the S10 operon have similarily low levels, a different mechanism must account for the low levels of S3 observed when S8 and S19 are overexpressed or the low levels of other tertiary proteins observed. Perhaps some of the numerous ribosome assembly factors are involved in recruiting proteins to a subunit in the process of assembly, and upon recognizing the inability of the protein to bind to the assembling ribosome, target the protein for degradation. Regardless of the specific mechanism, overexpression of certain ribosomal proteins initiates a regulatory cascade with a wide range of effects. Overexpression of a single ribosomal protein leads to specific repression other ribosomal proteins, which in turn leads to problems with ribosome assembly, the accumulation of free ribosomal proteins in the cytoplasm and the subsequent down-regulation or degradation of these proteins. Furthermore, the disparate protein levels indicate regulation occurs with more fine-grained control than simple repression of entire operons.
Regulation of L22
One notable effect not previously observed is the reduced level of L22 present when S19 is overexpressed. The gene for L22 is immediately downstream of the gene for S19 on the S10 operon, and it is not a tertiary binding protein, making a direct genetic regulatory mechanism more plausible. However, decreased levels of L22 are also observed upon overexpression of S8, and its down-regulation by more than one protein suggests that a regulatory cascade through a common effect such as interruption of subunit assembly may again be involved. The incorporation of L22 into assembling ribosomes may simply be more dependent on other proteins than is currently understood, acting in this case in a similar manner to tertiary binding proteins. Interestingly, S19 appears to adversely affect ribosome assembly and cause low levels of S2, S3 and L22 merely by increasing its own numbers, rather than depleting the available pool of another protein by auto-regulation. Perhaps the excess of S19 results in non-specific binding to the assembling subunits, interfering with the native assembly process. It is equally possible that this hypothesis accounts, at least in part, for some of the effects observed for the other overexpressed proteins. Since S8 overexpression also affects L22, it could be that the L22 binding pocket is prone to non-specific protein interactions.
Conclusions
The method presented here is a simple, powerful and general method for quantifying cellular protein levels. It does not require complex sample separation or the identification and synthesis of high-responding peptides, and is limited only by the ability to isolate sufficient quantities of standard molecules. While the present work involves preparation of labeled standards, it is possible to use unlabeled standards when combined with cells growing in fully labeled medium, opening the door to experiments that measure cellular levels of components of commercially available complexes such as RNA polymerase. Unlike SILAC, there is no specific requirement for growth media when a labeled standard is used, allowing experiments to be performed under a wide variety of growth conditions. Although the current work focuses on relative protein levels between control and ribosomal protein overexpression strains, absolute quantitation is also possible provided that the amount of standard added can be accurately quantitated. The method was successfully applied to measuring ribosomal protein levels in response to overexpression of individual ribosomal proteins, noting previously observed regulatory effects17,25 as well as unexpected decreases in the level of tertiary binding proteins in several experiments. This approach, in conjunction with genetic manipulation of bacteria, should provide a powerful tool to analyze complex networks involved in cell physiology.
Supplementary Material
Acknowledgments
This work was supported by grants from the NIH (F32-GM083510 to M.T.S. and R37-GM053757 to J.R.W.). The authors wish to thank Z. Shajani for critical comments on the manuscript and G. Culver for the gift of the E. coli overexpression strains.
Footnotes
Supporting Information Available: Additional information is available as noted in the text. This material is available free of charge via the Internet at http://pubs.acs.org.
References
- 1.Yates JR. Annual review of biophysics and biomolecular structure. 2004;33:297–316. doi: 10.1146/annurev.biophys.33.111502.082538. [DOI] [PubMed] [Google Scholar]
- 2.Aebersold R, Mann M. Nature. 2003;422:198–207. doi: 10.1038/nature01511. [DOI] [PubMed] [Google Scholar]
- 3.Elliott MH, Smith DS, Parker CE, Borchers C. J Mass Spectrom. 2009;44:1637–1660. doi: 10.1002/jms.1692. [DOI] [PubMed] [Google Scholar]
- 4.Ong SE, Mann M. Nat Chem Biol. 2005;1:252–262. doi: 10.1038/nchembio736. [DOI] [PubMed] [Google Scholar]
- 5.Mann M. Nat Rev Mol Cell Biol. 2006;7:952–958. doi: 10.1038/nrm2067. [DOI] [PubMed] [Google Scholar]
- 6.Ong SE, Blagoev B, Kratchmarova I, Kristensen DB, Steen H, Pandey A, Mann M. Mol Cell Proteomics. 2002;1:376–386. doi: 10.1074/mcp.m200025-mcp200. [DOI] [PubMed] [Google Scholar]
- 7.Oda Y, Huang K, Cross FR, Cowburn D, Chait BT. Proc Natl Acad Sci USA. 1999;96:6591–6596. doi: 10.1073/pnas.96.12.6591. [DOI] [PMC free article] [PubMed] [Google Scholar]
- 8.Gerber SA, Rush J, Stemman O, Kirschner MW, Gygi SP. Proc Natl Acad Sci USA. 2003;100:6940–6945. doi: 10.1073/pnas.0832254100. [DOI] [PMC free article] [PubMed] [Google Scholar]
- 9.Barr JR, Maggio VL, Patterson DG, Cooper GR, Henderson LO, Turner WE, Smith SJ, Hannon WH, Needham LL, Sampson EJ. Clin Chem. 1996;42:1676–1682. [PubMed] [Google Scholar]
- 10.Barnidge DR, Dratz EA, Martin T, Bonilla LE, Moran LB, Lindall A. Anal Chem. 2003;75:445–451. doi: 10.1021/ac026154+. [DOI] [PubMed] [Google Scholar]
- 11.Fusaro V, Mani D, Mesirov J, Carr S. Nat Biotechnol. 2009;27:190–198. doi: 10.1038/nbt.1524. [DOI] [PMC free article] [PubMed] [Google Scholar]
- 12.Gygi SP, Rist B, Gerber SA, Turecek F, Gelb MH, Aebersold R. Nat Biotechnol. 1999;17:994–999. doi: 10.1038/13690. [DOI] [PubMed] [Google Scholar]
- 13.Wepf A, Glatter T, Schmidt A, Aebersold R, Gstaiger M. Nat Methods. 2009 doi: 10.1038/nmeth.1302. [DOI] [PubMed] [Google Scholar]
- 14.Selmer M, Dunham CM, Murphy FV, Weixlbaumer A, Petry S, Kelley AC, Weir JR, Ramakrishnan V. Science. 2006;313:1935–1942. doi: 10.1126/science.1131127. [DOI] [PubMed] [Google Scholar]
- 15.Kaczanowska M, Rydén-Aulin M. Microbiol Mol Biol Rev. 2007;71:477–494. doi: 10.1128/MMBR.00013-07. [DOI] [PMC free article] [PubMed] [Google Scholar]
- 16.Wilson DN, Nierhaus KH. Crit Rev Biochem Mol Biol. 2007;42:187–219. doi: 10.1080/10409230701360843. [DOI] [PubMed] [Google Scholar]
- 17.Zengel JM, Lindahl L. Prog Nucleic Acid Res Mol Biol. 1994;47:331–370. doi: 10.1016/s0079-6603(08)60256-1. [DOI] [PubMed] [Google Scholar]
- 18.Neidhardt FC, Curtiss R. Escherichia coli and Salmonella:cellular and molecular biology. 2nd. ASM Press; Washington, D.C: 1996. [Google Scholar]
- 19.Ishihama Y, Schmidt T, Rappsilber J, Mann M, Hartl FU, Kerner MJ, Frishman D. BMC Genomics. 2008;9:102. doi: 10.1186/1471-2164-9-102. [DOI] [PMC free article] [PubMed] [Google Scholar]
- 20.Snijders APL, de Vos MGJ, Wright PC. J Proteome Res. 2005;4:578–585. doi: 10.1021/pr0497733. [DOI] [PubMed] [Google Scholar]
- 21.Nelson CJ, Huttlin EL, Hegeman AD, Harms AC, Sussman MR. Proteomics. 2007;7:1279–1292. doi: 10.1002/pmic.200600832. [DOI] [PubMed] [Google Scholar]
- 22.Bunner A, Trauger S, Siuzdak G, Williamson J. Anal Chem. 2008 doi: 10.1021/ac8020505. [DOI] [PMC free article] [PubMed] [Google Scholar]
- 23.Sperling E, Bunner AE, Sykes MT, Williamson JR. Anal Chem. 2008;80:4906–4917. doi: 10.1021/ac800080v. [DOI] [PMC free article] [PubMed] [Google Scholar]
- 24.Thomas MS, Bedwell DM, Nomura M. J Mol Biol. 1987;196:333–345. doi: 10.1016/0022-2836(87)90694-2. [DOI] [PubMed] [Google Scholar]
- 25.Mattheakis L, Vu L, Sor F, Nomura M. Proc Natl Acad Sci USA. 1989;86:448–452. doi: 10.1073/pnas.86.2.448. [DOI] [PMC free article] [PubMed] [Google Scholar]
- 26.Held WA, Ballou B, Mizushima S, Nomura M. J Biol Chem. 1974;249:3103–3111. [PubMed] [Google Scholar]
- 27.Herold M, Nierhaus KH. J Biol Chem. 1987;262:8826–8833. [PubMed] [Google Scholar]
- 28.Marvaldi J, Pichon J, Delaage M, Marchis-Mouren G. J Mol Biol. 1974;84:83–96. doi: 10.1016/0022-2836(74)90213-7. [DOI] [PubMed] [Google Scholar]
- 29.Lindahl L. J Mol Biol. 1975;92:15–37. doi: 10.1016/0022-2836(75)90089-3. [DOI] [PubMed] [Google Scholar]
- 30.Aseev LV, Levandovskaya AA, Tchufistova LS, Scaptsova NV, Boni IV. RNA. 2008;14:1882–1894. doi: 10.1261/rna.1099108. [DOI] [PMC free article] [PubMed] [Google Scholar]
- 31.Lupski JR, Godson GN. Bioessays. 1989;10:152–157. doi: 10.1002/bies.950100504. [DOI] [PubMed] [Google Scholar]
Associated Data
This section collects any data citations, data availability statements, or supplementary materials included in this article.