

Abstract
Study Objectives:
Benzodiazepine (BDZ) and non-benzodiazepine (NBDZ) hypnotics enhance GABAergic transmission and are widely used for the treatment of insomnia. In the pontine reticular formation (PRF), GABA inhibits rapid eye movement (REM) sleep and acetylcholine (ACh) release. No previous studies have characterized the effects of BDZ and NBDZ hypnotics on ACh release in the PRF. This study tested 2 hypotheses: (1) that microdialysis delivery of zolpidem, eszopiclone, and diazepam to rat PRF alters ACh release in PRF and electroencephalographic (EEG) delta power and (2) that intravenous (IV) administration of eszopiclone to non-anesthetized rat alters ACh release in the PRF, sleep, and EEG delta power.
Design:
A within- and between-groups experimental design.
Setting:
University of Michigan.
Patients or Participants:
Adult male Crl:CD*(SD) (Sprague-Dawley) rats (n = 57).
Interventions:
In vivo microdialysis of the PRF in rats anesthetized with isoflurane was used to derive the concentration-response effects of zolpidem, eszopiclone, and diazepam on ACh release. Chronically instrumented rats were used to quantify the effects of eszopiclone (3 mg/kg, IV) on ACh release in the PRF, sleep-wake states, and cortical EEG power.
Measurements and Results:
ACh release was significantly increased by microdialysis delivery to the PRF of zolpidem and eszopiclone but not diazepam. EEG delta power was increased by zolpidem and diazepam but not by eszopiclone administered to the PRF. Eszopiclone (IV) decreased ACh release in the PRF of both anesthetized and non-anesthetized rats. Eszopiclone (IV) prevented REM sleep and increased EEG delta power.
Conclusion:
The concentration-response data provide the first functional evidence that multiple GABAA receptor subtypes are present in rat PRF. Intravenously administered eszopiclone prevented REM sleep, decreased ACh release in the PRF, and increased EEG delta power. The effects of eszopiclone are consistent with evidence that ACh release in the PRF is lower during NREM sleep than during REM sleep, and with data showing that cholinergic stimulation of the PRF activates the cortical EEG.
Citation:
Hambrecht-Wiedbusch VS; Gauthier EA; Baghdoyan HA; Lydic R. Benzodiazepine receptor agonists cause drug-specific and state-specific alterations in EEG power and acetylcholine release in rat pontine reticular formation. SLEEP 2010;33(7):909-918.
Keywords: GABAA receptor, zolpidem, eszopiclone, diazepam, microdialysis
INSOMNIA IS THE MOST COMMON SLEEP DISORDER AND HAS A DIRECT IMPACT ON PUBLIC HEALTH AND QUALITY OF LIFE.1–3 BENZODIAZEPINE (BDZ) AND non-benzodiazepine (NBDZ) hypnotics are commonly used to treat insomnia. These hypnotics have specific binding sites on the ionotropic γ-aminobutyric acid type A (GABAA) receptor complex, and they decrease neuronal excitability by enhancing the inhibitory effect of endogenous GABA.4 Different BDZ and NBDZ hypnotics show different affinities for various GABAA receptor subtypes. Although these hypnotics improve total sleep time,2,3,5–7 some of these drugs are associated with risk for tolerance and dependence and can cause next-day drowsiness, impaired memory, or rebound insomnia.8–10 Despite widespread use, the mechanisms by which BDZ and NBDZ hypnotics alter chemical neurotransmission in brain regions regulating sleep remain poorly understood.
Cholinergic transmission in the pontine reticular formation (PRF) contributes to the generation of rapid eye movement (REM) sleep and to activation11 of the cortical electroencephalogram (EEG), which is characteristic of both wakefulness and REM sleep.12,13 Acetylcholine (ACh) release in the PRF is greater during REM sleep than during non-REM (NREM) sleep and wakefulness.14 Enhancing cholinergic neurotransmission in the PRF increases REM sleep in cat,15 rat,16–19 and mouse.20–22 GABAergic transmission in the PRF inhibits REM sleep23–25 and ACh release,26 but no previous in vivo studies have characterized the effects of BDZ and NBDZ hypnotics on ACh release in the PRF. The present study had 2 goals. The first was to test the hypothesis that microdialysis delivery to the PRF of the BDZ diazepam and the NBDZ hypnotics zolpidem and eszopiclone differentially alters ACh release and EEG delta power. The second goal was to test the hypothesis that intravenous (IV) administration of eszopiclone alters ACh release in the PRF, sleep, and EEG delta power. Portions of these data have been presented as abstracts.27,28
MATERIALS AND METHODS
All experiments were approved by the University of Michigan Committee on Use and Care of Animals and were conducted in accordance with the Public Health Service Policy on Humane Use and Care of Laboratory Animals (National Institutes of Health Publication 80-23). Adult male Crl:CD*(SD) (Sprague-Dawley) rats (n = 57) purchased from Charles River Laboratories (Wilmington, MA) were housed in identical chambers under a 12-hour:12-hour light:dark cycle with continuous access to food and water. As described below, 3 different experimental designs (Figure 1A-C) were used to achieve the goals of the present studies.
Figure 1.

Study design. A-C. Schematic time lines illustrating procedures for each of the three sets of studies. Text above the horizontal time line describes the sequence of manipulations performed during each experiment. Text below the time line indicates when the dependent measures were obtained. For studies 1 and 2, data were collected from anesthetized rats. Measures of electroencephalographic (EEG) power and/or acetylcholine (ACh) release in the pontine reticular formation (PRF) were obtained while (A) drugs were delivered to the PRF via microdialysis or (B) eszopiclone was delivered systemically via an intravenous (i.v.) catheter. A third set of experiments (C) was conducted using intact, non-anesthetized rats while measuring ACh release in the PRF and EEG power before and after i.v. injection of eszopiclone. D. Coronal diagram modified from a rat brain atlas36 illustrates microdialysis probe placement in the PRF. The dialysis membrane is drawn to scale (1 mm length, 0.24 mm diameter). The schematic above the right cortex illustrates electrodes for recording the EEG. E. The chromatogram shows a representative ACh peak during dialysis with Ringer's solution (control) and indicates the typical signal-to-noise ratio. The blackened area under the curve corresponds to 0.19 pmol ACh obtained during 12.5 min of microdialysis in the PRF. JVC refers to jugular-vein catheter.
Study 1: Measurement of ACh Release in the PRF During Drug Delivery to the PRF of Anesthetized Rats
ACh release in the PRF varies across states of sleep and wakefulness.14 Therefore, to test the hypothesis that zolpidem, eszopiclone, and diazepam differentially alter ACh release in the PRF, it was necessary to hold levels of arousal constant using isoflurane anesthesia (Figure 1A). The value of this approach for revealing concentration-response relationships that permit inferences about receptor mediation is well demonstrated.29–34
Application of these methods to studies of rat has been described.33,35 Briefly, rats were anesthetized with 4% isoflurane in 100% oxygen, then moved to a Kopf Model 962 stereotaxic frame (David Kopf Instruments, Tujunga, CA) equipped with a Kopf Model 920 rat adaptor, anesthesia mask, and ear bars. Delivered isoflurane concentration was decreased to 2.5% and measured continuously by spectrometry (Cardiocap™/5, Datex-Ohmeda, Louisville, CO). Core body temperature was measured by a rectal thermometer and was maintained between 36°C and 38°C. The skull was exposed, and a CMA/11 microdialysis probe (CMA Microdialysis, Stockholm, Sweden) was aimed for the PRF at stereotaxic coordinates 8.4 mm posterior to bregma, 1.0 mm lateral to the midline, and 9.4 mm ventral to the skull surface36 (Figure 1D). Isoflurane concentration was reduced and maintained at 1.5%.
Three cortical EEG electrodes were constructed from 0.13 mm diameter stainless-steel wire (California Fine Wire, Grover City, CA) and implanted at the following stereotaxic coordinates: (1) 1.5 mm lateral to the midline and 1.0 mm anterior to bregma, (2) 1.27 mm lateral to the midline and 2.0 mm posterior to bregma, and (3) 1.5 mm lateral to the midline and 2.0 mm posterior to bregma. Two of these 3 electrodes were chosen for use based on the signal-to-noise ratio, and the EEG was recorded differentially throughout the entire microdialysis sampling period.
Fast Fourier transform (FFT) analysis of the cortical EEG has been described in detail.34,37,38 The amplified and filtered (Grass amplifier Model P511K, West Warwick, RI) EEG signal was digitized and recorded at a sampling rate of 128 Hz using Spike2 software (Cambridge Electronic Design, Cambridge, UK). EEG power was evaluated in 0.5 Hz increments for EEG frequencies ranging from 0.5 to 25 Hz. For each experiment, EEG power was computed in 10-second bins every 250 seconds. Groups of three 10-second bins of EEG recordings were averaged during collection of each dialysis sample. Average EEG power measured during dialysis with Ringer's solution was compared with the average EEG power measured during dialysis delivery of a drug, and a plot of the EEG power spectrum for each animal was created. EEG power spectra were expressed as an average measured from 3 rats during PRF dialysis delivery of each drug. FFT analyses were limited to the 100 μM concentration of zolpidem, eszopiclone, and diazepam.
Microdialysis probes had a cuprophane membrane of 1 mm length, 0.24 mm diameter, and a molecular cutoff of 6,000 Daltons. Dialysis probes were perfused continuously with Ringer's solution (147 mM NaCl, 2.4 mM CaCl2, 4.0 mM KCl, 10 μM neostigmine, and 1% dimethylsulfoxide (DMSO), pH 6.0 ± 0.2) at a flow rate of 2.0 μL/minute using a CMA/400 syringe pump. Salts used for Ringer's solution were purchased from Fisher Scientific (Pittsburgh, PA).
Dialysis samples were collected every 12.5 minutes (25 μL/sample) for subsequent quantification of ACh release. Respiratory rate and body temperature were recorded every 12.5 minutes. A CMA/110 liquid switch was used to begin dialysis with Ringer's solution containing 1 concentration of zolpidem (10, 30, 100, or 1000 μM; Sigma-Aldrich, St. Louis, MO), eszopiclone (10, 30, 100, 300, or 1000 μM; Sepracor Inc., Marlborough, MA and Toronto Research Chemicals, Toronto, Canada), or diazepam (10, 30, 100, 300, or 1000 μM; Sigma-Aldrich). Dialysis membranes of CMA/11 probes are estimated to deliver about 5% of a drug concentration used to perfuse the probe. Thus, estimated drug concentrations delivered to the PRF ranged from approximately 0.5 to 50 μM. Zolpidem, eszopiclone, and diazepam were dissolved in DMSO and diluted in Ringer's solution. The final dilution used for dialysis contained 1% DMSO. Each 25-μL dialysis sample was injected into a high performance liquid chromatography system with electrochemical detection (HPLC/ED, Bioanalytical Systems, West Lafayette, IN). Chromatograms (Figure 1E) were digitized and quantified using Chromgraph Software (Bioanalytical Systems) in reference to ACh standards.
After each experiment, the dialysis probe was withdrawn from the brain, the scalp incision was closed, and anesthesia was discontinued. Animals were removed from the stereotaxic frame and kept under observation until they were ambulatory. A within-subjects design was used for individual experiments in which 5 microdialysis samples were obtained during microdialysis with Ringer's solution (control) and 5 samples were collected during microdialysis using Ringer's solution containing drug. Only 1 concentration of 1 drug was tested per rat, and a between-subjects design was used to statistically evaluate the effects of different drug concentrations on ACh release. Using this within- and between-subject experimental design, 42 rats provided a robust test of the hypothesis that ACh release varies as a function of drug concentration. Additional studies using data from 9 rats were adequately powered to test the hypothesis that delivery of zolpidem, eszopiclone, and diazepam to the PRF alters cortical EEG activity.
Recovery of ACh by each dialysis probe was measured in vitro before and after every experiment. The results are from studies in which there was no significant difference between pre-experiment and post-experiment probe recoveries. Thus, changes in measured ACh were not an artifact of the dialysis membrane and can be attributed to the administered drugs.
Study 2: Measurement of ACh Release in the PRF Before and After IV Administration of Eszopiclone to Anesthetized Rats
Procedures for study 2 (Figure 1B) were similar to those of study 1 except that prior to positioning a dialysis probe in the PRF (n = 3 rats) a catheter (Micro-Renathane tubing, MRE −040, Braintree Scientific, Braintree, MA) was inserted into a jugular vein to permit systemic eszopiclone administration. As schematized by Figure 1B, control levels of ACh release were quantified using 5 microdialysis samples from each rat. Eszopiclone (3 mg/kg; 1 mL) was then injected via the jugular-vein catheter (200 μL/min) and 5 additional microdialysis samples were collected for measuring ACh release.
Study 3: Measurement of ACh Release in the PRF Before and After IV Administration of Eszopiclone to Awake Behaving Rats
Rats (n = 3) in study 3 (Figure 1C) were implanted with a jugular-vein catheter that was tunneled subcutaneously for exteriorization between the scapula. A guide cannula (8I313000BM10, Plastics One, Roanoke, VA) closed with a screw-in cap (8IC313DCCACC, Plastics One) secured the scapula end of the catheter. A 5-mm long cannula (CMA/11 guide cannula) was positioned above the PRF at stereotaxic coordinates 8.4 mm posterior to bregma, 1.2 mm lateral to bregma, and 3.2 mm ventral to the skull. Three electrodes for recording the cortical EEG were implanted as described for study 1. Another pair of electrodes (4 cm AG 7/40T Medwire, Mt. Vernon, NY) was implanted in the dorsal neck muscles to record the electromyogram (EMG). Three stainless-steel anchor screws (MPX-0080-02-C, Small Parts Inc., Miami Lakes, FL) were placed in the skull, and the EEG and EMG electrodes were plugged into a plastic multichannel electrode pedestal (8K00022980IF, Plastics One). The entire array of electrodes was secured to the skull with dental acrylic (Lang's Jet Acrylic, Lang Dental Mfg. Co., Wheeling, WV), and the animals were allowed 1 week to recover from the surgery.
After recovery, rats were conditioned to being housed in a Plexiglas recording chamber (Raturn, Bioanalytical Systems) with ad libitum access to food and water. While rats were in the chamber, the electrode pedestal was connected by a cable (3633-441/six 80CM 6TCM, Plastics One) to amplifiers and a computer. The digitized EEG and EMG signals and movement were used to score 10-second epochs of each recording as wakefulness, NREM sleep, or REM sleep via Icelus Data Acquisition Software, as described previously.33 After conditioning, rats were allowed to sleep and wake spontaneously to obtain recordings of sleep and wakefulness prior to drug administration.
During the experiments illustrated by Figure 1C, a microdialysis probe was inserted into the PRF and perfused continuously with Ringer's solution (2 μL/min). A syringe containing eszopiclone (3 mg/kg) was connected to the implanted catheter via a 55-cm length of tubing. Venous access via this long tubing made subsequent eszopiclone injections possible without handling the animals. Microdialysis samples were collected every 12.5 minutes, and ACh release in the PRF was quantified by HPLC/ED. During the first 62.5 minutes of microdialysis, the rats were kept awake. After 5 ACh measures were obtained, eszopiclone (1 mL) was administered at a rate of 200 μL/minute, and an additional 5 dialysis samples were collected while rats were permitted to sleep and wake ad libitum. States of sleep and wakefulness were quantified as described above, and EEG power was analyzed in 10-second bins. EEG power was averaged across rats and plotted in 0.5-Hz intervals for EEG frequencies ranging from 0.5 to 25 Hz.
Histologic Analyses
Rats were anesthetized and decapitated, and brains were removed. The brainstem was frozen and cut as 40-μm thick coronal sections. Every section containing the PRF was mounted serially on glass slides. Tissue sections were dried, fixed with paraformaldehyde vapor at 80°C, and stained with cresyl violet (Figure 2B) to confirm dialysis probe placement in the PRF.
Figure 2.

Histologic confirmation of dialysis sites. A. Vertical lines on a sagittal diagram of the rat brain36 depict the anterior-posterior range of the microdialysis sites within the pontine reticular formation (PRF). B. A cresyl violet-stained coronal brain section shows a typical microdialysis site in the PRF. The arrow marks the most ventral position of the dialysis membrane. The section is approximately 8.2 mm posterior to bregma. C. The coronal plates were modified from a rat brain atlas36 to illustrate the location of microdialysis sites in the PRF. Dialysis membranes are indicated by shaded cylinders and are drawn to scale. The number under each coronal diagram indicates mm posterior to bregma.
Statistical Analyses
All data were evaluated quantitatively to confirm adequate power and to ensure that the distribution met the assumptions of the underlying statistical model. Drug effects on ACh release were analyzed using one-way analysis of variance (ANOVA) and post hoc Dunnett's multiple comparisons test, Mann-Whitney U test, or Student's t test. EEG power spectra were evaluated by repeated-measures two-way ANOVA and post hoc tests for comparison of treatment at each 0.5-Hz frequency band from 0.5 to 4.0 Hz. Statistical packages used included SAS v9.2 (SAS Institute Inc., Cary, NC), GBStat (Dynamic Microsystems, Inc., Silverspring, MD), and Prism 5 (Graph Pad Software, Inc., La Jolla, CA).
RESULTS
Microdialysis Sites Were Localized to the PRF
The serial coronal tissue sections of each brain were used to identify the stereotaxic coordinates of every microdialysis site relative to a rat brain atlas.36 The results described below are from rats (n = 57) in which the microdialysis sites were localized to the PRF (Figure 2).
Zolpidem and Eszopiclone, but not Diazepam, Caused a Concentration-Dependent Increase in ACh Release in the PRF (Study 1)
Figure 3A illustrates that microdialysis delivery of zolpidem to the PRF of isoflurane-anesthetized rat caused a concentration-dependent increase in ACh release (F4,8 = 4.28; P = 0.038). Dunnett's post hoc test revealed that zolpidem (1000 μM) significantly increased ACh release. The mean (± SEM) percentage of control ACh release during dialysis with the different concentrations of zolpidem was 3.04% (± 1.95%) for 10 μM, 0.55% (± 9.09%) for 30 μM, 16.16% (± 6.63%) for 100 μM, and 22.53% (± 3.46%) for 1000 μM. These experiments did not test 300 μM zolpidem. The small differences (∼ 6%) between changes in ACh release caused by 100 and 1000 μM zolpidem indicate that a half log-unit step to 300 μM zolpidem would not have provided additional information for interpreting the concentration-response data.
Figure 3.

Acetylcholine (ACh) release in the pontine reticular formation (PRF) and electroencephalographic (EEG) power as a function of drug administration to the PRF of isoflurane-anesthetized rat. A-C. Every concentration of each drug was tested in 3 animals, and bar graphs summarize data from 42 rats. *Indicates a significant difference from control (0 μM). A. Zolpidem caused a concentration-dependent increase in ACh release. B. The largest concentration-dependent increase in PRF ACh release was caused by microdialysis delivery of eszopiclone to the PRF. C. Diazepam had no effect on ACh release. D-F. For each of the 3 drugs, these graphs summarize EEG power averaged across 3 rats, for a total of 9 rats. Insets show representative 30-s EEG recordings during dialysis with Ringer's solution and Ringer's solution containing a drug. D. Zolpidem caused a significant (*) increase in delta power at 0.5 Hz. E. Eszopiclone did not change EEG delta power. F. Diazepam caused a significant (*) increase in delta power at 1.0 and 1.5 Hz.
Microdialysis delivery of eszopiclone to the PRF (Figure 3B) caused a concentration-dependent increase in ACh release in anesthetized rat (F5,10 = 12.10; P = 0.0006). The percentage of control ACh release during dialysis administration of eszopiclone was 2.89% (± 1.72%) for 10 μM, 0.27% (± 10.14%) for 30 μM, 93.35% (± 7.98%) for 100 μM, 169.15% (± 14.95%) for 300 μM, and 346.53% (± 157.92%) for 1000 μM.
In contrast with microdialysis delivery of zolpidem and eszopiclone, delivery of diazepam to the PRF did not change ACh release in the PRF (Figure 3C). The percentage of control ACh release during dialysis with the different concentrations of diazepam was 4.65% (± 6.86%) for 10 μM, 5.31% (± 16.48%) for 30 μM, 30.65% (± 7.47%) for 100 μM, 10.94% (± 8.53%) for 300 μM, and 14.80% (± 9.18%) for 1000 μM.
Zolpidem and Diazepam, but not Eszopiclone, Increased EEG Delta Power (Study 1)
Figures 3D to 3F illustrate EEG power spectra during dialysis administration of zolpidem, eszopiclone, and diazepam to the PRF of anesthetized animals. FFT analysis showed a significant increase in EEG delta power caused by zolpidem (Figure 3D) and diazepam (Figure 3F). No change in EEG delta power was observed during dialysis delivery of eszopiclone (Figure 3E). Two-way repeated measures ANOVA was performed across 8 EEG frequencies that ranged from 0.5 to 4.0 Hz in 0.5-Hz intervals and included 2 treatment conditions (Ringer's versus drug). This analysis revealed no frequency-by-drug interaction. Post hoc analysis comparing the means at each frequency for Ringer's versus drug indicated that delta power was significantly increased by zolpidem (0.5 Hz) and by diazepam (1.0 and 1.5 Hz).
IV Administration of Eszopiclone Decreased ACh Release in the PRF During Isoflurane Anesthesia (Study 2)
The effects of systemic eszopiclone administration on ACh release in the PRF during general anesthesia have not been previously studied. Figure 4A quantifies ACh release in the PRF of rats anesthetized with isoflurane before and after IV injection of eszopiclone. Eszopiclone caused a significant (t2 = 11.43; P = 0.0076) decrease (50.2%) in ACh release in the PRF.
Figure 4.
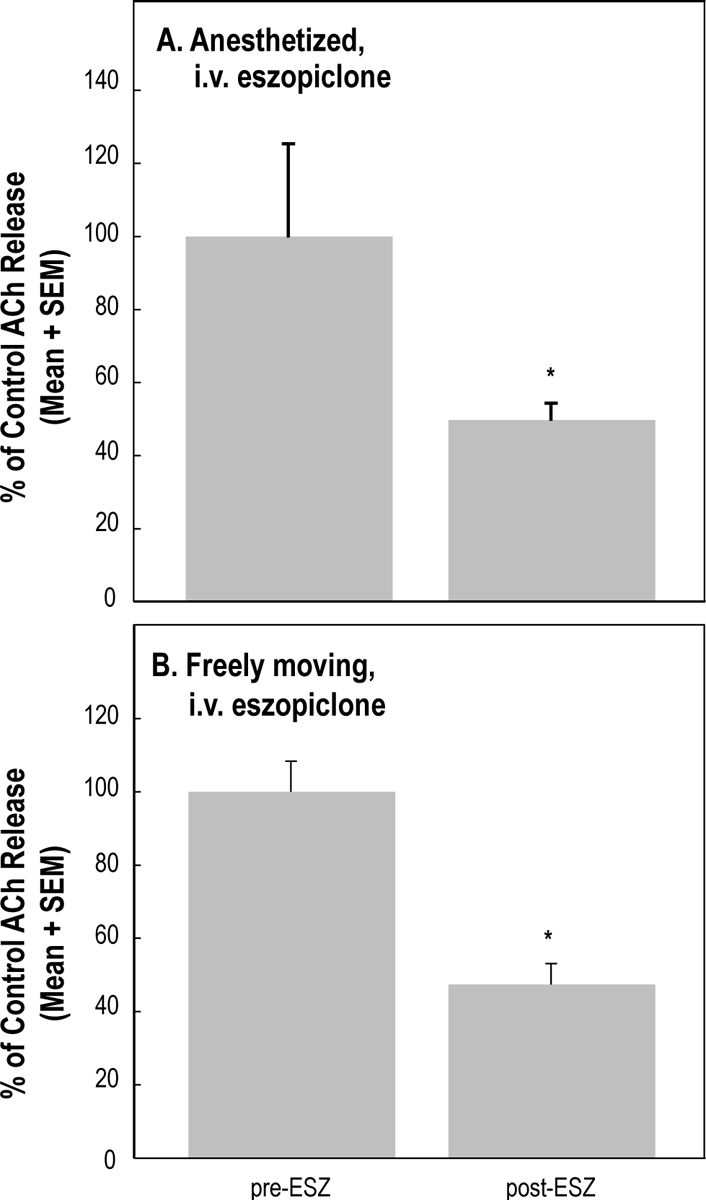
Eszopiclone (ESZ) administered intravenously (i.v.) significantly decreased acetylcholine (ACh) release in the pontine reticular formation. A. Eszopiclone (3 mg/kg) administered to isoflurane-anesthetized rats (n = 3) caused a 50.2% decrease in ACh release. B. Eszopiclone (3 mg/kg) administered to intact, freely moving rats (n = 3) caused a 52.7% decrease in ACh release.
IV Administration of Eszopiclone to Awake Behaving Rat Decreased ACh Release in the PRF, Increased EEG Delta Power, and Eliminated REM Sleep (Study 3)
ACh release in the PRF was significantly (t2 = 9.49; P = 0.0109) decreased (52.7%) by IV administration of eszopiclone (Figure 4B) to awake rats. Figure 5 summarizes the effects of IV administration of eszopiclone on EEG power across states of wakefulness and sleep. FFT analysis revealed an increase in EEG delta power during wakefulness (Figure 5A) and NREM sleep (Figure 5B). Two-way repeated measures ANOVA across 8 EEG frequency bands, ranging from 0.5 to 4 Hz in 0.5-Hz increments, and 2 treatment conditions (drug versus no drug) revealed an eszopiclone-by-frequency interaction for wakefulness (F7,14 = 3.21; P = 0.03) and NREM sleep (F7,14 = 10.62; P = 0.0001). Post hoc analysis comparing the means at each frequency for eszopiclone versus no eszopiclone showed that delta power was significantly increased during wakefulness at 0.5 to 2 Hz and during NREM sleep at 0.5 to 1.5 Hz. There was no REM sleep following IV administration of eszopiclone. Thus, Figure 5C shows REM sleep data obtained only during control (no drug) recordings.
Figure 5.

Average electroencephalographic (EEG) power spectra during microdialysis with Ringer's solution in freely moving rat before and after intravenous (i.v.) eszopiclone administration. Each power spectrum is an average from the same 3 rats used to obtain acetylcholine (ACh) release measures (Figure 4B). Insets show representative 10-s EEG recordings after i.v. administration of eszopiclone or during no drug treatment. EEG delta power was significantly (*) increased during (A) wakefulness (0.5 to 2 Hz) and (B) non-rapid eye movement (NREM) sleep (0.5 to 1.5 Hz). C. Rats did not have rapid eye movement (REM) sleep after i.v. administration of eszopiclone.
DISCUSSION
The results show for the first time that microdialysis delivery of zolpidem, eszopiclone, and diazepam to the PRF of isoflurane-anesthetized rat differentially altered ACh release and EEG delta power. Zolpidem and eszopiclone each caused a concentration-dependent increase in ACh release in the PRF, whereas diazepam did not alter ACh release (Figures 3A-C). EEG delta power was significantly increased by zolpidem and diazepam but not by eszopiclone (Figures 3D-F). Based on the fact that these 3 drugs have different affinities for different GABAA receptor subunits (Figure 6), the Figure 3 findings provide novel functional support for the interpretation that the PRF contains multiple GABAA receptor subtypes. Systemic administration of eszopiclone decreased ACh release in the PRF (Figure 4), increased EEG delta power (Figure 5), and blocked the occurrence of REM sleep. These data are consistent with the well-known role of pontine cholinergic neurotransmission promoting REM sleep12 and cortical EEG activation.11 A final key point is that IV delivery of eszopiclone decreased ACh release in the PRF of both anesthetized and non-anesthetized rat (Figure 4). This finding demonstrates that isoflurane does not confound measures of ACh release and emphasizes the usefulness of isoflurane for holding arousal state constant in order to evaluate drug effects on transmitter release.
Figure 6.

Schematic views of the GABAA receptor and subunit binding affinities. A. The pentameric GABAA receptor is shown spanning a cell membrane bilayer. B. View of the GABAA receptor from above schematizes the chloride ion channel surrounded by α, β, and γ subunits. C. Zolpidem displays the greatest binding affinity for the α1 subunit and very low affinity for the α5 subunit. D. Binding affinities have been measured for zopiclone but not for eszopiclone (s-isomer of zopiclone). The question mark indicates that eszopiclone is assumed to have binding affinities similar to those of zopiclone. The highest affinities are observed for the α1 and α3 subunits, with slightly lower affinities for α5 and α2 subunits. E. Diazepam shows an affinity profile of α1 = α2 = α5 > α3. The key at the bottom indicates binding affinity (nM) for the different α subunits of human recombinant GABAA receptors comprising α1 to α5 and β3γ2 subunits (data from Table 2 of Smith et al.46). These affinity profiles and the acetylcholine release data (Figure 3) indicate that α subunits of the GABAA receptor are present in the pontine reticular formation of Sprague-Dawley rat.
Diversity of GABAA Receptor Subtypes and Differential Binding Affinities of BDZ and NBDZ Hypnotics
An estimated 25% to 50% of all synapses in the central nervous system are GABAergic.39 To date, 19 different GABAA receptor subunits have been identified (α1-6, β1-3, γ1-3, δ, ε, θ, π, ρ1-3). The major GABAA receptor subtypes expressed in the rat brain are α1β2γ2, α3β3γ2, and α2β3γ2.40 Within the PRF (Figure 2), the α1 is the most abundant subunit, followed by α3, then α2, and only a few α5 subunits.41 Classic BDZ binding sites are found mainly on GABAA receptors composed of 2 α subunits, 2 β subunits, and one γ2 subunit. The BDZ site is located at the interface of the γ2 subunit and the respective α subunit (α1, α2, α3, α5).42–45 All of these α subunits have a histidine residue in the drug-binding domain, resulting in a high affinity for BDZs, such as diazepam. In contrast, α4 and α6 subunits contain an arginine residue and do not show affinity for BDZs.40,43
The present findings that BDZ and NBDZ hypnotics differentially alter ACh release in the PRF and EEG delta power (Figure 3) raise the question of the extent to which the results reflect different in vivo affinities for α subunits of GABAA receptors in the PRF. Figure 6 summarizes data from in vitro studies indicating different affinities of BDZ and NBDZ hypnotics for α subunits. Zolpidem has a very high affinity for the α1 subunit, medium affinity for the α2 subunit, low affinity for the α3, and nearly no affinity for the α5 subunit.46 Binding affinities have been measured for zopiclone but have not been fully described for its (s)-enantiomer eszopiclone.46 In view of the many similarities between the racemic zopiclone and its active stereoisomer eszopiclone,47 it is possible that the binding affinities are also similar. Zopiclone has high affinity for the α1 and α3 subunits and moderate affinity for the α2 and α5 subunits. Diazepam has high affinity for the α1, α2, and α5 subunits and medium affinity for the α3 subunit.46
BDZ Receptor Agonists Differentially Altered ACh Release and EEG Delta Power in Anesthetized Rat
Zolpidem and eszopiclone are both NBDZ hypnotics that differentially altered ACh release in the PRF (Figure 3A-C). At equimolar concentrations (1000 μM), eszopiclone caused a greater increase in ACh release than did zolpidem suggesting greater efficacy for eszopiclone than for zolpidem. In contrast with the NBDZ hypnotics, the BDZ diazepam caused no change in ACh release. Within the PRF, the α subunit-binding affinities are distributed as α1 > α3 > α2 > α5,41 which is very similar to the α-subunit affinity of zopiclone (α1 = α3 > α2 = α5) and only slightly different from the α-subunit affinity of zolpidem (α1 ≫ α2 > α3 > α5).46 In addition, eszopiclone has only 1 binding-site orientation, whereas zolpidem can bind in multiple orientations,48 potentially resulting in greater binding of zolpidem. Diazepam exhibits very similar affinities for all α subunits,46 possibly activating more and/or different GABAA receptor subtypes within the PRF. All 3 drugs used in the present study show high affinity for the α1 subunit. This raises the question of whether the effects summarized by Figure 3 resulted from a specific combination of binding affinities or from different downstream effects of activating GABAA receptors.
The increase in EEG delta power (Figures 3D-F) caused by administration of zolpidem and diazepam to the PRF is consistent with studies in mice showing that intraperitoneal49 and PRF50 administration of the GABAA-receptor agonist muscimol increases EEG delta power. GABAA receptors containing the α2 subunit modulate the EEG recorded during sleep after administration of diazepam.51 Eszopiclone, in contrast, did not cause a change in EEG delta power. Zopiclone shows higher affinity for the α3 subunit than does diazepam (Figure 6). The present EEG data are consistent with the findings of an increase in NREM sleep and an increase in the magnitude and percentage of EEG delta power caused by zolpidem.52
Previous in vivo studies51,53 have successfully used transgenic mice to establish links between sleep phenotypes and GABAA subunits. The present results are the first from wild-type Sprague-Dawley rat to show that zolpidem, eszopiclone, and diazepam differentially alter ACh release in the PRF (Figure 3A-C). These different actions of BDZ and NBDZ hypnotics may be due, in part, to the fact that within the PRF there is a heterogeneous distribution of α subunits comprising GABAA receptors. At least 3 lines of evidence support this interpretation. First, within rat PRF, the α1 subunit is the most abundant and the α5 subunit is the least abundant.41 Second, recent immunohistochemical data have identified a column of GABAergic neurons running through the pons and midbrain that project to the oral part of the PRF.54 Third, the different effects of BDZ and NBDZ hypnotics (Figure 3) may reflect different α-subunit-binding affinities of GABAA receptors (Figure 6).
IV Eszopiclone Administration Decreased ACh Release in the PRF and Increased EEG Delta Power
Comparing the effects of a drug delivered to a specific brain region with the effects of the same drug delivered systemically permits novel inferences regarding site of drug action.32,55 Therefore, the third set of experiments examined the effects of IV administration of eszopiclone on EEG delta power and on ACh release in the PRF. Eszopiclone increased EEG delta power during NREM sleep. These data (Figure 5B) are consistent with studies of guinea pig, in which systemic administration of eszopiclone increased NREM sleep and EEG delta power.56 Comparing the effects of microdialysis delivery of eszopiclone to the PRF with the effects of IV delivery supports the interpretation that the sedative/hypnotic effect of eszopiclone is not mediated directly at the level of the PRF. NBDZ hypnotics increase NREM sleep in rodents,56,57 as they do in humans.58 The finding that IV eszopiclone decreased ACh release in the PRF is consistent with microdialysis data showing that ACh release in the PRF is lower during NREM sleep than during REM sleep.59,60 The laterodorsal and pedunculopontine tegmental nuclei (LDT/PPT) comprise a likely brain region through which systemically administered eszopiclone acts to decrease ACh release in the PRF. Cholinergic cells in the LDT/PPT project to the PRF,61 electrical stimulation of the LDT/PPT increases ACh release in the PRF,62 and there is evidence that eszopiclone may exert sedative/hypnotic effects, in part, by potentiating GABAA inhibition of PPT neurons.63 Such inhibition by eszopiclone would be anticipated to diminish ACh release from PPT neuron terminals in the PRF. This interpretation is compatible with the decreased ACh release in PRF caused by IV eszopiclone (Figure 4).
Limitations and Conclusion
The physiologic and pharmacologic mechanisms by which BDZ and NBDZ hypnotics increase sleep remain incompletely understood. Challenges include the facts that GABAA receptors exist as multiple subtypes, resulting in a variety of possible receptor subtypes that are differentially distributed throughout the brain and that have different affinities for the same drugs (Figure 6). The present results also are limited to studies of a single brain region. GABAA receptor subtypes are widely distributed throughout brain regions known to have diverse functions.64,65 Even with the foregoing limitations, the different effects of BDZ and NBDZ hypnotics on ACh release and EEG power (Figures 3–5) provide novel functional evidence for the presence of multiple GABAA receptor subtypes in rat PRF. This is essential information for studies aiming to elucidate the cellular mechanisms by which BDZ and NBDZ hypnotics promote sleep.
The clinical importance of GABAA receptors as drug targets39 and the potential for undesirable side effects66–68 encourage future studies. Additional research comparing systemic and central drug administration can characterize the effects of BDZ and NBDZ hypnotics on ACh release in basal forebrain32 and prefrontal cortical38,69 regions that contribute to the regulation of sleep.
DISCLOSURE STATEMENT
This study was funded in part by a grant from Sepracor, Inc. The authors indicated no other financial conflicts of interest.
ACKNOWLEDGMENTS
Supported, in part, by a grant from Sepracor, Inc. R Lydic and HA Baghdoyan were also supported by National Institutes of Health grants HL40881, HL57120, HL65272, and MH45361 and by the Department of Anesthesiology. VS Hambrecht-Wiedbusch was supported by the Department of Anesthesiology. We thank K Bowler, S Jiang, and MA Norat for expert assistance. For statistical consultation we thank K Welch of the University of Michigan Center for Statistical Consultation and Research.
Footnotes
A commentary on this article appears in this issue on page859.
REFERENCES
- 1.Buysee DJ, Ancoli-Israel S, Edinger JD, Lichstein KL, Morin CM. Recommendations for a standard research assessment of insomnia. Sleep. 2006;29:1155–73. doi: 10.1093/sleep/29.9.1155. [DOI] [PubMed] [Google Scholar]
- 2.NIH-Statement. National Institutes of Health state of the science conference statement on manifestations and management of chronic insomnia in adults, June 13-15, 2005. Sleep. 2005;28:1049–57. doi: 10.1093/sleep/28.9.1049. [DOI] [PubMed] [Google Scholar]
- 3.Walsh JK, Krystal AD, Amato DA, et al. Nightly treatment of primary insomnia with eszopiclone for six months: effect on sleep, quality of life, and work limitations. Sleep. 2007;30:959–68. doi: 10.1093/sleep/30.8.959. [DOI] [PMC free article] [PubMed] [Google Scholar]
- 4.Whiting PJ, Bonnert TP, McKernan RM, et al. Molecular and functional diversity of the expanding GABA-A receptor gene family. Ann N Y Acad Sci. 1999;868:645–53. doi: 10.1111/j.1749-6632.1999.tb11341.x. [DOI] [PubMed] [Google Scholar]
- 5.Krystal AD. Treating the health, quality of life, and functional impairments in insomnia. J Clin Sleep Med. 2007;3:63–72. [PubMed] [Google Scholar]
- 6.Roth T, Walsh JK, Krystal A, Wessel T, Roehrs TA. An evaluation of the efficacy and safety of eszopiclone over 12 months in patients with chronic primary insomnia. Sleep Med. 2005;6:487–95. doi: 10.1016/j.sleep.2005.06.004. [DOI] [PubMed] [Google Scholar]
- 7.Leger D, Scheuermaier K, Philip P, Paillard M, Guilleminault C. SF-36: evaluation of quality of life in severe and mild insomniacs compared with good sleepers. Psychosom Med. 2001;63:49–55. doi: 10.1097/00006842-200101000-00006. [DOI] [PubMed] [Google Scholar]
- 8.Ashton H. Guidelines for the rational use of benzodiazepines. When and what to use. Drugs. 1994;48:25–40. doi: 10.2165/00003495-199448010-00004. [DOI] [PubMed] [Google Scholar]
- 9.Grunstein R. Insomnia. Diagnosis and management. Aust Fam Physician. 2002;31:995–1000. [PubMed] [Google Scholar]
- 10.Holbrook AM, Crowther R, Lotter A, Cheng C, King D. Meta-analysis of benzodiazepine use in the treatment of insomnia. CMAJ. 2000;162:225–33. [PMC free article] [PubMed] [Google Scholar]
- 11.Kanai T, Szerb JC. Mesencephalic reticular activating system and cortical acetylcholine output. Nature. 1965;205:80–2. doi: 10.1038/205080b0. [DOI] [PubMed] [Google Scholar]
- 12.Lydic R, Baghdoyan HA. Acetylcholine modulates sleep and wakefulness: a synaptic perspective. In: Monti JM, Pandi-Perumal SR, Sinton CM, editors. Neurochemistry of sleep and wakefulness. Cambridge: Cambridge University Press, ; 2008. pp. 109–43. [Google Scholar]
- 13.Lydic R, Baghdoyan HA. Sleep, anesthesiology, and the neurobiology of arousal state control. Anesthesiology. 2005;103:1268–95. doi: 10.1097/00000542-200512000-00024. [DOI] [PubMed] [Google Scholar]
- 14.Leonard TO, Lydic R. Pontine nitric oxide modulates acetylcholine release, rapid eye movement sleep generation, and respiratory rate. J Neurosci. 1997;17:774–85. doi: 10.1523/JNEUROSCI.17-02-00774.1997. [DOI] [PMC free article] [PubMed] [Google Scholar]
- 15.Baghdoyan HA, Monaco AP, Rodrigo-Angulo ML, Assens F, McCarley RW, Hobson JA. Microinjection of neostigmine into the pontine reticular formation of cats enhances desynchronized sleep signs. J Pharmacol Exp Ther. 1984;231:173–80. [PubMed] [Google Scholar]
- 16.Bourgin P, Escourrou P, Gaultier C, Adrien J. Induction of rapid eye movement sleep by carbachol infusion into the pontine reticular formation in the rat. Neuroreport. 1995;6:532–6. doi: 10.1097/00001756-199502000-00031. [DOI] [PubMed] [Google Scholar]
- 17.Imeri L, Bianchi S, Angeli P, Mancia M. Selective blockade of different brain stem muscarinic receptor subtypes: effects on the sleep-wake cycle. Brain Res. 1994;636:68–72. doi: 10.1016/0006-8993(94)90176-7. [DOI] [PubMed] [Google Scholar]
- 18.Marks GA, Birabil CG. Enhancement of rapid eye movement sleep in the rat by cholinergic and adenosinergic agonists infused into the pontine reticular formation. Neuroscience. 1998;86:29–37. doi: 10.1016/s0306-4522(98)00005-0. [DOI] [PubMed] [Google Scholar]
- 19.Shiromani PJ, Fishbein W. Continuous pontine cholinergic microinfusion via mini-pump induces sustained alterations in rapid eye movement (REM) sleep. Pharmacol Biochem Behav. 1986;25:1253–61. doi: 10.1016/0091-3057(86)90120-6. [DOI] [PubMed] [Google Scholar]
- 20.Douglas CL, Bowman GN, Baghdoyan HA, Lydic R. C57BL/6J and B6.V-LEPOB mice differ in the cholinergic modulation of sleep and breathing. J Appl Physiol. 2005;98:918–29. doi: 10.1152/japplphysiol.00900.2004. [DOI] [PubMed] [Google Scholar]
- 21.Coleman CG, Lydic R, Baghdoyan HA. M2 muscarinic receptors in pontine reticular formation of C57BL/6J mouse contribute to rapid eye movement sleep generation. Neuroscience. 2004;126:821–30. doi: 10.1016/j.neuroscience.2004.04.029. [DOI] [PubMed] [Google Scholar]
- 22.Lydic R, Douglas CL, Baghdoyan HA. Microinjection of neostigmine into the pontine reticular formation of C57BL/6J mouse enhances rapid eye movement sleep and depresses breathing. Sleep. 2002;25:835–41. doi: 10.1093/sleep/25.8.835. [DOI] [PubMed] [Google Scholar]
- 23.Sanford LD, Tang X, Xiao J, Ross RJ, Morrison AR. GABAergic regulation of REM sleep in reticularis pontis oralis and caudalis in rats. J Neurophysiol. 2003;90:938–45. doi: 10.1152/jn.00993.2002. [DOI] [PubMed] [Google Scholar]
- 24.Xi MC, Morales FR, Chase MH. Evidence that wakefulness and REM sleep are controlled by a GABAergic pontine mechanism. J Neurophysiol. 1999;82:2015–9. doi: 10.1152/jn.1999.82.4.2015. [DOI] [PubMed] [Google Scholar]
- 25.Marks GA, Sachs OW, Birabil CG. Blockade of GABA, type A, receptors in the rat pontine reticular formation induces rapid eye movement sleep that is dependent upon the cholinergic system. Neuroscience. 2008;156:1–10. doi: 10.1016/j.neuroscience.2008.06.067. [DOI] [PMC free article] [PubMed] [Google Scholar]
- 26.Vazquez J, Baghdoyan HA. GABAA receptors inhibit acetylcholine release in cat pontine reticular formation: implications for REM sleep regulation. J Neurophysiol. 2004;92:2198–206. doi: 10.1152/jn.00099.2004. [DOI] [PubMed] [Google Scholar]
- 27.Hambrecht VS, Baghdoyan HA, Lydic R. Program No. 285.16, Neuroscience Meeting Planner. Washington, DC: Society for Neuroscience, Online; 2008. Microdialysis delivery of eszopiclone, zolpidem and diazepam to the pontine reticular formation (PRF) of rat increases PRF acetylcholine (ACh) release. [Google Scholar]
- 28.Hambrecht VS, Baghdoyan HA, Lydic R. Pontine reticular formation (PRF) administration of diazepam and zolpidem, but not eszopiclone, increases electroencephalogram (EEG) delta power in Sprague-Dawley rat. Sleep. 2009;32(Abstract Suppl):0028. [Google Scholar]
- 29.Baghdoyan HA, Lydic R, Fleegal MA. M2 muscarinic autoreceptors modulate acetylcholine release in the medial pontine reticular formation. J Pharmacol Exp Ther. 1998;286:1446–52. [PubMed] [Google Scholar]
- 30.Materi LM, Rasmusson DD, Semba K. Inhibition of synaptically evoked cortical acetylcholine release by adenosine: An in vivo microdialysis study in the rat. Neuroscience. 2000;97:219–26. doi: 10.1016/s0306-4522(00)00075-0. [DOI] [PubMed] [Google Scholar]
- 31.Douglas CL, Baghdoyan HA, Lydic R. Postsynaptic muscarinic M1 receptors activate prefrontal cortical EEG of C57BL/6J mouse. J Neurophysiol. 2002;88:3003–9. doi: 10.1152/jn.00318.2002. [DOI] [PubMed] [Google Scholar]
- 32.Osman NI, Baghdoyan HA, Lydic R. Morphine inhibits acetylcholine release in rat prefrontal cortex when delivered systemically or by microdialysis to basal forebrain. Anesthesiology. 2005;103:779–87. doi: 10.1097/00000542-200510000-00016. [DOI] [PubMed] [Google Scholar]
- 33.Watson CJ, Soto-Calderon H, Lydic R, Baghdoyan HA. Pontine reticular formation (PnO) administration of hypocretin-1 increases PnO GABA levels and wakefulness. Sleep. 2008;31:453–64. doi: 10.1093/sleep/31.4.453. [DOI] [PMC free article] [PubMed] [Google Scholar]
- 34.Vanini G, Watson CJ, Lydic R, Baghdoyan HA. γ-Aminobutyric acid-mediated neurotransmission in the pontine reticular formation modulates hypnosis, immobility, and breathing during isoflurane anesthesia. Anesthesiology. 2008;109:978–88. doi: 10.1097/ALN.0b013e31818e3b1b. [DOI] [PMC free article] [PubMed] [Google Scholar]
- 35.Zhu Z, Bowman HR, Baghdoyan HA, Lydic R. Morphine increases acetylcholine release in the trigeminal nuclear complex. Sleep. 2008;31:1629–37. doi: 10.1093/sleep/31.12.1629. [DOI] [PMC free article] [PubMed] [Google Scholar]
- 36.Paxinos G, Watson C. The Rat Brain in Stereotaxic Coordinates. Sixth ed. Elsevier; 2007. [DOI] [PubMed] [Google Scholar]
- 37.Brevig HN, Watson CJ, Lydic R, Baghdoyan HA. Wakefulness is increased by GABAA-hypocretin receptor interaction in the pontine reticular formation. Sleep. 2010 doi: 10.1093/sleep/33.10.1285. In Press. [DOI] [PMC free article] [PubMed] [Google Scholar]
- 38.Van Dort CJ, Baghdoyan HA, Lydic R. Adenosine A1 and A2A receptors in mouse prefrontal cortex modulate acetylcholine release and behavioral arousal. J Neurosci. 2009;29:871–81. doi: 10.1523/JNEUROSCI.4111-08.2009. [DOI] [PMC free article] [PubMed] [Google Scholar]
- 39.Young AB, Chu D. Distribution of GABAA and GABAB receptors in mammalian brain: potential targets for drug development. Drug Dev Res. 1990;21:161–7. [Google Scholar]
- 40.Whiting PJ. GABA-A receptor subtypes in the brain: a paradigm for CNS drug discovery? Drug Discov Today. 2003;8:445–50. doi: 10.1016/s1359-6446(03)02703-x. [DOI] [PubMed] [Google Scholar]
- 41.Fritschy JM, Mohler H. GABAA-receptor heterogeneity in the adult rat brain: differential regional and cellular distribution of seven major subunits. J Comp Neurol. 1995;359:154–94. doi: 10.1002/cne.903590111. [DOI] [PubMed] [Google Scholar]
- 42.Harrison NL. Mechanisms of sleep induction by GABAA receptor agonists. J Clin Psychiatry. 2007;68(Suppl 5):6–12. [PubMed] [Google Scholar]
- 43.Rudolph U, Crestani F, Mohler H. GABAA receptor subtypes: dissecting their pharmacological functions. Trends Pharmacol Sci. 2001;22:188–94. doi: 10.1016/s0165-6147(00)01646-1. [DOI] [PubMed] [Google Scholar]
- 44.Sigel E, Buhr A. The benzodiazepine binding site of GABAA receptors. Trends Pharmacol Sci. 1997;18:425–9. doi: 10.1016/s0165-6147(97)01118-8. [DOI] [PubMed] [Google Scholar]
- 45.Smith GB, Olsen RW. Functional domains of GABAA receptors. Trends Pharmacol Sci. 1995;16:162–8. doi: 10.1016/s0165-6147(00)89009-4. [DOI] [PubMed] [Google Scholar]
- 46.Smith AJ, Alder L, Silk J, et al. Effect of α subunit on allosteric modulation of ion channel function in stably expressed human recombinant γ-aminobutyric acidA receptors determined using 36Cl ion flux. Mol Pharmacol. 2001;59:1108–18. doi: 10.1124/mol.59.5.1108. [DOI] [PubMed] [Google Scholar]
- 47.Carlson JN, Haskew R, Wacker J, Maisonneuve IM, Glick SD, Jerussi TP. Sedative and anxiolytic effects of zopiclone's enantiomers and metabolite. Eur J Pharmacol. 2001;415:181–9. doi: 10.1016/s0014-2999(01)00851-2. [DOI] [PubMed] [Google Scholar]
- 48.Hanson SM, Morlock EV, Satyshur KA, Czajkowski C. Structural requirements for eszopiclone and zolpidem binding to the γ-aminobutyric acid type-A (GABAA) receptor are different. J Med Chem. 2008;51:7243–52. doi: 10.1021/jm800889m. [DOI] [PMC free article] [PubMed] [Google Scholar]
- 49.Vyazovskiy VV, Tobler I, Winsky-Sommerer R. Alteration of behavior in mice by muscimol is associated with regional electroencephalogram synchronization. Neuroscience. 2007;147:833–41. doi: 10.1016/j.neuroscience.2007.05.003. [DOI] [PubMed] [Google Scholar]
- 50.Flint RR, Lydic R, Baghdoyan HA. Electroencephalogram (EEG) power during wakefulness and rapid eye movement (REM) sleep is increased by microinjection of the GABAA receptor agonist muscimol into the pontine reticular nucleus, oral part (PnO) of C57BL/6J (B6) mouse. Sleep. 2009;32(Abstract Suppl):0014. [Google Scholar]
- 51.Kopp C, Rudolph U, Low K, Tobler I. Modulation of rhythmic brain activity by diazepam: GABAA receptor subtype and state specificity. Proc Natl Acad Sci U S A. 2004;101:3674–9. doi: 10.1073/pnas.0306975101. [DOI] [PMC free article] [PubMed] [Google Scholar]
- 52.Chen HY, Kuo TB, Shaw FZ, Lai CJ, Yang CC. Sleep-related vagotonic effect of zolpidem in rats. Psychopharmacology (Berl) 2005;181:270–9. doi: 10.1007/s00213-005-2236-0. [DOI] [PubMed] [Google Scholar]
- 53.Tobler I, Kopp C, Deboer T, Rudolph U. Diazepam-induced changes in sleep: role of the α1 GABAA receptor subtype. Proc Natl Acad Sci U S A. 2001;98:6464–9. doi: 10.1073/pnas.111055398. [DOI] [PMC free article] [PubMed] [Google Scholar]
- 54.Liang CL, Marks GA. A novel GABAergic afferent input to the pontine reticular formation: the mesopontine GABAergic column. Brain Res. 2009;1297:32–40. doi: 10.1016/j.brainres.2009.08.045. [DOI] [PMC free article] [PubMed] [Google Scholar]
- 55.Watson CJ, Lydic R, Baghdoyan HA. Sleep and GABA levels in the oral part of rat pontine reticular formation are decreased by local and systemic administration of morphine. Neuroscience. 2007;144:375–86. doi: 10.1016/j.neuroscience.2006.09.007. [DOI] [PMC free article] [PubMed] [Google Scholar]
- 56.Xi M, Chase MH. Effects of eszopiclone and zolpidem on sleep and waking states in the adult guinea pig. Sleep. 2008;31:1043–51. [PMC free article] [PubMed] [Google Scholar]
- 57.Yoshimoto M, Higuchi H, Kamata M, Yoshida K, Shimizu T, Hishikawa Y. The effects of benzodiazepine (triazolam), cyclopyrrolone (zopiclone) and imidazopyridine (zolpidem) hypnotics on the frequency of hippocampal theta activity and sleep structure in rats. Eur Neuropsychopharmacol. 1999;9:29–35. doi: 10.1016/s0924-977x(97)00102-8. [DOI] [PubMed] [Google Scholar]
- 58.Krystal AD, Walsh JK, Laska E, et al. Sustained efficacy of eszopiclone over 6 months of nightly treatment: results of a randomized, double-blind, placebo-controlled study in adults with chronic insomnia. Sleep. 2003;26:793–9. doi: 10.1093/sleep/26.7.793. [DOI] [PubMed] [Google Scholar]
- 59.Kodama T, Takahashi Y, Honda Y. Enhancement of acetylcholine release during paradoxical sleep in the dorsal tegmental field of the cat brain stem. Neurosci Lett. 1990;114:277–82. doi: 10.1016/0304-3940(90)90576-u. [DOI] [PubMed] [Google Scholar]
- 60.Leonard TO, Lydic R. Nitric oxide synthase inhibition decreases pontine acetylcholine release. Neuroreport. 1995;6:1525–9. doi: 10.1097/00001756-199507310-00015. [DOI] [PubMed] [Google Scholar]
- 61.Jones BE, Beaudet A. Distribution of acetylcholine and catecholamine neurons in the cat brainstem: a choline acetyltransferase and tyrosine hydroxylase immunohistochemical study. J Comp Neurol. 1987;261:15–32. doi: 10.1002/cne.902610103. [DOI] [PubMed] [Google Scholar]
- 62.Lydic R, Baghdoyan HA. Pedunculopontine stimulation alters respiration and increases ACh release in the pontine reticular formation. Am J Physiol. 1993;264:R544–R54. doi: 10.1152/ajpregu.1993.264.3.R544. [DOI] [PubMed] [Google Scholar]
- 63.Ye M, Garcia-Rill E. Potentiating effect of eszopiclone on GABAA receptor-mediated responses in pedunculopontine neurons. Sleep. 2009;32:879–87. doi: 10.1093/sleep/32.7.879. [DOI] [PMC free article] [PubMed] [Google Scholar]
- 64.Pirker S, Schwarzer C, Wieselthaler A, Sieghart W, Sperk G. GABAA receptors: immunocytochemical distribution of 13 subunits in the adult rat brain. Neuroscience. 2000;101:815–50. doi: 10.1016/s0306-4522(00)00442-5. [DOI] [PubMed] [Google Scholar]
- 65.Sieghart W, Sperk G. Subunit composition, distribution and function of GABAA receptor subtypes. Curr Top Med Chem. 2002;2:795–816. doi: 10.2174/1568026023393507. [DOI] [PubMed] [Google Scholar]
- 66.Schiff ND. Central thalamic contributions to arousal regulation and neurological disorders of consciousness. Ann NY Acad Sci. 2008;1129:105–18. doi: 10.1196/annals.1417.029. [DOI] [PubMed] [Google Scholar]
- 67.Schiff ND. Recovery of consciousness after brain injury: a mesocircuit hypothesis. Trends Neurosci. 2010;33:1–9. doi: 10.1016/j.tins.2009.11.002. [DOI] [PMC free article] [PubMed] [Google Scholar]
- 68.Schiff ND, Posner JB. Another “Awakenings”. Ann Neurol. 2007;62:5–6. doi: 10.1002/ana.21158. [DOI] [PubMed] [Google Scholar]
- 69.DeMarco GJ, Baghdoyan HA, Lydic R. Carbachol in the pontine reticular formation of C57BL/6J mouse decreases acetylcholine release in prefrontal cortex. Neuroscience. 2004;123:17–29. doi: 10.1016/j.neuroscience.2003.08.045. [DOI] [PubMed] [Google Scholar]