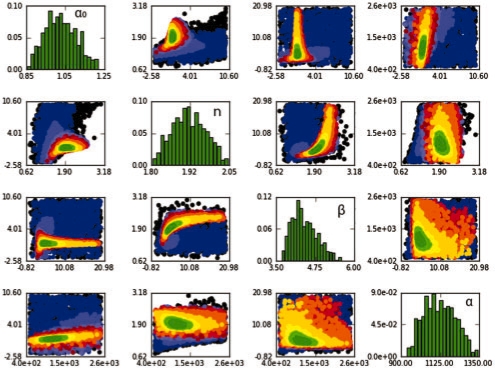
Fig. 1.
ABC-SysBio output. This example shows the results of the deterministic repressilator model (as described in Toni et al., 2009). Scatterplots of inferred parameters for 11 populations are displayed (from black for the first population to dark green for the 9th population). The approximate posterior over model parameters is shown on the diagonal.

