

Abstract
Background
Rats artificially selected to be low capacity runners (LCR) possess a metabolic syndrome phenotype that is worsened by a high fat diet (HFD) while rats selected to be high capacity runners (HCR) are protected against HFD-induced obesity and insulin resistance.
Objective
This study examined if protection or susceptibility to HFD-induced insulin resistance in the HCR/LCR strains is associated with contrasting metabolic adaptations in skeletal muscle.
Design
HCR and LCR rats [generation 20; n=5-6; max running distance: ~1800 m vs. ~350 m, respectively (p<0.0001)] were divided into HFD (71.6% energy from fat) or normal chow (NC) (16.7% energy from fat) groups for 7 weeks (from 24 to 31 weeks of age). Skeletal muscle (red gastrocnemius) mitochondrial-fatty acid oxidation (FAO), -enzyme activity, -morphology, PGC-1α and PPARδ expression, and insulin sensitivity (intraperitoneal glucose tolerance tests) were measured.
Results
The HFD only caused increased adiposity and reduced insulin sensitivity in the LCR and not the HCR strain. Isolated mitochondria from the HCR skeletal muscle displayed a 2-fold higher rate of FAO on NC, but both groups increased FAO following HFD. PGC-1α mRNA expression and superoxide dismutase activity were significantly reduced with HFD in the LCR rats, but not the HCR. PPARδ expression did not differ between strains or dietary conditions.
Conclusion
These results do not provide a clear connection between protection of insulin sensitivity and HFD-induced adaptive changes in mitochondrial function or transcriptional responses but do not dismiss the possibility that elevated mitochondrial FAO in the HCR may play a protective role.
Keywords: skeletal muscle, mitochondria, fatty acid oxidation, insulin resistance, aerobic capacity
Introduction
Skeletal muscle insulin resistance is an initial step in the progression towards type 2 diabetes and has been linked to physical inactivity, obesity, and increased intake of dietary fat. Current evidence suggests that reduced mitochondrial content, reduced capacity for fatty acid oxidation (FAO), or transcriptional control of mitochondrial content and function may play a role in the development of insulin resistance (Simoneau et al. 1997; Kelley et al. 1999; Kim et al. 2000; Hulver et al. 2003; Toledo et al. 2007).
Skeletal muscle from obese or type 2 diabetic human subjects has been shown to have reduced mitochondrial content (Ritov et al. 2005; Toledo, Menshikova et al. 2007) and oxidative enzyme activities (Simoneau and Kelley 1997). In addition, obese, insulin resistant human subjects has been shown to have lower rates of FAO measured at the whole body level (Thyfault et al. 2004) across the leg (Kelley, Goodpaster et al. 1999) or in in-vitro muscle preparations (Kim, Hickner et al. 2000; Hulver, Berggren et al. 2003), however, other labs have shown that there is no decrease in skeletal muscle FAO when measured in isolated mitochondria (Holloway et al. 2007). Non-type 2 diabetic individuals with a family history of type 2 diabetes display lower mitochondrial content and oxidative capacity, suggesting that mitochondrial abnormalities may be a cause and not a consequence of insulin resistance (Petersen et al. 2004).
In contrast, obese rodents posses elevated FAO in muscle (Turcotte et al. 2001; Holloway et al. 2009) when compared to non-obese controls and a recent study found that high fat fed (HFD) rats increased skeletal muscle FAO during the development of insulin resistance (Turner et al. 2007). In addition, Koves et al (Koves et al. 2008) has shown that blocking the entry of fatty acids into mitochondria in the malonyl-CoA decarboxylase knockout (MCD−/−) mouse protects against HFD-induced insulin resistance. Together, these studies have led to controversy over the association between FAO and insulin sensitivity.
The transcriptional responses of genes controlling mitochondrial content and function also may play a role in protecting against insulin resistance during HFD conditions. Current conjecture is that a HFD and elevated lipids activates the nuclear transcription factor proliferator-activated receptor delta (PPARδ) and its co-activator, PPARγ co-activator 1α (PGC-1α) to induce a network of mitochondrial and oxidative genes that result in higher rates of FAO. However, the expression of PGC-1α-controlled oxidative genes are reduced in patients with type 2 diabetes or have been shown to not change or to decrease in animals and humans placed on a HFD, respectively (Mootha et al. 2003; Patti et al. 2003; Koves et al. 2005; Sparks et al. 2005; Mensink et al. 2007). Although controversial, the down-regulation of specific nuclear transcription factors or the transcriptional irresponsiveness of these factors in response to elevated lipids may play a role in the development of HFD-induced insulin resistance.
By two-way artificial selective breeding for high and low endurance performance during treadmill tests (Koch et al. 2001), contrasting strains of rats with grossly different intrinsic endurance exercise capacity (max run distance during a graded exercise test to exhaustion is 347% different) and aerobic capacity (VO2max is 58% different) have been developed (Wisloff et al. 2005). The low capacity runner (LCR) and high capacity runner (HCR) strains display these contrasting phenotypes despite receiving no exercise training. The LCR rats display cardiovascular and metabolic syndrome like risk factors on a normal chow diet and are highly susceptible to HFD-induced obesity and insulin resistance, while the HCR rats display no overt risk factors on a normal chow diet and are protected against HFD-induced obesity and insulin resistance (Wisloff, Najjar et al. 2005; Noland et al. 2007).
The purpose of this study was to examine HFD-induced changes in skeletal muscle mitochondrial FAO, enzyme activity, and morphology in addition to transcriptional responses in female HCR and LCR rats that display protection or susceptibility to HFD-induced insulin resistance, respectively. This is a unique approach because previous studies examining changes in FAO and PPAR and PGC-1 responses to a HFD have only been studied in animal models where insulin resistance ensues. The HCR strain provides an opportunity to examine skeletal muscle responses in an animal model that has previously been shown to be protected from HFD induced insulin resistance. Female rats were studied because they have previously been shown to have more robust changes in genes controlling skeletal muscle FAO following a HFD (Priego et al. 2008). We hypothesized that HCR rats possess enhanced skeletal muscle mitochondrial content and FAO in addition to a coordinated response for PPARδ and PGC-1α expression following a HFD. In contrast, we hypothesized the LCR would display markers of decreased mitochondrial content and FAO and have an impaired transcriptional response to HFD.
Materials and Methods
Animal Strains
Female LCR and HCR rats from generation 20 were housed in pairs in a temperature-controlled environment with a 12:12 h light:dark cycle. Animals arrived at the University of Missouri-Columbia at 21 weeks of age and were provided standard rat chow and water ad libitum until they reached 24 weeks of age. At this time LCR and HCR rats were divided into 4 groups (n = 5-6/group) and fed ad libitum either a NC diet (16.7% kcals from fat; Formulab Diet® 5008) or HFD (71.6% kcals from fat; TestDiet® 5008; primary fat source is lard) for 7 weeks. Since running distance, run time to exhaustion, and body weight varies significantly within these strains, animals were assigned accordingly to assure similar mean run distances, run times and body weights between dietary groups. On experimental days, rats were fasted for 10 h, anaesthetized using 50 mg/kg body weight of pentobarbital and tissues were harvested. All procedures using animals were approved by the University of Missouri Animal Care and Use Committee prior to the initiation of the study.
Body and fat pad weights, and food intake
All animals were weighed upon arrival, as well as on a weekly basis and upon sacrifice. At death, individual omental and periovarian fat pads were removed and weighed. Body composition ratio was determined by dividing total fat pad weight (omental and periovarian) by body weight. Food consumption was measured on a weekly basis and was used to determine the gross amount of energy consumed per week (kJ/body weight/week). Feeding efficiency was determined by dividing body weight changes by food consumption.
Intraperitoneal glucose tolerance test
Five days prior to sacrifice, animals underwent a fasted intraperitoneal glucose tolerance test (IPGTT). Food was removed from the cages 12 hours before each received an intraperitoneal injection of dextrose (50% solution, 2 g/kg body weight). Venipuncture blood samples were collected from the lateral tail vein immediately before dextrose administration and 15, 30, 45, 60, and 120 minutes after injection. After centrifugation at 3000 × g, serum samples were stored at −20°C until glucose and insulin measurement by glucose oxidase kit (Thermo) and ELISA (Linco), respectively. Insulin sensitivity was estimated as the product of the areas under the curve (AUCs) for glucose and insulin.
Serum profiling
Plasma free fatty acids (FFAs; Wako) and triglycerides (TGs; Thermo) were measured with commercially available kits, according to the manufacturer’s instructions.
Skeletal muscle mitochondrial isolation and fatty acid oxidation (FAO)
Isolated mitochondria was prepared from red gastrocnemius (RG) muscle and the production of 14CO2 from [1-14C] palmitate (American Radiochemicals) was used to assess mitochondrial FAO as previously described by our group (Laye et al. 2009).
Mitochondrial Enzyme Activities
β-hydroxyacyl dehydrogenase (β-had), citrate synthase (CS), and cytochrome c oxidase activity were measured in skeletal muscle whole homogenates from red gastrocnemius as referenced previously by our group (Laye, Rector et al. 2009).
PGC-1α and PPARδ mRNA Expression
PGC-1α and PPARδ mRNA expression was quantified by real-time PCR using the ABI 7000 Sequence Detection System and software. RG samples were pulverized in RLT buffer using the Qiagen® TissueLyser system. Samples were incubated in an RNase-free water/proteinase K solution and centrifuged at 10,000g to separate and then isolate the RNA-containing precipitate using ethanol. The supernatant/ethanol solution was transferred to a spin column and centrifuged at 8,000g to remove waste flow-through. The remaining precipitate was washed once with a RW1 buffer, then with DNase I, and then again with RW1. Lastly, the solution was washed with buffer RPE and then with RNase-free water to collect the RNase-free water-containing RNA. Purity was ensured and concentration determined with a spectrophotometer. Reverse transcription was performed by combining RNA with the reverse transcription reaction mixture (Nuclease-Free Water, ImProm-II 5x Reaction Buffer, MgCl2, dNTP mix, and ImProm-II Reverse Transcriptase) and cDNA was synthesized. The reaction mixture (Nuclease-Free Water, 18S, PGC-1α, PPARδ, or Cytochrome c primer and probe, both forward and reverse transcriptases, and TAQman Mastermix) was loaded to a 96-well microplate, along with the cDNA sample (5ug/uL stock) and placed into the ABI 7000 Sequence Detection System for polymerization. After polymerization, results were quantified relative to the 18S subunit as reported previously (Laye, Rector et al. 2009). Ct values for 18S were similar between groups and experimental conditions (HCR-NC=11.64±0.27; HCR-HFD=11.26±0.15; LCR-NC=11.64±0.27; LCR-HFD= 11.52±0.08).
Mitochondrial Superoxide Dismutase
m-SOD was measured in isolated mitochondria from soleus skeletal muscle using a commercially available kit and is expressed per μg of mitochondrial protein (Cayman, Ann Arbor, Michigan).
Transmission electron microscopy
Skeletal muscle mitochondrial content and density was determined using transmission electron microscopy. Upon sacrifice a small piece of RG was placed into a microcentrifuge tube containing electron microscopy fixative (2% Paraformaldehye/2% Glutaraldehyde in 0.1M Phosphate Buffer). Samples were taken to the Electron Microscopy Core at the School of Veterinary Medicine at the University of Missouri-Columbia where samples were fixed in 1% osmium tetroxide in phosphate buffer, dehydrated in a series of graded ethyl alcohols (70-100%), and finally embedded and sectioned. After sectioning, 5-6 TEM pictures/animal were taken at 22,400x for qualitative measurement of mitochondrial content and density using the Metamorph® computer program.
SDS-PAGE Western Blotting
Western blotting was performed as previously referenced by our group (Laye, Rector et al. 2009; Thyfault et al. 2009). The following antibodies were used for western blotting: PPARδ polyclonal antibody (Upstate), and cytochrome c polyclonal antibody (Santa Cruz). RG samples were homogenized in an ice-cold lysis buffer, separated by SDS-PAGE gels, transferred to PVDF membranes, and probed with primary antibodies as described previously. Bands were visualized with SuperSignal® Femto ECL Substrate (Thermo Scientific) and quantified by densitometry and band densities were corrected for total protein loaded by staining with 0.1% amido-black (Sigma) as described previously (Rector et al. 2008).
Statistical analysis
All data was presented as means ± SE and was analyzed using SigmaStat software (Point Richmond, CA, version 3.1). A two-way (strain × diet) ANOVA, Tukey post hoc testing, and unpaired t-test were used to analyze data. Significance was set at P<0.05.
Results
Running Capacity
Rats were divided evenly into NC and HFD groups based on maximal running capacity and time to exhaustion during a treadmill test performed at 11 weeks of age. HCR from generation 20 had a 5-fold greater distance to exhaustion and a 3-fold greater run time to exhaustion than LCR (P<0.05) (Table 1).
Table 1. Animal characteristics.
Rats were randomly divided into NC and HFD treatment groups based on running distance and time to exhaustion during a treadmill test performed at 11 weeks of age. HCR had significantly higher running distance and run time to exhaustion while the LCR had a higher initial body weight and final body weight after 7 wk NC and HFD. The HFD significantly increased adiposity in the LCR over the NC diet, while the HCR did not increase adiposity on the HFD. There was no differences in serum TAG or FFA levels between strains or diets. n = 5-6/group, values are means ± SE.
Running Capacity, Body Composition and Serum Markers
| LCR |
HCR |
|||
|---|---|---|---|---|
| NC | HFD | NC | HFD | |
| Running Distance (m) | 358.22 ± 22 | 344 ± 27 | 1821 ± 73* | 1851 ± 88* |
| Time to Exhaustion (min) | 23 ± 1 | 23 ± 1 | 68 ± 2* | 69 ± 2* |
| Initial Weight (g) | 276 ± 16 | 268 ± 10 | 219 ± 7* | 217 ± 4* |
| Final Weight (g) | 300 ± 21 | 295 ± 12 | 233 ± 10* | 238 ± 8* |
| Weight Change (g) | 21 ± 6 | 27 ± 4 | 14 ± 5 | 21 ± 5 |
| Periovarian Fad Pad (mg) | 1194 ± 157 | 2696 ± 504† | 747 ± 102* | 671 ± 142* |
| Omental Fat Pad (mg) | 507 ± 64 | 712 ± 165 | 251 ± 70* | 329 ± 50* |
| Body Composition Ratio (%) | 0.6 ± 0.1 | 1.2 ± 0.2† | 0.4 ± 0.0 | 0.4 ± 0.1 |
| Serum TAG (mg/dL) | 136 ± 4 | 135 ± 7 | 136 ± 8 | 135 ± 4 |
| Serum FFA (μmol/L) | 495 ± 30 | 431 ± 33 | 553 ± 58 | 443 ± 51 |
Significantly different from LCR animals,
Significantly different from NC fed animals (P<0.05).
Fat Pad Weight, Serum Markers, and Food Intake
At 24 weeks of age, LCR were significantly heavier than HCR (Table 1, P<0.05). Following the 7-week dietary treatments, total weight gain on the HFD was similar between groups (Table 1). Both periovarian and omental fat pads were significantly heavier in the LCR versus the HCR on the NC diet (P<0.05) (Table 1). The HFD induced a 2-fold increase in periovarian fat pad weight in the LCR rats, but this was not seen in the HCR. In addition, there was a non-significant trend for increased omental fat pad weight in the LCR HFD compared to the LCR NC. Unlike previous reports in male LCR and HCR rats (Wisloff, Najjar et al. 2005; Noland, Thyfault et al. 2007), serum TG and FFA concentrations displayed no differences between strains or treatment (Table 1). Additionally, there was no difference in absolute, relative (per body weight) energy consumption, or feeding efficiency between strains on either diet (Table 2). When expressed relative to body weight, HFD fed rats in both groups consumed less energy per gram body weight than their NC counterparts (Table 2).
Table 2. Dietary Intake.
There were no significant differences following 7 weeks of NC or HFD in dietary intake, gross energy, or feeding efficiency. When normalized to body weight, both HCR and LCR on the NC diet displayed a greater gross energy intake compared to the HFD. n = 5-6/group, values are means ± SE.
Energy Consumption
| Gross Energy |
Feeding Efficiency |
|||
|---|---|---|---|---|
| Group Dietary Intake, g/wk | kJ/wk | kJ/bw/wk | % | |
| LCR - NC | 213.0 ± 13.1 | 1674.2 ± 163.0 | 6.5 ± 0.6 | 31.5 ± 2.0 |
| LCR - HFD | 136.3 ± 14.3 | 1460.5 ± 146.1 | 4.9 ± 0.4† | 35.2 ± 3.4 |
| HCR - NC | 185.6 ± 19.4 | 1567.5 ± 221.0 | 6.2 ± 0.6 | 29.3 ± 4.6 |
| HCR - HFD | 131.7 ± 7.1 | 1374.4 ± 135.1 | 4.9 ± 0.5† | 32.6 ± 1.4 |
Significantly different from NC fed group (P<0.05).
Intraperitoneal Glucose Tolerance Test
A glucose tolerance test was used an indices of whole body insulin sensitivity. On the NC diet, the insulin AUC response was significantly higher in LCR than HCR rats (P<0.05) (Figure 1). The HFD further increased the insulin AUC response in the LCR rats, while the HFD had no significant impact on the insulin AUC response in the HCR rats. The LCR and HCR rats had similar serum glucose responses to the IPGTT on both the NC and HFD. Collectively, these data support previous findings (Noland, Thyfault et al. 2007) that the LCR rats display reduced insulin sensitivity on a NC diet that is further exacerbated by HFD conditions, while the HCR are protected from HFD-induced insulin resistance.
Figure 1. Intraperitoneal glucose tolerance test.

A glucose tolerance test was performed to assess whole body insulin sensitivity. The insulin AUC response was higher in the LCR than the HCR on both the NC, and the difference was magnified on the HFD as the LCR rats became more insulin resistant while the HCR rats did not have a significant increase in insulin AUC. No significant differences between groups or diets were found for the glucose AUC. n = 5-6/group, values are means ± SE. *Significantly higher than HCR, †significantly different from NC diet (P<0.05).
Skeletal Muscle Mitochondrial FAO
HCR rats exhibited 3-fold higher total FAO oxidation (CO2 + acid soluble metabolites) in isolated mitochondria from the red gastrocnemius muscle on NC compared with the LCR rats (Figure 2, P<0.05). The HFD induced a 3-fold increase in total FAO (P<0.05) in the LCR rats and tended (p=0.066) to increase total FAO in the HCR rats, resulting in no significant differences in mitochondrial FAO between the strains after HFD. Complete FAO to CO2 showed similar results as the total FAO (data not shown) indicating that the increase in mitochondrial total FAO in both groups after the HFD was comprised of both increased incomplete (acid soluble metabolites) and complete oxidation (CO2).
Figure 2. Total palmitate oxidation in isolated mitochondria from red gastrocnemius skeletal muscle.

Total palmitate oxidation in isolated skeletal muscle mitochondria was higher in HCR than LCR on the NC diet. Although both groups had an increase in total palmitate oxidation, the increase was only significant in the LCR and resulted in no significant differences between groups after the HFD. n = 5-6/group, values are means ± SE. *Significantly higher than LCR animals, †significantly different from NC diet (P<0.05).
Mitochondrial Enzymes
β-HAD, citrate synthase, and cytochrome c oxidase activity in the red gastrocnemius skeletal muscle were not significantly different between strains or diet conditions (Table 3). Citrate synthase enzyme activity did show a trend (P = 0.07) towards greater activity in HCR versus LCR rats on the NC diet.
Table 3. Mitochondrial content and density of red gastrocnemius skeletal.
Skeletla muscle itochondrial volume density and size measured by transmission electron microscopy was not significantly different between HCR and LCR animals regardless of diet or mitochondrial subpopulation. There was a trend for greater IMF mitochondrial area in LCR than HCR on the NC diet (P=0.075). n = 5-6 images/animal/group, values are means ± SE (P<0.05). See Figure 5 for representative transmission electron microscopy images.
Mitochondrial Morphology and Enzyme Activity
| LCR |
HCR |
|||
|---|---|---|---|---|
| NC | HFD | NC | HFD | |
| Mitochondrial Volume Density (%) | ||||
| IMF | 23.6 ± 2.6 | 19.6 ± 1.7 | 22.1± 1.2 | 18.6 ± 3.2 |
| Mitochondrial Size/Area (pixels2) | ||||
| SS | 7477.4 ± 1764.8 | 7376.1 ± 721.6 | 6563.2 ± 771.1 | 5130.3 ± 634.7 |
| IMF | 4002.4 ± 749.4 | 3532.8 ± 647.7 | 2664.7 ± 233.0 | 2857.3 ± 331.3 |
| Enzyme Activity (nM/μg/min) | ||||
| β-had | 15.9 ± 1.7 | 17.9 ± 2.4 | 20.4 ± 1.8 | 16.3 ± 3.1 |
| Citrate Synthase | 888.4 ± 107.1 | 884.2 ± 93.6 | 1224.3 ± 138.7 | 824.9 ± 109.5 |
| Cytochrome c oxidase | 1.9 ± 0.1 | 2.0 ± 0.2 | 2.2 ± 0.3 | 1.9 ± 0.2 |
mRNA and Protein Content of Nuclear Transcription Factors and Cytochrome c
Measures of PGC-1α and PPARδ mRNA and PPARδ, and cytochrome c protein expression are shown in Figures 3A-D. There was a non-significant trend for PGC-1α mRNA to be higher in the red gastrocnemius skeletal muscle of the LCR over the HCR on the NC diets (Figure 3A, P=0.056), while only the LCR group showed a significant HFD induced decrease in PGC-1α mRNA compared to NC conditions (Figure 3A, P<0.05). PPARδ mRNA and protein content was not different between strains or treatments. The combination of diet groups revealed a main effect for HCR rats having higher cytochrome c protein than the LCR strain (Figure 3E, P<0.05).
Figure 3. PPARδ, PGC-1α, and Cytochrome c protein and mRNA expression in red gastrocnemius skeletal muscle.

On the NC diet, LCR had a trend for higher PGC-1α mRNA expression than the HCR (P=0.056), however, the expression dropped significantly in response to the HFD resulting in no differences between the groups on the HFD. When combining the HFD and NC groups the HCR had higher cytochrome c protein content than the LCR (Figure 4D). n = 5-6/group, values are means ± SE, *Significantly different between groups, † significantly different than NC diet, (P<0.05).
Mitochondrial Area and Volume
Mean mitochondrial volume density, the percentage of IMF area occupied by mitochondria, was not different between HCR and LCR animals on either diet (Figure 4; 4 images, Table 3 data). In addition, mitochondrial size and mitochondrial number (data not shown) was not different between strains on either diet. If the NC and HFD groups were combined within strains there was a trend for the LCR rats to have larger mitochondrial size than the HCR (P=0.075). These data were comparable to mRNA and protein content measures of mitochondrial content. We next calculated the ratio of cytochrome c to mitochondrial area as a marker of mitochondrial protein per area of mitochondria. The ratio of cytochrome c to mitochondrial area was 50% higher in the HCR than the LCR on the NC and >2-fold higher after the HFD (Figure 5 P<0.05). In addition, only the HCR had a significant increase in cytochrome c to mitochondrial area ratio following the HFD. A similar result was found when calculating the ratio of citrate synthase activity per mitochondrial area on the NC diet [HCR had a significantly higher citrate synthase/mitochondrial area then the LCR (0.140 ± 0.012 vs. 0.084 ± 0.014); P<0.05] but high variability prevents us from reliably reporting this ratio in the HFD condition.
Figure 4. Representative images of (A) Subsarcolemmal and (B) Intermyofibrillar mitochondria.

Images of SS and IMF mitochondria from the HCR and LCR on the NC and HFD.
Figure 5. Ratio of cytochrome c protein content per mitochondrial area.
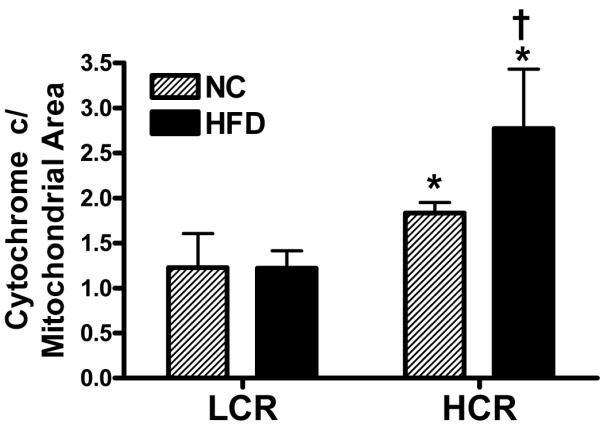
The ratio of cytochrome c protein per mitochondrial area was significantly higher in the HCR than the LCR on the NC diet. In response to the HFD, only the HCR had a significant increase in cytochrome c protein/mitochondrial area, resulting in the HCR group also having a larger ratio than the LCR in the HFD condition. *Significantly greater than LCR. †Significantly different than NC diet (P<0.05).
Mitochondrial superoxide dismutase activity
Mitochondrial superoxide dismutase (m-SOD) activity was also measured because its content is putatively controlled by PGC-1α (St-Pierre et al. 2003) and it because it provides a first line of defense against reactive oxygen species production which is linked to insulin resistance (Abdul-Ghani et al. 2009). m-SOD activity was significantly higher in the LCR on the NC but was significantly reduced by 42% in the LCR skeletal muscle after the HFD (Figure 6; P<0.05). In contrast, the HCR muscle had a non-significant 68% increase in m-SOD activity between HFD and NC (P=0.1)
Figure 6. Superoxide dismutase activity in isolated mitochondria from red gastrocnemius muscle.

The HCR had significantly lower mitochondrial SOD activity than the LCR on the NC diet. In response to the HFD, the LCR had a significant decrease in mitochondrial SOD activity while the HCR had a non-significant increase (P=0.08). n = 4-5/group, values are means ± SE, *significantly different between groups within a diet, † significantly different than NC diet, (P<0.05)
Discussion
The aim of this study was to determine if adaptations to skeletal muscle mitochondrial FAO, enzyme activity, morphology, and transcriptional responses were differentially regulated in skeletal muscle from rats that are protected or susceptible to HFD-induced insulin resistance due to selective breeding for high (HCR) or low endurance running capacity (LCR), respectively. As expected, the HFD worsened insulin resistance and increased adiposity in the LCR, while the HCR were protected from these changes; however, several unexpected findings in skeletal muscle emerged. On a NC diet, the HCR had a 3-fold higher mitochondrial FAO in skeletal muscle despite the LCR having significantly higher PGC-1α gene expression and increased mitochondrial area measured by electron microscopy. Both groups increased mitochondrial FAO on the HFD eliminating between strain differences; however, only the LCR had a decrease in PGC-1α gene expression. Contrary to our hypothesis, the HCR did not display a change in PGC-1α or PPARδ expression nor did our other enzyme and electron microscopy mitochondrial measures capture a significant difference between strains on a NC diet or in response to the HFD.
Previous studies have shown that insulin resistant obese humans have reduced skeletal muscle and whole body FAO (Kelley, Goodpaster et al. 1999; Kim, Hickner et al. 2000; Hulver, Berggren et al. 2003; Thyfault, Kraus et al. 2004; Hulver et al. 2005) which may contribute to both expanding adiposity and an increased storage of lipids in muscle. These data in combination with the intensely studied link between insulin resistance and elevated lipids storage in skeletal muscle led to the lipotoxicity hypothesis, which contends that the increased storage of intramuscular lipid metabolites (diacylglycerol, fatty acyl-CoAs, and ceramides) impairs insulin action (Muoio et al. 2006). In contrast to the reduced FAO that has been reported in human obesity, rodent models of obesity and insulin resistance have higher skeletal muscle FAO than non-obese controls but still possess elevated intramuscular lipids (Turcotte, Swenberger et al. 2001; Thyfault et al. 2007; Holloway, Benton et al. 2009).
Newer studies have utilized HFD-induced insulin resistance to examine changes in skeletal muscle mitochondrial function and FAO as insulin resistance develops. Turner et al (Turner, Bruce et al. 2007) found that both 5 and 20 weeks of a HFD-induced both increased FAO in muscle homogenate and reduced insulin sensitivity with a glucose tolerance test in mice. In addition, Hancock et al (Hancock et al. 2008) found that a HFD increased several markers of mitochondrial content and function in parallel with worsening insulin resistance in rats. In relation this, Koves and Muoio et al (Koves, Li et al. 2005; Koves, Ussher et al. 2008) have developed an alternative hypothesis that insulin resistance may be linked to an excess entry of fatty acids into the mitochondria and increased incomplete fatty acid oxidation which results in oxidative stress or other mitochondrial derived metabolites which impair insulin action. This paradigm is supported by their work showing that blocking fatty acid entry into the mitochondria by knocking out malonyl CoA decarboxylase activity in mice or in cultured muscle cells prevents HFD or lipid-induced insulin resistance, respectively (Koves, Ussher et al. 2008). In contrast to the report from Turner et al (Turner, Bruce et al. 2007) we found that the HCR rats maintained insulin sensitivity, as measured by a glucose tolerance test. It could be hypothesized that the elevated FAO in the HCR prior to the initiations of the HFD provided protection against HFD-induced insulin resistance and adiposity. This association was clearly shown in the HCR rats in this study and in a previous report in the model (Noland, Thyfault et al. 2007). Importantly, both the HCR and LCR groups increased both incomplete (acid soluble metabolite production) and complete FAO to CO2 (data not shown) in response to the HFD suggesting that mismatch between mitochondrial fatty acid entry and complete oxidation did not play a role in the development of insulin resistance in the LCR. In support of the concept that high mitochondrial FAO may provide protection it is documented that animals given daily exercise are protected against HFD-induced insulin resistance assumedly due in part to enhanced lipid handling and utilization (Koves, Li et al. 2005; Bradley et al. 2008). Additional studies in which FAO is elevated by overexpression of CPT-1 in skeletal muscles of rats (Bruce et al. 2009), in muscle cells, (Perdomo et al. 2004) or by knockout of specific genes (ACC−/−) (Abu-Elheiga et al. 2003) has also been shown to protect against lipid induced insulin resistance.
An outcome that is difficult to interpret is the mismatched response between mitochondrial FAO and mitochondrial enzymes in response to the HFD. Both groups increased mitochondrial FAO in response to the HFD but neither group showed a significant increase in the activity of mitochondrial enzymes. This could be attributed to FAO being measured in equal contents (per ug protein) of isolated mitochondria while the mitochondrial enzyme assays were studied in muscle homogenates. A more likely rationale is that FAO is a biological measure that calls on a series of mitochondrial enzymes to work in unison to take fatty acids through transport into the mitochondria, beta oxidation, and the TCA cycle, while enzyme assays are measuring one part of the pathway in maximal conditions. Thus, it is possible that the function of enzymes not measured (acyl-CoA-synthetase or CPT-1 for example) may have increased in activity and contributed to the increased FAO response, while the mitochondrial enzymes measured in this report were already working at a high enough activity and did not need to increase in response to the HFD.
The effects of high fat feeding on skeletal muscle transcription factors and co-activators that mediate mitochondrial biogenesis, function, and lipid metabolism have also been intensively examined. The most highly studied factors include PGC-1α, a vital co-activator of nuclear receptors, that plays a large role in the control of mitochondrial biogenesis and oxidative genes (Lin et al. 2005). Importantly, reduced PGC-1α expression in muscle has been previously linked to insulin resistance and type 2 diabetes (Mootha, Lindgren et al. 2003; Patti, Butte et al. 2003; Mensink, Hesselink et al. 2007) while newer studies have refuted this connection (Hancock, Han et al. 2008). The role of the PPAR family of nuclear receptors, which are activated by fatty acids and exert transcription control of lipid oxidation and synthesis pathways have also been heavily examined. PPARδ is believed to provide a coordinated response to high fat feeding that will increase the disposal of fatty acids (Muoio et al. 2002; Barish et al. 2006). Surprisingly in this study we witnessed a decline in PGC-1α gene expression in the LCR after the HFD, and we also found no change in PPARδ expression between strains or diets. Previous studies examining PGC-1α mRNA have been unequivocal with a HFD causing no change (McAinch et al. 2003; Hancock, Han et al. 2008), or a decrease in muscle PGC-1α (Koves, Li et al. 2005; Sparks, Xie et al. 2005; Crunkhorn et al. 2007). Many studies including this one, have only assessed PGC-1α gene expression because of difficulty with commercially available antibodies, making comprehension of these findings more difficult due to transcriptional and post-translational regulation of PGC-1α. A recent study found that a 4 week HFD doubled skeletal muscle PGC-1α protein in rats (Hancock, Han et al. 2008), while Sparks et al (Sparks, Xie et al. 2005) showed a 3 week HFD reduced PGC-1α protein in skeletal muscle of mice by 40%. The discrepancies between studies could be due to different types of high fat feeding (varying macro-nutrient composition and diverse lipid sources), different species, different types of skeletal muscle tissues, and perhaps different antibody specificity. In addition, studies are needed to determine if a HFD alters the acetylation of PGC-1α, which has been shown to significantly change its co-activating capacities towards nuclear receptors (Rodgers et al. 2008). Thus, the meaning of the PGC-1α mRNA data reported here should be interpreted with caution. As for the lack of a change in PPARδ responses, it is possible that initial changes in expression occur early on but are lost as the HFD continues and a steady state condition ensues, but there is no evidence to support that in the current study. In addition, we did not detect a significant difference in plasma free fatty acids as a result of the HFD in either group in fasting conditions, although it is still probable that increased circulating free fatty acids would have been detected in HFD animals during the fed state.
There are limitations to this study including the probability that our analysis of only a red-oxidative muscle (red gastrocnemius) and not skeletal muscle with a mixed or white-glycolytic fiber type significantly impacted many of our results. Because red muscle fiber already has high oxidative capacity its ability to have a HFD induced transcriptional response or increase in mitochondrial enzyme activities may be blunted due to a ceiling effect. However, the ability for both groups to increase mitochondrial FAO in the red gastrocnemius in response to the HFD refutes this concept. That being said, it is certainly possible that different responses would have been witnessed in white or mixed muscle fibers and thus it should be emphasized that the results reported here are specific to an oxidative muscle fiber type. An additional limitation is that we did not attempt to monitor or control for the estrous cycle in the female rats which could have had an impact on circulating estrogen levels which is known to modulate lipid metabolism.
Mitochondrial reactive oxygen species (ROS) production also has been linked to skeletal muscle insulin resistance (Abdul-Ghani, Jani et al. 2009; Anderson et al. 2009). The m-SOD enzyme putatively provides protection against ROS induced cellular damage by converting superoxide into hydrogen peroxide. As such, m-SOD activity typically increases when tissues are subjected to stressors such as intensive exercise or a HFD (Powers et al. 1999; Anderson, Lustig et al. 2009). In addition, SOD expression is putatively controlled by PGC-1α (St-Pierre, Lin et al. 2003), thus we sought to determine how SOD activity measured in isolated mitochondria would respond to a HFD in the HCR and LCR skeletal muscle. On the NC, the LCR displayed higher m-SOD activity than the HCR, suggesting that the LCR mitochondria are already fending against a higher level of oxidative stress; however, m-SOD activity significantly declined in the LCR rats after the HFD. The reduction in SOD activity in the LCR would likely lead to a greater exposure to mitochondrial derived ROS production which has been linked to reduced insulin sensitivity (Anderson, Lustig et al. 2009) and the propagation of mitochondrial dysfunction due to mitochondrial DNA mutations (Hiona et al. 2008). In contrast, the HFD induced increase in m-SOD in the HCR would act to protect against cellular damage and insulin resistance.
The LCR unexpectedly showed a trend for greater mitochondrial size than the HCR despite being bred over several generations for lower endurance running capacity and possessing lower significantly lower FAO per mitochondrial protein (on NC diet), lower cytochrome c protein content, and a trend for lower citrate synthase and β-had enzyme activity on the normal chow diet. This led us to speculate that the LCR muscle may possess swollen, less functional mitochondria than their HCR counterparts. Previous studies have shown that reduced mitochondrial function is associated with round, swollen morphology, and less visible mitochondrial matrix (Ibdah et al. 2005; Lim et al. 2009). Electron microscopy images of skeletal muscle mitochondrial in the LCR rats did not reveal an overt morphological phenotype of swollen or round mitochondria. However, the ratio of cytochrome c to total mitochondrial area, an estimate of mitochondrial protein per mitochondrial area and thus an estimate of functional quality, was significantly higher in the HCR rats than the LCR rats on both the HF and NC diets. Additionally, this ratio increased in the HCR rats with high fat feeding. This ratio of mitochondrial protein to area suggests that a slightly larger mitochondrial area in the LCR is not associated with improved function. These association, particularly after the HFD should be taken with caution as the mitochondrial enzyme measures of citrate synthase and β-had tended to decrease in the HCR group after the HFD, which go in the opposite direction of the HFD induced effect to increase the cytochrome c to mitochondrial area ratio. Mitochondrial respiration studies are needed to confirm if the HCR do possess a higher quality mitochondria than the LCR.
In conclusion, our results show that both HCR and LCR rats have elevated mitochondrial FAO after a HFD, despite the HCR being protected and the LCR being susceptible to HFD induced insulin resistance. In addition, the HCR skeletal muscle did not show significant adaptations in mitochondrial content or morphology measures, or in transcriptional responses of PGC-1α or PPARδ as hypothesized. However, the HCR did show a possible response for higher mitochondrial quality as evidenced by an increased ratio of cytochrome C per mitochondrial area. It is possible that higher skeletal muscle mitochondrial content and FAO prior to initiation of the HFD in addition to HFD-induced increase in m-SOD and indices of mitochondrial area played a role in protecting against insulin resistance. Moreover, it is also plausible that the HCR protected insulin sensitivity because they did not have a HFD induced increase in adiposity like the LCR. All told, these results point to the powerful health implications of intrinsic aerobic capacity on both skeletal muscle and whole body metabolic health and function.
Acknowledgment
The authors would like to thank Dr. Frederico Toledo for his technical advice and expertise for measuring mitochondrial area in TEM images in addition to the Electron Microscopy Core at the University of Missouri for their technical advice. This work was supported with resources and the use of facilities at the Harry S. Truman Memorial Veterans Hospital in Columbia, MO and a Career Development grant from the VA (JPT). This work was also supported by the following grants from the National Institutes of Health: T32 training grant (SJB), NRSA (RSS), and RR17718 from the National Center for Research Resources (LGK and SLB).
References
- Abdul-Ghani MA, Jani R, Chavez A, Molina-Carrion M, Tripathy D, Defronzo RA. Mitochondrial reactive oxygen species generation in obese non-diabetic and type 2 diabetic participants. Diabetologia. 2009;52:574–82. doi: 10.1007/s00125-009-1264-4. [DOI] [PubMed] [Google Scholar]
- Abu-Elheiga L, Oh W, Kordari P, Wakil SJ. Acetyl-CoA carboxylase 2 mutant mice are protected against obesity and diabetes induced by high-fat/high-carbohydrate diets. Proc Natl Acad Sci U S A. 2003;100:10207–12. doi: 10.1073/pnas.1733877100. [DOI] [PMC free article] [PubMed] [Google Scholar]
- Anderson EJ, Lustig ME, Boyle KE, Woodlief TL, Kane DA, Lin CT, et al. Mitochondrial H2O2 emission and cellular redox state link excess fat intake to insulin resistance in both rodents and humans. J Clin Invest. 2009;119:573–581. doi: 10.1172/JCI37048. [DOI] [PMC free article] [PubMed] [Google Scholar]
- Barish GD, Narkar VA, Evans RM. PPAR delta: a dagger in the heart of the metabolic syndrome. J Clin Invest. 2006;116:590–7. doi: 10.1172/JCI27955. [DOI] [PMC free article] [PubMed] [Google Scholar]
- Bradley RL, Jeon JY, Liu FF, Maratos-Flier E. Voluntary exercise improves insulin sensitivity and adipose tissue inflammation in diet-induced obese mice. Am J Physiol Endocrinol Metab. 2008;295:E586–94. doi: 10.1152/ajpendo.00309.2007. [DOI] [PMC free article] [PubMed] [Google Scholar]
- Bruce CR, Hoy AJ, Turner N, Watt MJ, Allen TL, Carpenter K, et al. Overexpression of carnitine palmitoyltransferase-1 in skeletal muscle is sufficient to enhance fatty acid oxidation and improve high-fat diet-induced insulin resistance. Diabetes. 2009;58:550–8. doi: 10.2337/db08-1078. [DOI] [PMC free article] [PubMed] [Google Scholar]
- Crunkhorn S, Dearie F, Mantzoros C, Gami H, da Silva WS, Espinoza D, et al. Peroxisome proliferator activator receptor gamma coactivator-1 expression is reduced in obesity: potential pathogenic role of saturated fatty acids and p38 mitogen-activated protein kinase activation. J Biol Chem. 2007;282:15439–50. doi: 10.1074/jbc.M611214200. [DOI] [PubMed] [Google Scholar]
- Hancock CR, Han DH, Chen M, Terada S, Yasuda T, Wright DC, et al. High-fat diets cause insulin resistance despite an increase in muscle mitochondria. Proc Natl Acad Sci U S A. 2008;105:7815–20. doi: 10.1073/pnas.0802057105. [DOI] [PMC free article] [PubMed] [Google Scholar]
- Hiona A, Leeuwenburgh C. The role of mitochondrial DNA mutations in aging and sarcopenia: implications for the mitochondrial vicious cycle theory of aging. Exp Gerontol. 2008;43:24–33. doi: 10.1016/j.exger.2007.10.001. [DOI] [PMC free article] [PubMed] [Google Scholar]
- Holloway GP, Benton CR, Mullen KL, Yoshida Y, Snook LA, Han XX, et al. In obese rat muscle transport of palmitate is increased and is channeled to triacylglycerol storage despite an increase in mitochondrial palmitate oxidation. Am J Physiol Endocrinol Metab. 2009;296:E738–47. doi: 10.1152/ajpendo.90896.2008. [DOI] [PubMed] [Google Scholar]
- Holloway GP, Thrush AB, Heigenhauser GJ, Tandon NN, Dyck DJ, Bonen A, et al. Skeletal muscle mitochondrial FAT/CD36 content and palmitate oxidation are not decreased in obese women. Am J Physiol Endocrinol Metab. 2007;292:E1782–9. doi: 10.1152/ajpendo.00639.2006. [DOI] [PubMed] [Google Scholar]
- Hulver MW, Berggren JR, Carper MJ, Miyazaki M, Ntambi JM, Hoffman EP, et al. Elevated stearoyl-CoA desaturase-1 expression in skeletal muscle contributes to abnormal fatty acid partitioning in obese humans. Cell Metab. 2005;2:251–61. doi: 10.1016/j.cmet.2005.09.002. [DOI] [PMC free article] [PubMed] [Google Scholar]
- Hulver MW, Berggren JR, Cortright RN, Dudek RW, Thompson RP, Pories WJ, et al. Skeletal muscle lipid metabolism with obesity. Am J Physiol Endocrinol Metab. 2003;284:E741–E747. doi: 10.1152/ajpendo.00514.2002. [DOI] [PubMed] [Google Scholar]
- Ibdah JA, Perlegas P, Zhao Y, Angdisen J, Borgerink H, Shadoan MK, et al. Mice heterozygous for a defect in mitochondrial trifunctional protein develop hepatic steatosis and insulin resistance. Gastroenterology. 2005;128:1381–90. doi: 10.1053/j.gastro.2005.02.001. [DOI] [PubMed] [Google Scholar]
- Kelley DE, Goodpaster B, Wing RR, Simoneau JA. Skeletal muscle fatty acid metabolism in association with insulin resistance, obesity, and weight loss. Am J Physiol. 1999;277:E1130–41. doi: 10.1152/ajpendo.1999.277.6.E1130. [DOI] [PubMed] [Google Scholar]
- Kim JY, Hickner RC, Cortright RL, Dohm GL, Houmard JA. Lipid oxidation is reduced in obese human skeletal muscle. Am J Physiol Endocrinol Metab. 2000;279:E1039–44. doi: 10.1152/ajpendo.2000.279.5.E1039. [DOI] [PubMed] [Google Scholar]
- Koch LG, Britton SL. Artificial selection for intrinsic aerobic endurance running capacity in rats. Physiol Genomics. 2001;5:45–52. doi: 10.1152/physiolgenomics.2001.5.1.45. [DOI] [PubMed] [Google Scholar]
- Koves TR, Li P, An J, Akimoto T, Slentz D, Ilkayeva O, et al. Peroxisome proliferator-activated receptor-gamma co-activator 1alpha-mediated metabolic remodeling of skeletal myocytes mimics exercise training and reverses lipid-induced mitochondrial inefficiency. J Biol Chem. 2005;280:33588–98. doi: 10.1074/jbc.M507621200. [DOI] [PubMed] [Google Scholar]
- Koves TR, Ussher JR, Noland RC, Slentz D, Mosedale M, Ilkayeva O, et al. Mitochondrial overload and incomplete fatty acid oxidation contribute to skeletal muscle insulin resistance. Cell Metab. 2008;7:45–56. doi: 10.1016/j.cmet.2007.10.013. [DOI] [PubMed] [Google Scholar]
- Laye MJ, Rector RS, Borengasser SJ, Naples SP, Uptergrove GM, Ibdah JA, et al. Cessation of daily wheel running differentially alters fat oxidation capacity in liver, muscle, and adipose tissue. J Appl Physiol. 2009;106:161–8. doi: 10.1152/japplphysiol.91186.2008. [DOI] [PMC free article] [PubMed] [Google Scholar]
- Lim S, Ahn SY, Song IC, Chung MH, Jang HC, Park KS, et al. Chronic exposure to the herbicide, atrazine, causes mitochondrial dysfunction and insulin resistance. PLoS One. 2009;4:e5186. doi: 10.1371/journal.pone.0005186. [DOI] [PMC free article] [PubMed] [Google Scholar]
- Lin J, Handschin C, Spiegelman BM. Metabolic control through the PGC-1 family of transcription coactivators. Cell Metab. 2005;1:361–70. doi: 10.1016/j.cmet.2005.05.004. [DOI] [PubMed] [Google Scholar]
- McAinch AJ, Lee JS, Bruce CR, Tunstall RJ, Hawley JA, Cameron-Smith D. Dietary regulation of fat oxidative gene expression in different skeletal muscle fiber types. Obes Res. 2003;11:1471–9. doi: 10.1038/oby.2003.197. [DOI] [PubMed] [Google Scholar]
- Mensink M, Hesselink MK, Russell AP, Schaart G, Sels JP, Schrauwen P. Improved skeletal muscle oxidative enzyme activity and restoration of PGC-1 alpha and PPAR beta/delta gene expression upon rosiglitazone treatment in obese patients with type 2 diabetes mellitus. Int J Obes. (Lond) 2007;31:1302–10. doi: 10.1038/sj.ijo.0803567. [DOI] [PubMed] [Google Scholar]
- Mootha VK, Lindgren CM, Eriksson KF, Subramanian A, Sihag S, Lehar J, et al. PGC-1alpha-responsive genes involved in oxidative phosphorylation are coordinately downregulated in human diabetes. Nat Genet. 2003;34:267–73. doi: 10.1038/ng1180. [DOI] [PubMed] [Google Scholar]
- Muoio DM, MacLean PS, Lang DB, Li S, Houmard JA, Way JM, et al. Fatty acid homeostasis and induction of lipid regulatory genes in skeletal muscles of peroxisome proliferator-activated receptor (PPAR) alpha knock-out mice. Evidence for compensatory regulation by PPAR delta. J Biol Chem. 2002;277:26089–97. doi: 10.1074/jbc.M203997200. [DOI] [PubMed] [Google Scholar]
- Muoio DM, Newgard CB. Obesity-related derangements in metabolic regulation. Annu Rev Biochem. 2006;75:367–401. doi: 10.1146/annurev.biochem.75.103004.142512. [DOI] [PubMed] [Google Scholar]
- Noland RC, Thyfault JP, Henes ST, Whitfield BR, Woodlief TL, Evans JR, et al. Artificial Selection for High Capacity Endurance Running is Protective Against High Fat Diet-Induced Insulin Resistance. Am J Physiol Endocrinol Metab. 2007;293:E31–41. doi: 10.1152/ajpendo.00500.2006. [DOI] [PubMed] [Google Scholar]
- Patti ME, Butte AJ, Crunkhorn S, Cusi K, Berria R, Kashyap S, et al. Coordinated reduction of genes of oxidative metabolism in humans with insulin resistance and diabetes: Potential role of PGC1 and NRF1. Proc Natl Acad Sci U S A. 2003;100:8466–71. doi: 10.1073/pnas.1032913100. [DOI] [PMC free article] [PubMed] [Google Scholar]
- Perdomo G, Commerford SR, Richard AM, Adams SH, Corkey BE, O’Doherty RM, et al. Increased beta-oxidation in muscle cells enhances insulin-stimulated glucose metabolism and protects against fatty acid-induced insulin resistance despite intramyocellular lipid accumulation. J Biol Chem. 2004;279:27177–86. doi: 10.1074/jbc.M403566200. [DOI] [PubMed] [Google Scholar]
- Petersen KF, Dufour S, Befroy D, Garcia R, Shulman GI. Impaired mitochondrial activity in the insulin-resistant offspring of patients with type 2 diabetes. N Engl J Med. 2004;350:664–71. doi: 10.1056/NEJMoa031314. [DOI] [PMC free article] [PubMed] [Google Scholar]
- Powers SK, Ji LL, Leeuwenburgh C. Exercise training-induced alterations in skeletal muscle antioxidant capacity: a brief review. Med Sci Sports Exerc. 1999;31:987–97. doi: 10.1097/00005768-199907000-00011. [DOI] [PubMed] [Google Scholar]
- Priego T, Sanchez J, Pico C, Palou A. Sex-differential expression of metabolism-related genes in response to a high-fat diet. Obesity. 2008;16:819–26. doi: 10.1038/oby.2007.117. [DOI] [PubMed] [Google Scholar]
- Rector RS, Thyfault JP, Morris RT, Laye MJ, Borengasser SJ, Booth FW, et al. Daily exercise increases hepatic fatty acid oxidation and prevents steatosis in Otsuka Long-Evans Tokushima Fatty rats. Am J Physiol Gastrointest Liver Physiol. 2008;294:G619–26. doi: 10.1152/ajpgi.00428.2007. [DOI] [PubMed] [Google Scholar]
- Ritov VB, Menshikova EV, He J, Ferrell RE, Goodpaster BH, Kelley DE. Deficiency of subsarcolemmal mitochondria in obesity and type 2 diabetes. Diabetes. 2005;54:8–14. doi: 10.2337/diabetes.54.1.8. [DOI] [PubMed] [Google Scholar]
- Rodgers JT, Lerin C, Gerhart-Hines Z, Puigserver P. Metabolic adaptations through the PGC-1 alpha and SIRT1 pathways. FEBS Lett. 2008;582:46–53. doi: 10.1016/j.febslet.2007.11.034. [DOI] [PMC free article] [PubMed] [Google Scholar]
- Simoneau JA, Kelley DE. Altered glycolytic and oxidative capacities of skeletal muscle contribute to insulin resistance in NIDDM. J Appl Physiol. 1997;83:166–71. doi: 10.1152/jappl.1997.83.1.166. [DOI] [PubMed] [Google Scholar]
- Sparks LM, Xie H, Koza RA, Mynatt R, Hulver MW, Bray GA, et al. A high-fat diet coordinately downregulates genes required for mitochondrial oxidative phosphorylation in skeletal muscle. Diabetes. 2005;54:1926–33. doi: 10.2337/diabetes.54.7.1926. [DOI] [PubMed] [Google Scholar]
- St-Pierre J, Lin J, Krauss S, Tarr PT, Yang R, Newgard CB, et al. Bioenergetic analysis of peroxisome proliferator-activated receptor gamma coactivators 1alpha and 1beta (PGC-1alpha and PGC-1beta) in muscle cells. J Biol Chem. 2003;278:26597–603. doi: 10.1074/jbc.M301850200. [DOI] [PubMed] [Google Scholar]
- Thyfault JP, Cree MG, Zheng D, Zwetsloot JJ, Tapscott EB, Koves TR, et al. Contraction of insulin-resistant muscle normalizes insulin action in association with increased mitochondrial activity and fatty acid catabolism. Am J Physiol Cell Physiol. 2007;292:C729–39. doi: 10.1152/ajpcell.00311.2006. [DOI] [PubMed] [Google Scholar]
- Thyfault JP, Kraus RM, Hickner RC, Howell AW, Wolfe RR, Dohm GL. Impaired plasma fatty acid oxidation in extremely obese women. Am J Physiol Endocrinol Metab. 2004;287:E1076–1081. doi: 10.1152/ajpendo.00177.2004. [DOI] [PubMed] [Google Scholar]
- Thyfault JP, Rector RS, Uptergrove GM, Borengasser SJ, Morris EM, Wei Y, et al. Rats selectively bred for low aerobic capacity have reduced hepatic mitochondrial oxidative capacity and susceptibility to hepatic steatosis and injury. J Physiol. 2009;587:1805–16. doi: 10.1113/jphysiol.2009.169060. [DOI] [PMC free article] [PubMed] [Google Scholar]
- Toledo FG, Menshikova EV, Ritov VB, Azuma K, Radikova Z, DeLany J, et al. Effects of physical activity and weight loss on skeletal muscle mitochondria and relationship with glucose control in type 2 diabetes. Diabetes. 2007;56:2142–7. doi: 10.2337/db07-0141. [DOI] [PubMed] [Google Scholar]
- Turcotte LP, Swenberger JR, Tucker M. Zavitz, Yee AJ. Increased fatty acid uptake and altered fatty acid metabolism in insulin-resistant muscle of obese Zucker rats. Diabetes. 2001;50:1389–96. doi: 10.2337/diabetes.50.6.1389. [DOI] [PubMed] [Google Scholar]
- Turner N, Bruce CR, Beale SM, Hoehn KL, So T, Rolph MS, et al. Excess lipid availability increases mitochondrial fatty acid oxidative capacity in muscle: evidence against a role for reduced fatty acid oxidation in lipid-induced insulin resistance in rodents. Diabetes. 2007;56:2085–92. doi: 10.2337/db07-0093. [DOI] [PubMed] [Google Scholar]
- Wisloff U, Najjar SM, Ellingsen O, Haram PM, Swoap S, Al-Share Q, et al. Cardiovascular risk factors emerge after artificial selection for low aerobic capacity. Science. 2005;307:418–20. doi: 10.1126/science.1108177. [DOI] [PubMed] [Google Scholar]