

Abstract
Here we present methods to longitudinally track islet allograft—infiltrating T cells in live mice by endoscopic confocal microscopy and to analyze circulating T cells by in vivo flow cytometry. We developed a new reporter mouse whose T cell subsets express distinct, ‘color-coded’ proteins enabling in vivo detection and identification of effector T cells (Teff cells) and discrimination between natural and induced regulatory T cells (nTreg and iTreg cells). Using these tools, we observed marked differences in the T cell response in recipients receiving tolerance-inducing therapy (CD154-specific monoclonal antibody plus rapamycin) compared to untreated controls. These results establish real-time cell tracking as a powerful means to probe the dynamic cellular interplay mediating immunologic rejection or transplant tolerance.
Understanding the cellular immune response to transplanted tissue has a key role in developing strategies to improve transplant outcomes. Tissue biopsy is the standard method for accessing immune cell infiltration in the graft, but the method is both invasive and inadequate when temporal information is needed to characterize an immune reaction that progresses dynamically over time. Advances in molecular imaging techniques that combine cell labeling with the use of whole-body imaging modalities such as positron emission tomography, magnetic resonance imaging and bioluminescence imaging have led to promising approaches for tracking immune cells noninvasively in vivo1–4, but these methods lack the sensitivity and spatial resolution to quantify events at the single-cell level. In addition, there is need to track multiple cell populations using labels that are not diluted by cell division.
Here we describe a real-time optical method for simultaneous tracking of multiple T cell subsets that are color-coded with distinct fluorescent reporters in a mouse model in which pancreatic islet transplants are placed beneath the renal capsule. As rejection occurs at 2 weeks in control untreated hosts, we track the T cell response for a period of 2 weeks after transplantation in both the circulatory compartment (by in vivo flow cytometry)5 and within the allograft (by endoscopic confocal microscopy)6. In vivo flow cytometry allows noninvasive, continuous detection and quantification of fluorescently labeled cells in the circulation without the need to draw blood samples5. Endoscopic confocal microscopy enables minimally invasive imaging of internal organs with cellular definition by inserting a narrow-diameter endomicroscope through a small incision in the skin6. We show that repeated imaging of the islet allograft just beneath the renal capsule can be accomplished in the same mouse over the two-week period.
Islet transplantation is a promising clinical approach to restore insulin production and glucose regulation in patients with type 1 diabetes. The immune response to allogeneic islet transplants is CD4+ T cell dependent7–9, and includes both donor reactive, tissue-destructive Teff cells and tissue-protective Treg cells. The acquisition of transplant tolerance, a state in which the transplant is not rejected despite the cessation of immunosuppressive therapy, is associated with an alteration in the functional balance of Teff and Treg cells, as deduced in passive lymphocyte transfer experiments10–12. In addition, the pool of Treg cells includes both nTreg and iTreg populations that arise during intrathymic T cell maturation or in the periphery when naive CD4+ T cells are activated by antigen in the presence of transforming growth factor-β (TGF-β) and in the absence of interleukin-6 (IL-6) and IL-21, respectively13,14. The relative importance of iTreg and nTreg cells in the induction and maintenance of transplant tolerance is unclear because it has not been possible to readily distinguish these two Treg subsets in vivo. Using our cell tracking technology, together with the color-coding scheme, we are now able to monitor not only Teff and Treg cells but also distinguish nTreg from iTreg cells in live mice to serially analyze the immune response to rejecting or tolerized major histocompatibility complex–mismatched islet transplants. As part of this study, we have tested the hypotheses that tolerance-inducing therapy will accelerate the rate and magnitude of conversion or accumulation of iTreg cells from naive alloreactive T cells and lead to a profound increase in the number of allograft-infiltrating Treg cells.
Results
Imaging and quantification of graft-infiltrating T cells
For islet transplantation, we first prepared C57BL/6 Rag1−/− recipient mice that lack lymphocytes by adoptive transfer of 1 × 10⁶ nTreg cells (DsRed−CD4+GFP+) purified from C57BL/6 Foxp3-eGFP regulatory T cell reporter mice13 together with 9 × 10⁶ Teff cells (DsRed+CD4+GFP−) purified from C57BL/6 DsRed–knock-in mice (Fig. 1a). The proportion and number of transferred nTreg and Teff cells mimicked those present in normal wild-type mice (Supplementary Fig. 1a). On the next day, we placed a DBA/2 allogeneic islet graft underneath the left renal capsule (Supplementary Fig. 1a,b)8. One group of recipients received a tolerance-inducing protocol consisting of a 14-d course of CD154-specific monoclonal antibody (mAb) plus rapamycin. This regimen promotes conversion of antigen-activated naive T cells to iTreg cells and donor-specific allograft tolerance15. In untreated hosts, all islet allografts were rejected by 14 d after transplantation (mean graft survival time, 12 d), whereas allografts in hosts receiving CD154-specific mAb plus rapamycin tolerizing treatment survived indefinitely (Fig. 1b).
Figure 1.
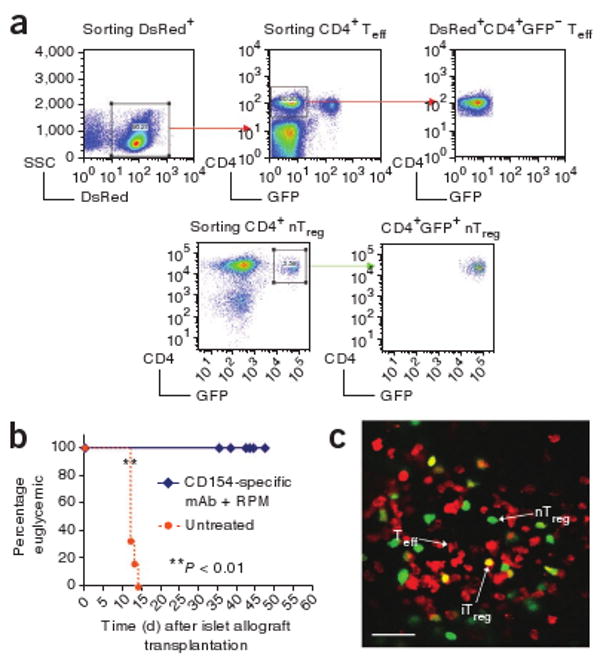
In vivo imaging of color-coded T cells. (a) FACS sorting of DsRed+CD4+GFP− red Teff cells from DsRed–knock-in mice and CD4+GFP+ green nTreg cells from the original knock-in mice. (b) Graft survival curves of mice treated with CD154-specific mAb plus rapamycin and untreated rejecting controls. The difference in the survival curves is significant, as calculated by either log-rank (Mantel-Cox) (P = 0.0004) or Gehan-Breslow-Wilcoxon (P = 0.0012) tests. (c) Representative image of allograft-infiltrating nTreg (green), Teff (red) and iTreg cells (yellow) acquired by intravital microscopy. Scale bar, 50 μm.
We took a two-step approach to imaging the islet allograft. First, we verified our ability to identify and enumerate various T cell subsets at this location by intravital microscopy. Subsequently, we developed a minimally invasive method to accomplish these tasks through an endomicroscope.
Under appropriate conditions, CD4+Foxp3− Teff cells can convert into a Foxp3+ phenotype, a characteristic of iTreg cells16,17. To validate our color-coded system, we monitored in vitro conversion of Teff to iTreg cells by culturing purified Teff cells collected from Ds-Red–knock-in mice (DsRed+CD4+GFP−) with DBA/2-derived B220+ splenic B cells in complete medium containing recombinant mouse TGF-β, IL-2 plus IL-4-specific and interferon-γ-specific antibodies13,18. Approximately 85% of Teff cells cultured in these conditions acquired eGFP expression within 4 d (Supplementary Fig. 2), indicating their conversion to iTreg cells.
Similarly, in our in vivo model, some DsRed+CD4+GFP− Teff cells converted to Foxp3+GFP+ iTreg cells after transplantation and become yellow (Fig. 1c). These yellow iTreg cells (DsRed+CD4+GFP+) could be readily distinguished from the green nTreg cells (DsRed−CD4+GFP+) that were originally transferred from the knock-in mice. Thus, we created a color-coded system in which Teff cells were red, nTreg cells were green and iTreg cells were yellow (Fig. 1c). To verify that yellow cells were true double-positives and not an artifact created by overlapping red (Teff) and green (nTreg) cells within the allograft, we acquired Z-stack images in 1- to 2-μm steps (Supplementary Video 1) and generated reconstructed orthogonal slices (xz and yz planes) for analysis (Supplementary Fig. 3). Only red and green double-positive T cells that were negative in the third autofluorescence channel were identified as iTreg cells (Supplementary Fig. 4).
Using intravital microscopy on days 1 and 4 after transplantation, very few T cells were identified within the islet allografts in either untreated hosts or hosts treated with CD154-specific mAb plus rapamycin (data not shown). On weeks 1 and 2 after transplantation, the densities of allograft-infiltrating T cells were much greater in untreated hosts than in treated hosts, with a predominant pattern of allograft infiltration by red Teff cells (Fig. 2a). We analyzed only those images taken from the islet allograft sites, which can be readily distinguished from the surrounding kidney structure by their distinctive autofluorescence pattern (Supplementary Fig. 5). To our surprise, when we determined the absolute cell density of the three subsets of infiltrating T cells, the densities of allograft-infiltrating nTreg and iTreg cells were comparable in untreated and treated hosts at weeks 1 and 2 after transplantation (Fig. 2b,c). The prominent difference was the density of infiltrating Teff cells, which was consistently and significantly higher in untreated hosts than in treated hosts at weeks 1 and 2 (Fig. 2d). As a result, the ratio of infiltrating nTreg and iTreg cells to infiltrating Teff cells in treated hosts was much higher than in untreated hosts (Fig. 2e,f). Infiltration of the allograft by nTreg cells was more prominent than infiltration by iTreg cells.
Figure 2.
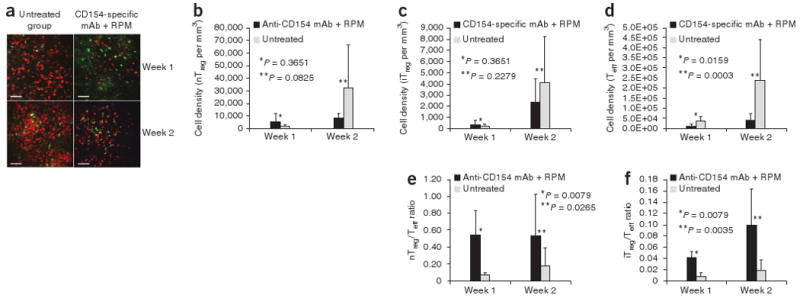
Analysis of infiltrating T cells within islet allografts. (a) Representative intravital microscopy images showing T cell infiltration within islet allografts in untreated hosts and hosts treated with CD154-specific mAb plus rapamycin on week 1 and week 2 after transplantation. Scale bar, 100 μm. (b–d) Summary of cell density of islet allograft–infiltrating nTreg (b), iTreg (c) and Teff (d) cells, as detected by intravital imaging. (e,f) Summary of the ratios of islet allograft–infiltrating nTreg to Teff (e) and iTreg to Teff (f) cells, as detected by intravital imaging. Error bars represent means ± s.d.
To follow the time course of the T cell response in individual animals receiving islet transplants, we performed minimally invasive imaging with a 1.24-mm diameter endomicroscope inserted through a small incision in the skin6. This instrument allowed repeated imaging of the allograft site with minimal surgical manipulation and was able to resolve individual allograft infiltrating T cells (Fig. 3). By serially imaging the same mice at days 3, 5, 7, 10, 12 and 14 after islet transplantation, we obtained the kinetics of T cell infiltration in both the hosts treated with CD154-specific mAb plus rapamycin treated hosts and the untreated controls. Consistent with the intravital microscopy data, we observed a pronounced difference between the two hosts starting at day 7, dominated by the markedly increased number of red (Teff) cells in the untreated allograft (Fig. 3).
Figure 3.
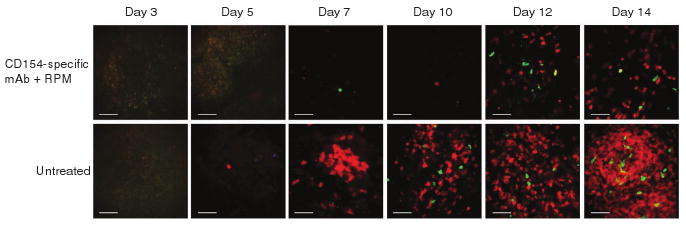
Serial endomicroscopy of infiltrating T cells within islet allografts. Representative endomicroscopy images within islet allografts on days 3, 5, 7, 10, 12 and 14 after transplantation in untreated hosts and hosts treated with CD154-specific mAb plus rapamycin. Each row of images is from the same mouse at the given time points. Infiltrating nTreg (green), Teff (red) and iTreg cells (green + red) accumulate in the allograft over time. Scale bar, 50 μm.
Flow cytometry analysis of color-coded T cells
To test the accuracy of our color-coded system, we reconstituted C57BL/6 CD45.2+ Rag1−/− mice with 1 × 10⁶ CD45.2+DsRed−CD4+ GFP+ nTreg cells from knock-in mice and 9 × 10⁶ CD45.1+ DsRed+CD4+GFP− eff cells from CD45.1+ CD45.2+ (F1 generation) DsRed–knock-in mice. Islet allografts were performed exactly as described previously8. We analyzed spleen samples from both untreated recipients and recipients treated with CD154-specific mAb plus rapamycin 2 weeks after transplantation (Table 1). In untreated hosts, 98.9% of all CD4+DsRed+ T cells were CD4+CD45.1+, whereas in treated hosts the percentage was 96.2%. Similarly, 97.5% and 88.5% of CD4+CD45.1+ cells were CD4+DsRed+ in untreated and treated hosts, respectively. To identify false positives, we determined the percentages of CD4+CD45.1+ cells in the CD4+DsRed− population and CD4+DsRed+ cells in CD4+CD45.1− population. In the untreated hosts, the percentages were 2.4% and 1.1%, respectively, whereas the percentages in the treated hosts were 8.3% and 2.6%, respectively. Thus, the detection of cell subsets via analysis of cell surface CD45 isoform expression as an independent marker validated the accuracy of the color-coded system.
Table 1. External validation of DsRed with the congenic marker CD45.1 by ex vivo flow cytometry.
| CD45.1+ in DsRed+ | Untreated | 98.9% |
| population | CD154-specific mAb plus rapamycin | 96.2% |
| DsRed+ in CD45.1+ | Untreated | 97.5% |
| population | CD154-specific mAb plus rapamycin | 88.5% |
| CD45.1+ in DsRed− | Untreated | 2.4% |
| population | CD154-specific mAb plus rapamycin | 8.3% |
| DsRed+ in CD45.1− | Untreated | 1.1% |
| population | CD154-specific mAb plus rapamycin | 2.6% |
The correlation of the CD45.1 congenic marker with DsRed was calculated from spleen samples from the untreated mice and mice treated with CD154-specific mAb plus rapamycin on week 2 after transplantation by ex vivo flow cytometry on the basis of the percentage of CD4+CD45.1+ cells in the CD4+DsRed+ population and on the percentage of CD4+DsRed+ cells in the CD4+CD45.1+ population. False positives were calculated as the percentages of CD4+CD45.1+ cells in the CD4+DsRed− population and DsRed+ cells in the CD4+CD45.1− population.
We used ex vivo flow cytometry analysis to determine the number, distribution and ratios of red Teff green nTreg and yellow iTreg cells in the allograft-draining lymph node at 2 weeks after islet transplantation from both untreated hosts and hosts treated with CD154-specific mAb plus rapamycin (Supplementary Table 1). The ratio of iTreg to Teff cells in the allograft was consistently elevated in treated hosts at 1 week and 2 weeks after transplantation and in the draining lymph node at 2 weeks after transplantation (Supplementary Table 1). The ratio of nTreg to Teff cells in the allograft was consistently elevated in treated hosts compared to untreated hosts at 1 week and 2 weeks after transplantation, but, in the draining lymph node at 2 weeks, the difference between treated and untreated hosts disappeared (Supplementary Table 1). As might be anticipated, the ratios were far more variable in spleen and nonallograft-draining peripheral lymph node, sites that are distant from the transplant (data not shown). Nonetheless, the ratios of iTreg cells to Teff cells and nTreg cells to Teff cells were consistently higher in hosts treated with CD154-specific mAb plus rapamycin compared to untreated hosts in spleen and peripheral nondraining lymph node (data not shown).
Monitoring circulating T cells by in vivo flow cytometry
To determine whether these T cell subtypes can be detected in the peripheral blood, we serially monitored the number of fluorescent cells flowing through an ear artery by in vivo flow cytometry. In both hosts treated with CD154-specific mAb plus rapamycin and untreated hosts, we detected circulating Teff and nTreg cells by 2 d after transplantation, and we detected iTreg cells by 4 d after transplantation (Fig. 4a). The number of circulating T cells increased from day 2 to week 1 after transplantation, with Teff cells greatly outnumbering both Treg cell populations (Fig. 4b), but we did not identify any statistically significant difference between the two groups. Circulating Teff cells were significantly more abundant in untreated hosts than in hosts treated with CD154-specific mAb plus rapamycin at week 2, at which time the allograft was undergoing rejection in the untreated control mice (Fig. 1b). In contrast, there was still no statistical difference in the numbers of Treg cells identified in these two groups. The ratio of Treg to Teff cells in the circulation was significantly higher in hosts treated with CD154-specific mAb plus rapamycin as compared to untreated hosts at weeks 1 and 2 after transplantation (Fig. 4c).
Figure 4.
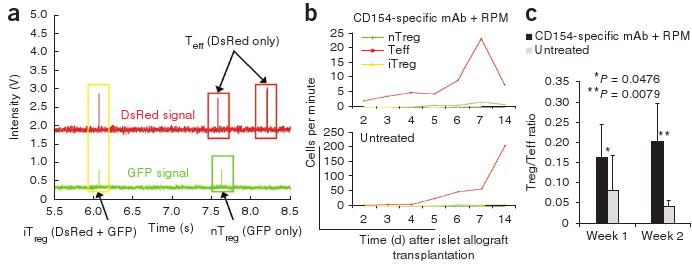
Detection of nTreg, Teff and iTreg cells by in vivo flow cytometry in the peripheral blood. (a) A representative in vivo flow cytometry trace showing the identification of single positive nTreg (green box), Teff (red boxes) and double-positive iTreg (yellow box) cells. The second peak in the DsRed channel occurred about 45 ms before the second peak in the GFP channel. As this time difference was greater than the uncertainty of the measurements, these two peaks were distinguished as separate cells and not a double-positive iTreg cell. (b) In vivo flow cytometry showing Teff (red), nTreg (green) and iTreg cells (yellow) in the peripheral blood. There is a ten-fold difference in scale between mice treated with CD154-specific mAb plus rapamycin and untreated mice. Each curve represents serial analysis of the same blood vessel of the same animal. (c) Summary of the ratio of circulating Treg to Teff cells, as detected by in vivo flow cytometry. Error bars represent means ± s.d.
Discussion
Analysis of the T cell-dependent immune response to allogeneic tissues has been hampered by the inability to serially identify iTreg and nTreg cell subsets in a living host. The recent development of Treg cell reporter GFP knock-in mice has provided a powerful means to identify the Foxp3+ Treg cell population, but Foxp3 promoter–driven GFP is expressed by both nTreg and iTreg cells13,19.
We have now devised a means to serially analyze the allograft response through application of a unique tricolor-coded reporter system that enables discrimination not only between Teff and Treg cells but also between nTreg and iTreg cells. By placing islet transplants beneath the renal capsule, allograft-infiltrating T cells can be serially analyzed by endoscopic microscopy over time in the same host. Concurrently, subsets of circulating T cells can be quantified in a peripheral artery of the same living host by in vivo flow cytometry, without the need to draw blood samples. Compared to previous studies using traditional immunohistochemistry or standard flow cytometry that provide static ‘snapshots’ of T cell infiltration during allograft response20,21, our technology allows a more complete, serial characterization of the immune response by dynamic tracking of various T cell populations both in the circulatory compartment and at the graft site of the same living host over a course of days to weeks.
With these tools, we have analyzed the T cell response to islet allografts in untreated rejecting recipients and in recipients given a transplant tolerance–inducing regimen22,23. The fate of the allograft, either rejection or tolerance, depends upon the functional balance of alloreactive graft–protecting Treg cells to alloreactive graft–destroying Teff cells11,24–26. In the absence of a favorable change in balance of Treg to Teff cells, the former cells are unable to restrain the latter cells from rejecting the transplant. Although it is known that tolerance cannot readily be induced in major histocompatibility complex–mismatched transplants in the absence of apoptosis of alloreactive T cells22,23, the precise numeric change in the balance between Teff and Treg cells is not known. Moreover, it is not known whether nTreg or iTreg cells predominate in the graft-protective response noted in tolerized hosts. In fact, it is expected but not actually known whether these Treg cell populations expand or accumulate more markedly in tolerized compared to rejecting recipients. Through the implementation of serial microendoscopy, we observed an expected increase in the of iTreg to Teff ratio among CD4+ T cells that infiltrate the transplant in tolerized hosts as compared to rejecting hosts. Although we anticipated a massive increase in conversion or accumulation of iTreg cells in tolerized as compared to rejecting hosts, this hypothesis is not supported by our data, at least within the context of our passive transfer model. We did not observe a striking numeric increase in allograft-infiltrating iTreg cells in tolerized hosts compared to untreated hosts. Also unanticipated was our observation that infiltration of the allograft by nTreg cells predominated over infiltration by iTreg cells. The most dramatic change in the response of tolerized versus rejecting recipients was the pronounced decrease in tempo and magnitude of allograft infiltration by Teff cells, a change that overshadows any change in nTreg or iTreg populations in tolerized hosts. As a consequence, the proportion of allograft-infiltrating Treg to Teff cells is very markedly enhanced in tolerized hosts. These data corroborate and give insight into the key role of reduction of the pool of donor-reactive effector T cells as a precondition for tolerance induction22,23. A reduction in allograft infiltration by graft destructive effector, but not regulatory, T cells enables Treg cells to restrain the ability of the diminished cohort of allograft-infiltrating Teff cells to reject the transplant.
In keeping with the appearance of Treg cells within the allograft, we detected both nTreg and iTreg cells in the peripheral blood by in vivo flow cytometry. Indeed, we detected all three T cell subtypes in the circulation of both rejecting and tolerized hosts, days before they were discerned infiltrating the allografts. In agreement with the imaging data, we did not detect massive conversion of iTreg cells in tolerized hosts, even though the technology is clearly able to detect converted iTreg cells in the circulation, thereby providing unequivocal evidence of the capacity of naive T cells to convert to the Foxp3+ phenotype in vivo. Detection of circulating iTreg cells as early as day 4 after transplantation suggests that iTreg conversion is an inevitable early event in the allograft response. Notably, the circulating Treg to Teff ratio is consistently and substantially higher in tolerized compared to rejecting hosts, raising the possibility that peripheral blood analysis can be used as an early diagnostic method, enabling more timely and effective therapy to improve transplantation outcomes.
The serial application of endoscopic confocal microscopy and in vivo flow cytometry to a color-coded T cell reporter system has enabled a clearer understanding of both quantitative and qualitative characteristics of the CD4+ T cell response to allografts in rejecting and tolerized hosts. Indeed, the hypothesis that we held concerning the ability of co-stimulation blockade–based transplant tolerizing therapy to enable massive expansion of allograft-infiltrating Treg cells, especially iTreg cells, was proven incorrect. Although we have studied the allograft response in a system based on transfer of lymphocytes into lymphopenic hosts, albeit in a manner that minimizes homeostatic proliferation, we believe application of these methods to other models will enable further progress in a meticulous dissection of the cellular and molecular basis of the allograft response. Our studies also point to a clear need for further refinement of the endoscopic imaging technique, so that serial monitoring of the cellular response in the allograft-draining lymph node with minimal invasion will become possible.
Methods
Methods and any associated references are available in the online version of the paper at http://www.nature.com/naturemedicine/.
Supplementary Material
Acknowledgments
This work was supported by grants from the US National Institutes of Health (R21 AI081010 to S.H.Y. and R01 EY14106 to C.P.L. and PO1-AI041521 to T.B.S.) and the Juvenile Diabetes Research Foundation (JDRF 7-2005-1329 to T.B.S. and M.K.).
Footnotes
Note: Supplementary information is available on the Nature Medicine website.
Author Contributions: Z.F. and J.A.S. designed the experiments, conducted research, collected and analyzed data and wrote the manuscript; Y.L., C.M.P., G.S., and V.T. helped conduct research and collected and analyzed data; P.K. and S.H.Y. developed and performed endoscopic microscopy; T.B.S., C.P.L. and M.K. designed the experiments, sponsored the project and wrote the manuscript.
Competing Financial Interests: The authors declare no competing financial interests.
References
- 1.Edinger M, et al. Evaluation of effector cell fate and function by in vivo bioluminescence imaging. Methods. 2003;31:172–179. doi: 10.1016/s1046-2023(03)00127-0. [DOI] [PubMed] [Google Scholar]
- 2.Medarova Z, et al. In vivo imaging of a diabetogenic CD8+ T cell response during type 1 diabetes progression. Magn Reson Med. 2008;59:712–720. doi: 10.1002/mrm.21494. [DOI] [PubMed] [Google Scholar]
- 3.Toso C, et al. Assessment of 18F-FDG-leukocyte imaging to monitor rejection after pancreatic islet transplantation. Transplant Proc. 2006;38:3033–3034. doi: 10.1016/j.transproceed.2006.08.135. [DOI] [PubMed] [Google Scholar]
- 4.Wu YL, et al. In situ labeling of immune cells with iron oxide particles: an approach to detect organ rejection by cellular MRI. Proc Natl Acad Sci USA. 2006;103:1852–1857. doi: 10.1073/pnas.0507198103. [DOI] [PMC free article] [PubMed] [Google Scholar]
- 5.Novak J, et al. In vivo flow cytometer for real-time detection and quantification of circulating cells. Opt Lett. 2004;29:77–79. doi: 10.1364/ol.29.000077. [DOI] [PMC free article] [PubMed] [Google Scholar]
- 6.Kim P, et al. In vivo confocal and multiphoton microendoscopy. J Biomed Opt. 2008;13:010501. doi: 10.1117/1.2839043. [DOI] [PMC free article] [PubMed] [Google Scholar]
- 7.Koulmanda M, et al. Curative and beta cell regenerative effects of α1-antitrypsin treatment in autoimmune diabetic NOD mice. Proc Natl Acad Sci USA. 2008;105:16242–16247. doi: 10.1073/pnas.0808031105. [DOI] [PMC free article] [PubMed] [Google Scholar]
- 8.Koulmanda M, et al. Modification of adverse inflammation is required to cure new-onset type 1 diabetic hosts. Proc Natl Acad Sci USA. 2007;104:13074–13079. doi: 10.1073/pnas.0705863104. [DOI] [PMC free article] [PubMed] [Google Scholar]
- 9.Tran HM, et al. Distinct mechanisms for the induction and maintenance of allograft tolerance with CTLA4-Fc treatment. J Immunol. 1997;159:2232–2239. [PubMed] [Google Scholar]
- 10.Sánchez-Fueyo A, et al. Tim-3 inhibits T helper type 1-mediated auto- and alloimmune responses and promotes immunological tolerance. Nat Immunol. 2003;4:1093–1101. doi: 10.1038/ni987. [DOI] [PubMed] [Google Scholar]
- 11.Strom TB. Is transplantation tolerable? J Clin Invest. 2004;113:1681–1683. doi: 10.1172/JCI22153. [DOI] [PMC free article] [PubMed] [Google Scholar]
- 12.Strom TB, et al. The TH1/TH2 paradigm and the allograft response. Curr Opin Immunol. 1996;8:688–693. doi: 10.1016/s0952-7915(96)80087-2. [DOI] [PubMed] [Google Scholar]
- 13.Bettelli E, et al. Reciprocal developmental pathways for the generation of pathogenic effector TH17 and regulatory T cells. Nature. 2006;441:235–238. doi: 10.1038/nature04753. [DOI] [PubMed] [Google Scholar]
- 14.Korn T, et al. IL-21 initiates an alternative pathway to induce proinflammatory TH17 cells. Nature. 2007;448:484–487. doi: 10.1038/nature05970. [DOI] [PMC free article] [PubMed] [Google Scholar]
- 15.Gao W, et al. Contrasting effects of cyclosporine and rapamycin in de novo generation of alloantigen-specific regulatory T cells. Am J Transplant. 2007;7:1722–1732. doi: 10.1111/j.1600-6143.2007.01842.x. [DOI] [PMC free article] [PubMed] [Google Scholar]
- 16.Fontenot JD, Gavin MA, Rudensky AY. Foxp3 programs the development and function of CD4+CD25+ regulatory T cells. Nat Immunol. 2003;4:330–336. doi: 10.1038/ni904. [DOI] [PubMed] [Google Scholar]
- 17.Wan YY, Flavell RA. Identifying Foxp3-expressing suppressor T cells with a bicistronic reporter. Proc Natl Acad Sci USA. 2005;102:5126–5131. doi: 10.1073/pnas.0501701102. [DOI] [PMC free article] [PubMed] [Google Scholar]
- 18.Zhong X, et al. Reciprocal generation of TH1/TH17 and Treg cells by B1 and B2 B cells. Eur J Immunol. 2007;37:2400–2404. doi: 10.1002/eji.200737296. [DOI] [PubMed] [Google Scholar]
- 19.Fontenot JD, et al. Regulatory T cell lineage specification by the forkhead transcription factor Foxp3. Immunity. 2005;22:329–341. doi: 10.1016/j.immuni.2005.01.016. [DOI] [PubMed] [Google Scholar]
- 20.Joffre O, et al. Prevention of acute and chronic allograft rejection with CD4+CD25+Foxp3+ regulatory T lymphocytes. Nat Med. 2008;14:88–92. doi: 10.1038/nm1688. [DOI] [PMC free article] [PubMed] [Google Scholar]
- 21.Lechler RI, et al. Organ transplantation—how much of the promise has been realized? Nat Med. 2005;11:605–613. doi: 10.1038/nm1251. [DOI] [PubMed] [Google Scholar]
- 22.Li Y, et al. Blocking both signal 1 and signal 2 of T cell activation prevents apoptosis of alloreactive T cells and induction of peripheral allograft tolerance. Nat Med. 1999;5:1298–1302. doi: 10.1038/15256. [DOI] [PubMed] [Google Scholar]
- 23.Wells AD, et al. Requirement for T cell apoptosis in the induction of peripheral transplantation tolerance. Nat Med. 1999;5:1303–1307. doi: 10.1038/15260. [DOI] [PubMed] [Google Scholar]
- 24.Kamradt T, Mitchison NA. Tolerance and autoimmunity. N Engl J Med. 2001;344:655–664. doi: 10.1056/NEJM200103013440907. [DOI] [PubMed] [Google Scholar]
- 25.Zheng XX, et al. The balance of deletion and regulation in allograft tolerance. Immunol Rev. 2003;196:75–84. doi: 10.1046/j.1600-065x.2003.00089.x. [DOI] [PubMed] [Google Scholar]
- 26.Zheng XX, et al. Favorably tipping the balance between cytopathic and regulatory T cells to create transplantation tolerance. Immunity. 2003;19:503–514. doi: 10.1016/s1074-7613(03)00259-0. [DOI] [PubMed] [Google Scholar]
Associated Data
This section collects any data citations, data availability statements, or supplementary materials included in this article.