

Abstract
Background: In the pathophysiology of schizophrenia, aberrant connectivity between brain regions may be a central feature. Diffusion tensor imaging (DTI) studies have shown altered fractional anisotropy (FA) in white brain matter in schizophrenia. Focal reductions in myelin have been suggested in patients using magnetization transfer ratio (MTR) imaging but to what extent schizophrenia may be related to changes in MTR measured along entire fiber bundles is still unknown. Methods: DTI and MTR images were acquired with a 1.5-T scanner in 40 schizophrenia patients and compared with those of 40 healthy participants. The mean FA and mean MTR were measured along the genu of the corpus callosum and the left and right uncinate fasciculus. Results: A higher mean MTR of 1% was found in the right uncinate fasciculus in patients compared with healthy participants. A significant negative correlation between age and mean FA in the left uncinate fasciculus was found in schizophrenia patients but not in healthy participants. Conclusions: Decreased FA in the left uncinate fasciculus may be more prominent in patients with longer illness duration. The increased mean MTR in the right uncinate fasciculus could reflect a compensatory role for myelin in these fibers or possibly represent aberrant frontotemporal connectivity.
Keywords: schizophrenia, diffusion tensor imaging, magnetization transfer ratio, tract-based analysis, uncinate fasciculus, genu of the corpus callosum
Introduction
Using standard anatomical magnetic resonance imaging (MRI) methods, numerous studies have revealed that gray matter volume decreases in the brains of patients with schizophrenia, in particular in the frontotemporal regions.1 These regions do not operate in isolation but form large-scale neural networks for which normal interregional communication is a prerequisite for proper functioning. Indeed, from about the time schizophrenia was defined, it was suggested that aberrant connectivity between these brain regions is a central feature of the disease.2,3 Recently, evidence is accumulating that the integrity of white matter fibers connecting the spatially distinct gray matter regions is compromised in schizophrenia and that impaired functioning of white matter is part of its pathophysiology.4
Diffusion tensor imaging (DTI) and magnetization transfer ratio (MTR) imaging are MRI methods that allow us to study different aspects of the connecting white matter fiber bundles in vivo that cannot be measured using standard T1- or T2-weighted MRI. Using DTI, decreases in fractional anisotropy (FA)—which reflects microstructural directionality5 and to a certain extent fiber integrity—have been found in several studies in schizophrenia (for reviews, see Kanaan et al,6 Kubicki et al,7 and Konrad et al6). Most studies applied voxel-based analysis of DTI images.6–8 More recently, fiber-tracking techniques9,10 are being used to infer fiber integrity along complete tracts.11–13 Using such tract-based analysis methods, characteristic values such as FA can be measured along fiber tracts and subsequently their average values between groups can be compared. As such, tract-based analysis methods are optimal to detect subtle group-related changes that may occur along entire fiber tracts. This is in contrast to voxel-based analyses, which are optimized to detect focal differences in white matter.
In the few studies that applied a tract-based analysis to measure FA in schizophrenia, no differences in mean FA values between groups were found.14–16 However, a significant correlation between higher age and lower mean FA was shown in schizophrenia patients and not in healthy participants.14–16 This group-by-age interaction suggests that the deficits found in schizophrenia may be more prominent in patients with longer illness duration. Indeed, recently, reductions in FA were found in chronically ill and not in first-episode schizophrenia patients compared with healthy participants.17
MTR imaging measures the presence of macromolecules in tissue, including myelin, and thus may provide additional information to DTI on white matter integrity.18–21 A few MTR imaging studies of white matter have been completed in schizophrenia. In the first study, using an region of interest (ROI) approach, reduced mean MTR values were found in the left and right temporal regions but not in the frontal, parietal, and occipital regions.22 Similarly, reductions in mean MTR values were found in the splenium but not in the genu of the corpus callosum.23 Bilaterally reduced MTR was found using a voxel-based analysis in the uncinate fasciculus (with left reductions greater than right reductions) in first-episode schizophrenia patients,24 although another voxel-based analysis study did not find significant reductions in MTR.25 In the one combined DTI and MTR voxel-based analysis study in schizophrenia, decreased MTR was found in the posterior cingulum bundle, corpus callosum, fornix, right internal capsule, and superior occipitofrontal fasciculus bilaterally in schizophrenia patients compared with healthy participants.26 Tract-based analysis of FA in combination with MTR may provide more information about to what extent possible group differences in FA can be attributed to differences in myelination. To our knowledge, no tract-based analysis has been done for MTR in schizophrenia and its associations with age.
In this study, we measured fiber integrity and myelin concentration over entire fiber tracts in schizophrenia. We compared both FA and MTR along averaged white matter tracts27 computed for the uncinate fasciculi, which connect the temporal and frontal lobes, and the genu of the corpus callosum (genu), which connects the frontal lobes of both hemispheres. We selected fibers connecting the frontal lobes of the left and right hemispheres and fibers connecting the frontal and temporal lobes because these brain areas are known to be involved in the pathophysiology of schizophrenia. Indeed, numerous studies have reported decreases in frontal and temporal gray matter volumes and densities.28–30 Moreover, earlier we found decreases in white matter density in the anterior corpus callosum using a voxel-based morphometry approach. Therefore, we hypothesized that fiber integrity as measured using DTI and MTR along the uncinate fasciculi and anterior corpus callosum would be compromised in patients with schizophrenia as compared with healthy participants. In addition, we investigated associations of FA and MTR with age, severity of positive and negative symptoms, outcome, age at onset, duration of illness, and antipsychotic medication intake.
Methods
Subjects
Forty patients with schizophrenia and 40 healthy participants matched for age, gender, handedness, and parental education participated in this study. The healthy participants were recruited by means of local newspaper advertisements. All subjects participated after written informed consent was obtained. The study was approved by the medical ethics committee for research in humans (medisch ethische toetsingscommissie) of the University Medical Center Utrecht, The Netherlands.
All participants underwent extensive psychiatric assessment procedures using the Comprehensive Assessment of Symptoms and History (CASH). Patients met Diagnostic and Statistical Manual of Mental Disorders (Fourth Edition) criteria for schizophrenia. “Age of onset of illness” was defined as the age at which the patients experienced psychotic symptoms for the first time, as obtained from the CASH interview, and Schedule for Affective Disorder and Schizophrenia Lifetime version assessed by 2 independent raters. Diagnostic consensus was achieved in the presence of a psychiatrist. “Duration of illness” was defined as the time between the age of onset of illness and the age at the time of the MRI scan. All healthy participants met research diagnostic criteria for “never mentally ill” and had no first-degree family member with a mental illness or second-degree relatives with a psychotic disorder.
All patients were receiving typical, or atypical, antipsychotic medication at the time of the scan. A table from the Dutch National Health Service (Commissie Farmaceutische Hulp van het College voor Zorgverzekeringen, 2002) was used to calculate the cumulative dosage of typical antipsychotics during the scan interval and to derive the haloperidol equivalents. For atypical antipsychotics, the respective pharmaceutical companies suggested how to convert dosage into haloperidol equivalents (clozapine, 40:1; olanzapine, 2.5:1; risperidone, 1:1, sulpiride, 170:1; quetiapine, 50:1; and sertindole, 2:1). Drug use was assessed with the Composite International Diagnostic Interview. Four patients and 1 healthy participant met the criteria for drug abuse, and 1 patient met the criteria for drug dependency. Drugs used included cannabis (in all 6 subjects) and others (3). For demographics, see table 1.
Table 1.
Demographic Data
| Patients With Schizophrenia (n = 40) | Healthy Participants (n = 40) | |
| Male/female, no. | 30/10 | 29/11 |
| Age, ya | 26.8 (5.8) | 28.0 (7.7) |
| Age, y range | 20–41 | 18–45 |
| Height, cma | 179.3 (9.2) | 182.5 (9.0) |
| Height, cm range | 163–198 | 167–204 |
| Weight, kga | 76.3 (13.3) | 74.3 (9.1) |
| Weight, kg range | 55–110 | 57–92 |
| Handedness—right/left/ambidexter, no. | 37/3/0 | 35/5/0 |
| Level of education, ya | 10.4 (2.5)* | 13.8 (2.2) |
| Parental level of education, ya | 13.6 (2.7) | 13.6 (3.2) |
| Age at first symptoms, ya | 24.7 (5.6) | |
| Age at first symptoms, y range | 16.9–38.4 | |
| Duration of illness, mean (SD), mo | 25.1 (17.4) | |
| Medication at the time of the scanbc | ||
| Typical antipsychotics, no. | 4 | |
| Median (range) Haldol equation | 3.5 (4.7) | |
| Atypical antipsychotics, no. | 29 | |
| Median (range) Haldol equation | 7.1 (12) | |
| No medication at the time of the scan, no. | 0 | |
| Cumulative medicationad | ||
| Typical antipsychotics, no. | 1 | |
| Mean | 106.5 | |
| Atypical antipsychotics, no. | 22 | |
| Mean | 6208.4 (6830.9) | |
| Typical + atypical antipsychotics, no. | 13 | |
| Mean | 10956.2 (9640.3) | |
| PANSS positive symptoms | 15.7 (5.6) | |
| PANSS negative symptoms | 15.6 (5.7) | |
| PANSS general symptoms | 31.0 (7.2) | |
| PANSS total score | 62.3 (15.8) | |
| CAN total score | 14.4 (7.9) |
P < .01.
Values are mean ± SD.
In 7 patients medication information was unavailable.
Haloperidol, broomperidol, pipamperon, thioridazine, flufenazine, perfenazine, zuclopentixol, penfluridol, pimozide, fluspirilen, largactil, and flufenazine were considered typical antipsychotic drugs; clozapine, risperidone, olanzapine, and sertindole were considered atypical antipsychotic drugs.
In 4 patients cumulative medication use was unavailable.
Image Acquisition
MRI scans of the whole brain were made on a 1.5-T Intera Achieva Philips System at the University Medical Center Utrecht using a 6-element SENSE receiver head coil. For each subject DTI scans, an MTR scan and a high-resolution T1-weighted scan (used for anatomical reference) were collected. First, a 3-dimensional T1-weighted coronal (spoiled gradient) echo scan of the whole head was acquired (256 × 256 matrix; echo time (TE) = 4.6 ms; repetition time (TR) = 30 ms; flip angle = 30 degrees; 160–180 contiguous slices; total scan duration = 405–456 s; 1 × 1 × 1.2 mm3 voxels; field of view (FOV) = 256 mm/70%; and parallel imaging applied in both phase-encoding directions with SENSE factor = 1.5). For white matter fiber tract reconstruction and computation of the FA value, 2 transverse DTI scans were acquired (32 diffusion-weighted volumes with different non-collinear diffusion directions with b-factor = 1000 s/mm2 and 8 diffusion-unweighted volumes with b-factor = 0 s/mm2; parallel imaging SENSE factor = 2.5; flip angle = 90 degrees; 60 slices of 2.5 mm; no slice gap; 96 × 96 acquisition matrix; reconstruction matrix 128 × 128; FOV = 240 mm; TE = 88 ms; TR = 9822 ms; no cardiac gating; and total scan duration = 296 s). The MTR was computed on the basis of a 3-dimensional magnetization transfer scan comprising 2 volumes (transverse; 60 slices of 2.5 mm; 128 × 128 acquisition matrix; FOV = 240 mm; flip angle = 8 degrees; TE = 3.7 ms; TR = 37.5 ms; SENSE factor = 2.5). For the second volume an additional off-resonance prepulse was applied (frequency offset = 1100 Hz; 620 degrees; three-lobe sync-shaped). The total scan duration of the MTR scan was 394 s.
Image Processing
The 2 DTI scans were simultaneously realigned and corrected for possible gradient-induced distortions.31 A robust estimation of the diffusion tensors was obtained using M-estimators32 to limit the influence of possible outliers. From the diffusion tensors the FA was computed.33 The FA represents the elongation of the diffusion profile and assumes values between 0 (isotropic diffusion) and 1 (pure 1-dimensional diffusion) and is defined by
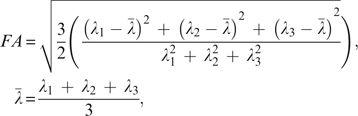 |
where λ1 represents the eigenvalue of the diffusion tensor's major eigenvector pointing in the direction parallel to the fiber bundle and λ2 and λ3 represent the eigenvalues of both minor eigenvectors pointing in the radial directions.
To compute the MTR, the second volume of the magnetization transfer scan was rigidly aligned with the first volume using the ANIMAL software package.34 Mutual information was used as a similarity metric. The MTR was computed on the image Im with the magnetization prepulse and the image I0 without the magnetization prepulse using the equation . The MTR is expressed as a percentage where 0% represents no signal reduction and 100% represents total signal reduction due to magnetization transfer.
For both the MTR (here the scan without the magnetization prepulse was used) and the T1-weighted scan, the rigid transformations were determined that spatially aligned them with the diffusion-unweighted (b = 0 s/mm2) volume of the DTI scan using mutual information as similarity metric. For each subject, a nonlinear transformation was computed using the ANIMAL software package that spatially aligns the subject's T1-weighted scan with a T1-weighted model brain.34,35 This nonlinear transformation was used at a later stage to warp the reconstructed tracts into the model space.
Fiber Tracking and Fiber Bundle Selection
A multiple ROI fiber bundle selection approach36 was used to select the fiber tracts of interest where the reconstruction of the tracts was performed in native space and the selection and analysis of the tracts representing the genu and the left and right uncinate fasciculus were performed in model space.
In the first step, all possible tracts in the brain were reconstructed individually in native space using the diffusion tensor images with an in-house implementation of the fiber assignment by continuous tracking (FACT) algorithm37 with the following parameter settings: 8 seed points per voxel, minimum FA = 0.1, maximum angle = 45 degrees, and maximum average angle with neighboring voxels = 45 degrees. Note that we used a relatively low FA threshold (0.1) to reduce the possibility that systematic group differences in the lower regime of FA values introduce a bias in the reconstruction of the tracts for the patients and controls. It was previously shown that a lowering of the FA threshold does not alter the findings of the tract-based analysis of FA values itself.13 Next, the points of the reconstructed tracts were labeled with the corresponding FA and MTR values after which the tracts were warped into the model space.
In the second step, the ROIs that were needed to select the tracts representing the genu and the left and right uncinate fasciculus were manually delineated on the model brain using an average map with color-coded directional information of the main direction of the tensors (figure 1a). For the left and right uncinate fasciculus, the ROIs were placed in the temporal and prefrontal regions (figure 1b). For the genu, 2 ROIs were placed, 1 in the left and 1 in the right prefrontal region (figure 1c). In addition to remove spurious tracts, a third ROI was placed at the midline, anterior to the ventricles (the blue colored ROI in figure 1c).
Fig. 1.

(a) Transverse Slice of the Model Brain (Top) and the Corresponding Slice of the Color-Coded Directional Group Map of the Main Direction of the Tensors Computed Over All Subjects (Bottom). In this color-coded directional map, the left-right direction in model space is encoded with red, the anterior-posterior direction is encoded with green, and blue encodes the inferior-superior direction. (b) ROIs used for the selection of the tracts representing the left uncinate fasciculus. Note that the ROIs are overinclusive to ensure that they comprise the specific fiber bundles for all subjects. One ROI (light blue) was positioned in the prefrontal region, and the other ROI (yellow) was positioned in the temporal region. The positioning of the ROIs for the right uncinate fasciculus was done in a similar fashion. (c) ROIs used for the selection of the genu of the corpus callosum. The first ROI (red) was placed in the left prefrontal region, and the second ROI (yellow) was placed in the right prefrontal region. A third ROI (light blue) was added at the midline anterior to the ventricles to remove spurious tracts. Computation of the average fiber for the right uncinate fasciculus (d). The spline representation (e) of the fiber bundle was divided in 2-mm regular intervals starting from the center of the spline (denoted by the red disk). (f) The radius of the average fiber denotes the variance of the cross-sectioned coordinates.
Instead of transforming the ROIs defined in model space to each individual subject (native space) in order to select the genu and uncinate fasciuli tracts from the reconstructed tracts, we transformed all reconstructed tracts from each subject into model space. The advantage is that tracts are geometric representations (polylines) that can be transformed without the need for interpolation. This is not the case when the ROIs are transformed from the model to native space because they are defined by voxels.
Computation of Average Fibers
We computed an average fiber27 (in model space) of the genu and left and right uncinate fasciculus for each individual subject. Figure 1 shows an example of the computation of the average fiber for the right uncinate fasciculus. In short, first a spline representation of the shape of the original reconstructed fiber tracts (figure 1d) was created. This spline was then divided in 2-mm regular intervals starting from the center of the spline. This center was defined by the geometric center of the midpoint coordinates of all tracts of the fiber bundle perpendicularly projected onto the spline (the center is denoted by the red plane in figure 1e). For each of these points, we defined planes that are perpendicular to the spline. These planes (the position and direction of these planes are denoted by the green disks in figure 1e) were used to resample the original reconstructed fiber tracts (figure 1d). Each plane was cross-sectioned with the original tracts of the fiber bundle. The cross-sectional coordinates were averaged to form the coordinate of the average fiber in this plane. For each separate plane, the MTR and FA values of the cross-sectional coordinates of the original tracts were averaged to produce the average FA and MTR values for that plane. (Note that averaging was done over the reconstructed tracts in model space and did not incorporate resampling of the original voxel data.) The average cross-sectional coordinates of all the planes together with the corresponding average FA and MTR values then formed the average fiber. For each subject, the final mean FA and mean MTR values were computed by averaging the FA and MTR values, respectively, of all points of an average fiber. These final mean FA and MTR values were computed for each subject and for each average fiber representation of the genu and the left and right uncinate fasciculus.
In addition, we computed group average fibers over all individual average fibers for visualization purposes (figure 2). These group average fibers allowed us to resample each individual average fiber in order to visualize the locality of possible group effects.
Fig. 2.

Fractional Anisotropy (FA) and Magnetization Transfer Ratio (MTR) Measurements along the Uncinate Fasciculi. (a) FA and MTR values in patients (red rectangle up) and healthy participants (blue rectangle down) with a 2-mm interval along the left uncinate fasciculus (left) and right uncinate fasciculus (right). Note that the bars represent +1 and −1 standard error of the mean. For both uncinate fasciculi, no differences in FA were found between patients and healthy participants. The MTR in the right uncinate fasciculus measured along the complete fiber was significantly higher in patients than in healthy participants. In contrast, comparison at a local level (ie, per 2-mm interval) did not reveal significant differences in MTR or FA (after Bonferroni correction for multiple comparisons with the number of comparisons set to 43). (b) Local differences in MTR between patients and healthy participants along the average group fiber of the right uncinate fasciculus (more reddish color represents higher local MTR in patients).
Statistical Analysis
Mean MTR and mean FA measurements were analyzed using SPSS 15.0. Data were examined for outliers, extreme values, and normality of distribution. No normality transformations were needed. Using general linear modeling, multiple univariate analyses of covariance were done with the mean MTR and mean FA of each separate average fiber as dependent variables, group (schizophrenia, healthy participants) entering as fixed factor, and age and gender as covariates. For dependent variables that differed significantly between groups, Pearson product-moment correlations were computed for each group separately (or in patients only) between mean MTR and mean FA, between mean MTR/FA and level of education, and between mean MTR/FA and clinical variables. For the genu and the left and right uncinate fasciculus, the correlations between age and mean FA and age and mean MTR were computed separately for schizophrenia patients and healthy participants. A z statistic was computed (after Fisher's Z transform) to test if these correlations differ between groups.
Results
FA and MTR
A significant increase in mean MTR was found in the right uncinate fasciculus in patients with schizophrenia compared to healthy participants (F(1,76) = 15.56, P = .0001), which remained significant after Bonferroni correction for multiple comparisons (table 2). No changes in mean FA were found in the right uncinate fasciculus in patients with schizophrenia compared with healthy participants (F(1,76) = 0.76, P = .31). No significant changes in mean FA or mean MTR in the left uncinate fasciculus or genu were found between groups. Excluding subjects with drug abuse or drug dependency from the sample did not alter the findings. To obtain additional information on whether the measured MTR group differences could be related to myelin concentrations, a post hoc analysis was performed on the so-called transverse diffusivity. The transverse diffusivity is defined as the average of the 2 minor eigenvalues, , and shows a higher correlation with myelin concentrations than FA.38 No significant group differences were found in transverse diffusivity for any of the fiber bundles.
Table 2.
Fractional Anisotropy (FA) and Magnetization Transfer Ratio (MTR) Values in Individual Tracts of Patients With Schizophrenia and Healthy Participantsa
| Mean (SD) FA Values |
Mean (SD) MTR Values |
|||||
| Tracts | Patients | Healthy Participants | F(1,76) | Patients | Healthy Participants | F(1,76) |
| Genu of corpus callosum | 0.58 (0.04) | 0.57 (0.04) | 1.45 | 61.96 (1.16) | 61.95 (0.78) | 0.00 |
| Left uncinate fasciculus | 0.46 (0.03) | 0.47 (0.03) | 0.83 | 61.43 (0.68) | 61.29 (0.66)b | 0.06b |
| Right uncinate fasciculus | 0.47 (0.03) | 0.46 (0.03) | 0.76 | 61.77 (0.62) | 61.17 (0.62) | 15.56** |
P < .0001.
Tract-based comparisons between groups are corrected for age and gender. FA and MTR measurements are based on 39 patients and 40 control subjects for the right uncinate fasciculus because in 1 patient the right uncinate fasciculus could not be tracked.
After removal of 1 outlier from healthy participants (MTR values including outlier were 61.28 (0.90) for healthy participants and F(1,76) was 0.51).
A significant difference between correlations of mean FA with age (z = −2.28, P = .02) was found between schizophrenia patients and healthy participants in the left uncinate fasciculus (figure 3). To determine whether possible medication effects could explain this finding, an additional post hoc analysis was performed where the cumulative medication was regressed out from the measured FA values in patients before computing the difference in correlations between age and FA between patients with schizophrenia and healthy comparison subjects. This resulted in a difference in correlations between age and FA in patients with schizophrenia compared with healthy participants for the left uncinate fasciculus that was significant at the trend level (z = −1.91, P = .056). For the genu, the difference (z = −1.43) found between schizophrenia patients and healthy participants did not reach significance.
Fig. 3.

Correlation Between Age and Fractional Anisotropy for Patients (r = −0.36, P = .02) (Red Rectangle Up) and Healthy Participants (r = −0.15, P = .36) (Blue Rectangle Down) in the Left Uncinate Fasciculus (Left) and Right Uncinate Fasciculus (Right).
Correlation analysis between mean MTR and mean FA in the genu and the left and right uncinate fasciculus in patients or in healthy participants did not reveal any significant correlations.
Associations of the Uncinate Fasciculus with Clinical Symptoms, Education, and Antipsychotic Medication
No significant correlations of mean FA and mean MTR in the right uncinate fasciculus were found with age at first symptoms, duration of illness, positive and negative and general symptoms of the positive and negative syndrome scale, total Camberwell Assessment of Need score, and antipsychotic medication intake at the time of the scan. There were no significant correlations (corrected for age, gender, and duration of illness) between cumulative antipsychotic medication use and mean MTR or between cumulative antipsychotic medication use and mean FA, in the genu and the left or right uncinate fasciculus.
A significant correlation was found between mean MTR in the left uncinate fasciculus with the extent of negative symptoms (r = −.55, P < .0001), which remained significant after Bonferroni correction for multiple comparisons. There were no significant correlations of mean MTR and mean FA in the left uncinate fasciculus with any of the other clinical variables. No significant correlations were found between mean MTR in the genu and mean MTR in the right uncinate fasciculus with any of the clinical variables.
Discussion
In this study, FA and the magnetization transfer ratio (MTR) were measured using DTI and MTR imaging along the uncinate fasciculi and the genu of the corpus callosum in the brains of 40 patients with schizophrenia and compared with those of 40 healthy participants. Our main finding is a significant higher mean MTR of 1%, with no differences in mean FA, in the right uncinate fasciculus in the patients with schizophrenia compared with healthy participants. The MTR increases were found along large parts of the fiber (figure 2) and were not limited to local changes of the tract which serves as an indication that these increases reflect schizophrenia-related changes that affect entire fiber tracts. In addition, a significant negative correlation between age and mean FA in the left uncinate fasciculus was found in schizophrenia patients but not in healthy participants.
The significant difference in correlations between age and FA in patients compared with healthy participants (figure 3) suggests that in patients FA reductions become more apparent with age (mean age in patients was 26.8 years, range between 20 and 41 years). However, medication effects could be an important factor that should be taken into account when interpreting the results. The results of the additional post hoc analysis where cumulative medication was taken into account indicate that, although medication effects may play a role, they cannot completely explain the measured differences in correlations between age and FA values. Our results support recent findings16 of a tract-based analysis that reported significant differences in correlations between age and FA in patients with schizophrenia compared with healthy participants for the left and right uncinate fasciculus combined. The fact that we found this correlation in the left and not in the right uncinate fasciculus is in keeping with the previous findings showing decreases in FA in the left but not in the right uncinate fasciculus of schizophrenia patients who were on average 43 years.39
If the difference in correlation between age and FA predominantly relates to changes in myelination, then one may expect to find similar differences in correlation between age and MTR because MTR appears to show a higher correlation with myelin levels than FA.40 We did not find a difference in correlations between age and MTR in patients compared with healthy participants. Therefore, our findings at least suggest that the differences in correlation between age and FA in the left uncinate fasciculus are not myelin level related.
Our finding of increased MTR in the right uncinate fasciculus suggests altered connectivity between the right frontal and temporal cortices in schizophrenia and may imply increased myelin concentrations in the largest fiber bundle connecting the medial frontal and temporal cortices. Because increased myelin concentrations along the fiber have been associated with more efficient axonal relaxation,41 an increase in myelin in the uncinate fasciculus suggests an increased level of signal transfer between frontal and temporal cortices that could reflect a compensation mechanism for decreased interhemispheric connectivity in schizophrenia.35,42 The notion that increased MTR reflects increased myelination in the right hemisphere is in keeping with the results of functional studies showing increased levels of activation in the right frontal cortex in schizophrenia.43–46 In this context, it should be noted that increased communication speed does not necessarily lead to increased communication efficiency.47 The increased MTR could also result from compensation of aberrant brain functioning elsewhere in the brain, for instance in the left hemisphere.48 If, however, increases in myelin are responsible for the measured increase in MTR, then one might also expect (to some extent) a reduction in transverse diffusivity, which is defined by the average of the minor eigenvalues of the diffusion tensor.38 However, the post hoc analysis of the transverse diffusivity in the right uncinate fasciculus did not reveal any group-related differences, suggesting that our MTR findings may not (only) reflect increased myelination. An alternative explanation for the increased mean MTR in the right uncinate fasciculus in patients should therefore be considered, namely that it might reflect compromised connectivity not directly related to myelin.
MTR does not only depend on the macromolecule concentration but also (among others) depend on T1 relaxation times of free water molecules.21 Prolonged T1 relaxation times in white matter do not reflect a difference in myelination, but a change in the free/bound water fraction. Interestingly, prolonged T1 relaxation times in the white matter of the right hemisphere have been reported for schizophrenia.49 Such an increase in T1 could effectively lead to an increase in MTR. An alternative explanation for the increased mean MTR in the right uncinate fasciculus in patients might involve changes in metabolites in white matter. Although we can only speculate, the increased mean MTR may be (indirectly) related to decreased glutamate and glutamine levels. In that case, the increased mean MTR could be due to a prolonged T1 relaxation time reflecting an altered free/bound water fraction possibly related to changes in glial glutamate uptake.50,51 MTR levels have been negatively correlated with glutamate and glutamine levels in white matter as measured with MR spectroscopy.52–54
The average FA in the genu of the corpus callosum appeared lower in older patients as compared with older control participants, but this finding did not reach significance. In the genu of the corpus callosum, a decrease in FA in patients compared with healthy participants was reported earlier13,55,56 although others did not find group differences in mean FA.12,23
The absence of such a difference in FA in this study may be due to the relative low mean age (22.6 years) combined with an age span of 18–45 years of our population because such FA reductions appear to become more pronounced with age.17 Another possible explanation may be that the reported differences in FA are of more focal nature while tract-based analysis is most sensitive to group differences that are found along large parts of the tracts. Both explanations may hold for the fact that in a previous study from our group35 structural decreases in density were found using voxel-based morphometry in the genu for patients with schizophrenia (age span 16.3–67.9 years, mean age 36.6 years).
Although the measured difference in MTR in the right uncinate fasciculus was only in the order of 1%, we note that it is a robust and statistically highly significant finding because increased MTR values were consistently found in schizophrenia along large parts of the tract. Although small, these differences could, for instance, have large consequences for the synchronization of the signal because small alterations of signal transport along large parts of the fiber may cumulate into large alterations of various aspects of the signal transport (eg, signaling speed and signal response function).
A limitation of this study is that the applied fiber-tracking algorithm requires sufficient directional information to successfully reconstruct the fibers. If, at a certain point, this information is not available (for instance, due to crossings with other fibers), then the algorithm cannot reconstruct the complete fiber tract. Another limitation is that like DTI, MTR is an indirect measure of white matter microstructure. Therefore one should interpret group differences between FA or MTR values with caution as both FA and MTR are indirect measures and other factors then fiber orientation or macromolecule content may alter FA or MTR values as well.57
In conclusion, a subtle but significant increase in mean MTR was found along large parts of the right uncinate fasciculus of schizophrenia patients. This increase appears to be specific for the right uncinate fasciculus and points toward increased connectivity between the medial frontal cortex and temporal pole provided that increases in myelin fully account for the increases found in mean MTR. Possibly, the right uncinate fasciculus may be part of a compensation mechanism for aberrant functioning of the left uncinate fasciculus, as suggested by the decreased FA in the older patients with schizophrenia. However, other mechanisms such as prolonged T1 relaxation times may also be implicated.
Funding
Dutch Organization for Medical Research NWO ZON-MW VIDI Program (917.46.370 to H.E.H.)
Acknowledgments
Financial disclosures: The authors do not have any conflicts of interest to disclose.
References
- 1.Wright P, Nimgaonkar VL, Donaldson PT, Murray RM. Schizophrenia and HLA: a review. Schizophr Res. 2001;47:1–12. doi: 10.1016/s0920-9964(00)00022-0. [DOI] [PubMed] [Google Scholar]
- 2.Bleuler E. Dementia Praecox or the Group of Schizophrenias. NewYork, NY: International Universities Press; 1911. [Google Scholar]
- 3.Kraepelin E. Dementia Praecox and Paraphrenia. 8th ed. Edinburgh, UK: Livingstone; 1919. [Google Scholar]
- 4.Davis KL, Stewart DG, Friedman JI, et al. White matter changes in schizophrenia—evidence for myelin-related dysfunction. Arch Gen Psychiatry. 2003;60:443–456. doi: 10.1001/archpsyc.60.5.443. [DOI] [PubMed] [Google Scholar]
- 5.Beaulieu C. The basis of anisotropic water diffusion in the nervous system—a technical review. NMR Biomed. 2002;15:435–455. doi: 10.1002/nbm.782. [DOI] [PubMed] [Google Scholar]
- 6.Kanaan RA, Kim JS, Kaufmann WE, Pearlson GD, Barker GJ, McGuire PK. Diffusion tensor imaging in schizophrenia. Biol Psychiatry. 2005;58:921–929. doi: 10.1016/j.biopsych.2005.05.015. [DOI] [PubMed] [Google Scholar]
- 7.Kubicki M, McCarley R, Westin CF, et al. A review of diffusion tensor imaging studies in schizophrenia. J Psychiatr Res. 2007;41:15–30. doi: 10.1016/j.jpsychires.2005.05.005. [DOI] [PMC free article] [PubMed] [Google Scholar]
- 8.Konrad A, Winterer G. Disturbed structural connectivity in schizophrenia—primary factor in pathology or epiphenomenon? Schizophr Bull. 2008;34:72–92. doi: 10.1093/schbul/sbm034. [DOI] [PMC free article] [PubMed] [Google Scholar]
- 9.Mori S, van Zijl PC. Fiber tracking: principles and strategies—a technical review. NMR Biomed. 2002;15:468–480. doi: 10.1002/nbm.781. [DOI] [PubMed] [Google Scholar]
- 10.Jones DK. Studying connections in the living human brain with diffusion MRI. Cortex. 2008;44(8):936–952. doi: 10.1016/j.cortex.2008.05.002. [DOI] [PubMed] [Google Scholar]
- 11.van den Heuvel MP, Mandl RCW, Luigjes J, Hulshoff Pol HE. Microstructural organization of the cingulum tract and the level of default mode functional connectivity. J Neurosci. 2008;28(43):10844–10851. doi: 10.1523/JNEUROSCI.2964-08.2008. [DOI] [PMC free article] [PubMed] [Google Scholar]
- 12.Jones DK, Catani M, Pierpaoli C, et al. A diffusion tensor magnetic resonance imaging study of frontal cortex connections in very-late-onset schizophrenia-like psychosis. Am J Geriatr Psychiatry. 2005;13:1092–1099. doi: 10.1176/appi.ajgp.13.12.1092. [DOI] [PubMed] [Google Scholar]
- 13.Kanaan RA, Shergill SS, Barker GJ, et al. Tract-specific anisotropy measurements in diffusion tensor imaging. Psychiatry Res. 2006;146:73–82. doi: 10.1016/j.pscychresns.2005.11.002. [DOI] [PubMed] [Google Scholar]
- 14.Jones DK, Catani M, Pierpaoli C, et al. Age effects on diffusion tensor magnetic resonance imaging tractography measures of frontal cortex connections in schizophrenia. Hum Brain Mapp. 2006;27:230–238. doi: 10.1002/hbm.20179. [DOI] [PMC free article] [PubMed] [Google Scholar]
- 15.Mori T, Ohnishi T, Hashimoto R, et al. Progressive changes of white matter integrity in schizophrenia revealed by diffusion tensor imaging. Psychiatry Res. 2007;154:133–145. doi: 10.1016/j.pscychresns.2006.09.004. [DOI] [PubMed] [Google Scholar]
- 16.Rosenberger G, Kubicki M, Nestor PG, et al. Age-related deficits in fronto-temporal connections in schizophrenia: a diffusion tensor imaging study. Schizophr Res. 2008;102(1–3):181–188. doi: 10.1016/j.schres.2008.04.019. [DOI] [PMC free article] [PubMed] [Google Scholar]
- 17.Friedman JI, Tang C, Carpenter D, et al. Diffusion tensor imaging findings in first-episode and chronic schizophrenia patients. Am J Psychiatry. 2008;165(8):1024–1032. doi: 10.1176/appi.ajp.2008.07101640. [DOI] [PubMed] [Google Scholar]
- 18.van Buchem MA, McGowan JC, Grossman RI. Magnetization transfer histogram methodology: its clinical and neuropsychological correlates. Neurology. 1999;53(suppl 3):S23–S28. [PubMed] [Google Scholar]
- 19.Wolff SD, Balaban RS. Magnetization transfer imaging: practical aspects and clinical applications. Radiology. 1994;192:593–599. doi: 10.1148/radiology.192.3.8058919. [DOI] [PubMed] [Google Scholar]
- 20.Barkovich AJ. Concepts of myelin and myelination in neuroradiology. Am J Neuroradiol. 2000;21:1099–1109. [PMC free article] [PubMed] [Google Scholar]
- 21.Henkelman RM, Stanisz GJ, Graham SJ. Magnetization transfer in MRI: a review. NMR Biomed. 2001;14:57–64. doi: 10.1002/nbm.683. [DOI] [PubMed] [Google Scholar]
- 22.Foong J, Maier M, Barker GJ, Brocklehurst S, Miller DH, Ron MA. In vivo investigation of white matter pathology in schizophrenia with magnetisation transfer imaging. J Neurol Neurosurg Psychiatry. 2000;68:70–74. doi: 10.1136/jnnp.68.1.70. [DOI] [PMC free article] [PubMed] [Google Scholar]
- 23.Foong J, Maier M, Clark CA, Barker GJ, Miller DH, Ron MA. Neuropathological abnormalities of the corpus callosum in schizophrenia: a diffusion tensor imaging study. J Neurol Neurosurg Psychiatry. 2000;68:242–244. doi: 10.1136/jnnp.68.2.242. [DOI] [PMC free article] [PubMed] [Google Scholar]
- 24.Bagary MS, Symms MR, Barker GJ, Mutsatsa SH, Joyce EM, Ron MA. Gray and white matter brain abnormalities in first-episode schizophrenia inferred from magnetization transfer imaging. Arch Gen Psychiatry. 2003;60:779–788. doi: 10.1001/archpsyc.60.8.779. [DOI] [PubMed] [Google Scholar]
- 25.Antosik-Biernacka A, Peuskens H, De Hert M, et al. Magnetization transfer imaging in chronic schizophrenia. Med Sci Monit. 2006;12:MT17–MT21. [PubMed] [Google Scholar]
- 26.Kubicki M, Park H, Westin CF, et al. DTI and MTR abnormalities in schizophrenia: analysis of white matter integrity. Neuroimage. 2005;26:1109–1118. doi: 10.1016/j.neuroimage.2005.03.026. [DOI] [PMC free article] [PubMed] [Google Scholar]
- 27.Gerig G, Gouttard S, Corouge I. Analysis of brain white matter via fiber tract modeling. Conf Proc IEEE Eng Med Biol Soc. 2004;6:4421–4424. doi: 10.1109/IEMBS.2004.1404229. [DOI] [PubMed] [Google Scholar]
- 28.Wright IC, Rabe-Hesketh S, Woodruff PW, David AS, Murray RM, Bullmore ET. Meta-analysis of regional brain volumes in schizophrenia. Am J Psychiatry. 2000;157:16–25. doi: 10.1176/ajp.157.1.16. [DOI] [PubMed] [Google Scholar]
- 29.Hulshoff Pol HE, Schnack HG, Mandl RC, et al. Focal gray matter density changes in schizophrenia. Arch Gen Psychiatry. 2001;58:1118–1125. doi: 10.1001/archpsyc.58.12.1118. [DOI] [PubMed] [Google Scholar]
- 30.Honea R, Crow TJ, Passingham D, Mackay CE. Regional deficits in brain volume in schizophrenia: a meta-analysis of voxel-based morphometry studies. Am J Psychiatry. 2005;162:2233–2245. doi: 10.1176/appi.ajp.162.12.2233. [DOI] [PubMed] [Google Scholar]
- 31.Andersson JL, Skare S. A model-based method for retrospective correction of geometric distortions in diffusion-weighted EPI. Neuroimage. 2002;16:177–199. doi: 10.1006/nimg.2001.1039. [DOI] [PubMed] [Google Scholar]
- 32.Chang LC, Jones DK, Pierpaoli C. RESTORE: robust estimation of tensors by outlier rejection. Magn Reson Med. 2005;53:1088–1095. doi: 10.1002/mrm.20426. [DOI] [PubMed] [Google Scholar]
- 33.Basser PJ, Pierpaoli C. Microstructural and physiological features of tissues elucidated by quantitative-diffusion-tensor MRI. J Magn Reson B. 1996;111:209–219. doi: 10.1006/jmrb.1996.0086. [DOI] [PubMed] [Google Scholar]
- 34.Collins DL, Holmes CJ, Peters TM, Evans AC. Automatic 3-D model-based neuroanatomical segmentation. Hum Brain Mapp. 1995;3:190–208. [Google Scholar]
- 35.Hulshoff Pol HE, Schnack HG, Mandl RC, et al. Focal white matter density changes in schizophrenia: reduced inter-hemispheric connectivity. Neuroimage. 2004;21:27–35. doi: 10.1016/j.neuroimage.2003.09.026. [DOI] [PubMed] [Google Scholar]
- 36.Wakana S, Jiang HY, Nagae-Poetscher LM, van Zijl PCM, Mori S. Fiber tract-based atlas of human white matter anatomy. Radiology. 2004;230:77–87. doi: 10.1148/radiol.2301021640. [DOI] [PubMed] [Google Scholar]
- 37.Mori S, Crain BJ, Chacko VP, van Zijl PC. Three-dimensional tracking of axonal projections in the brain by magnetic resonance imaging. Ann Neurol. 1999;45:265–269. doi: 10.1002/1531-8249(199902)45:2<265::aid-ana21>3.0.co;2-3. [DOI] [PubMed] [Google Scholar]
- 38.Gulani V, Webb AG, Duncan ID, Lauterbur PC. Apparent diffusion tensor measurements in myelin-deficient rat spinal cords. Magn Reson Med. 2001;45:191–195. doi: 10.1002/1522-2594(200102)45:2<191::aid-mrm1025>3.0.co;2-9. [DOI] [PubMed] [Google Scholar]
- 39.Kubicki M, Westin CF, Maier SE, et al. Uncinate fasciculus findings in schizophrenia: a magnetic resonance diffusion tensor imaging study. Am J Psychiatry. 2002;159:813–820. doi: 10.1176/appi.ajp.159.5.813. [DOI] [PMC free article] [PubMed] [Google Scholar]
- 40.Madler B, Drabycz SA, Kolind SH, Whittall KP, Mackay AL. Is diffusion anisotropy an accurate monitor of myelination? Correlation of multicomponent T(2) relaxation and diffusion tensor anisotropy in human brain. Magn Reson Imaging. 2008;26(7):874–888. doi: 10.1016/j.mri.2008.01.047. [DOI] [PubMed] [Google Scholar]
- 41.Bozzali M, Wrabetz L. Axonal signals and oligodendrocyte differentiation. Neurochem Res. 2004;29:979–988. doi: 10.1023/b:nere.0000021242.12455.75. [DOI] [PubMed] [Google Scholar]
- 42.Innocenti GM, Ansermet F, Parnas J. Schizophrenia, neurodevelopment and corpus callosum. Mol Psychiatry. 2003;8:261–274. doi: 10.1038/sj.mp.4001205. [DOI] [PubMed] [Google Scholar]
- 43.Kircher TT, Liddle PF, Brammer MJ, Williams SC, Murray RM, McGuire PK. Reversed lateralization of temporal activation during speech production in thought disordered patients with schizophrenia. Psychol Med. 2002;32:439–449. doi: 10.1017/s0033291702005287. [DOI] [PubMed] [Google Scholar]
- 44.Sommer IE, Ramsey NF, Mandl RC, Kahn RS. Language lateralization in female patients with schizophrenia: an fMRI study. Schizophr Res. 2003;60:183–190. doi: 10.1016/s0920-9964(02)00300-6. [DOI] [PubMed] [Google Scholar]
- 45.Sommer IE, Ramsey NF, Mandl RC, van Oel CJ, Kahn RS. Language activation in monozygotic twins discordant for schizophrenia. Br J Psychiatry. 2004;184:128–135. doi: 10.1192/bjp.184.2.128. [DOI] [PubMed] [Google Scholar]
- 46.Weiss EM, Hofer A, Golaszewski S, Siedentopf C, Felber S, Fleischhacker WW. Language lateralization in unmedicated patients during an acute episode of schizophrenia: a functional MRI study. Psychiatry Res. 2006;146:185–190. doi: 10.1016/j.pscychresns.2005.11.003. [DOI] [PubMed] [Google Scholar]
- 47.Laughlin SB, Sejnowski TJ. Communication in neuronal networks. Science. 2003;301:1870–1874. doi: 10.1126/science.1089662. [DOI] [PMC free article] [PubMed] [Google Scholar]
- 48.Mcguire PK, Silbersweig DA, Wright I, et al. Abnormal monitoring of inner speech—a physiological-basis for auditory hallucinations. Lancet. 1995;346:596–600. doi: 10.1016/s0140-6736(95)91435-8. [DOI] [PubMed] [Google Scholar]
- 49.Andreasen NC, Ehrhardt JC, Swayze VW, II, et al. T1 and T2 relaxation times in schizophrenia as measured with magnetic resonance imaging. Schizophr Res. 1991;5:223–232. doi: 10.1016/0920-9964(91)90080-b. [DOI] [PubMed] [Google Scholar]
- 50.Coles JA, Deitmer JW. Extracellular potassium and pH: homeostasis and signaling. In: Kettenmann H, Ransom BR, editors. Neuroglia. Oxford, UK: Oxford University Press; 2005. pp. 334–345. [Google Scholar]
- 51.Kukley M, Capetillo-Zarate E, Dietrich D. Vesicular glutamate release from axons in white matter. Nat Neurosci. 2007;10:311–320. doi: 10.1038/nn1850. [DOI] [PubMed] [Google Scholar]
- 52.Rovira A, Grive E, Pedraza S, Rovira A, Alonso J. Magnetization transfer ratio values and proton MR spectroscopy of normal-appearing cerebral white matter in patients with liver cirrhosis. Am J Neuroradiol. 2001;22:1137–1142. [PMC free article] [PubMed] [Google Scholar]
- 53.Miese F, Kircheis G, Wittsack HJ, et al. 1H-MR spectroscopy, magnetization transfer, and diffusion-weighted imaging in alcoholic and nonalcoholic patients with cirrhosis with hepatic encephalopathy. Am J Neuroradiol. 2006;27:1019–1026. [PMC free article] [PubMed] [Google Scholar]
- 54.Wyckoff N, Kumar A, Gupta RC, Alger J, Hwang S, Thomas MA. Magnetization transfer imaging and magnetic resonance spectroscopy of normal-appearing white matter in late-life major depression. J Magn Reson Imaging. 2003;18:537–543. doi: 10.1002/jmri.10400. [DOI] [PubMed] [Google Scholar]
- 55.Price G, Cercignani M, Parker GJ, et al. Abnormal brain connectivity in first-episode psychosis: a diffusion MRI tractography study of the corpus callosum. Neuroimage. 2007;35:458–466. doi: 10.1016/j.neuroimage.2006.12.019. [DOI] [PMC free article] [PubMed] [Google Scholar]
- 56.Kubicki M, Styner M, Bouix S, et al. Reduced interhemispheric connectivity in schizophrenia-tractography based segmentation of the corpus callosum. Schizophr Res. 2008 doi: 10.1016/j.schres.2008.08.027. [Published online ahead of print September 29, 2008]. Schizophr Res. doi: 10.1016/j.schres.2008.08.027. [DOI] [PMC free article] [PubMed] [Google Scholar]
- 57.Laule C, Vavasour IM, Kolind SH, et al. Magnetic resonance imaging of myelin. Neurotherapeutics. 2007;4:460–484. doi: 10.1016/j.nurt.2007.05.004. [DOI] [PMC free article] [PubMed] [Google Scholar]