Abstract
OBJECTIVE: To explore the covariate-adjusted associations between body composition (percent body fat and lean body mass) and prognostic factors for mortality in patients with chronic heart failure (CHF) (nutritional status, N-terminal pro-B-type natriuretic peptide [NT-proBNP], quality of life, exercise capacity, and C-reactive protein).
PATIENTS AND METHODS: Between June 2008 and July 2009, we directly measured body composition using dual energy x-ray absorptiometry in 140 patients with systolic and/or diastolic heart failure. We compared body composition and CHF prognostic factors across body fat reference ranges and body mass index (BMI) categories. Multiple linear regression models were created to examine the independent associations between body composition and CHF prognostic factors; we contrasted these with models that used BMI.
RESULTS: Use of BMI misclassified body fat status in 51 patients (41%). Body mass index was correlated with both lean body mass (r=0.72) and percent body fat (r=0.67). Lean body mass significantly increased with increasing BMI but not with percent body fat. Body mass index was significantly associated with lower NT-proBNP and lower exercise capacity. In contrast, higher percent body fat was associated with a higher serum prealbumin level, lower exercise capacity, and increased C-reactive protein level; lean body mass was inversely associated with NT-proBNP and positively associated with hand-grip strength.
CONCLUSION: When BMI is divided into fat and lean mass components, a higher lean body mass and/or lower fat mass is independently associated with factors that are prognostically advantageous in CHF. Body mass index may not be a good indicator of adiposity and may in fact be a better surrogate for lean body mass in this population.
When body mass index is divided into fat and lean mass components, a higher lean body mass and/or lower fat mass is independently associated with factors that are prognostically advantageous in chronic heart failure. Body mass index may not be a good indicator of adiposity and may in fact be a better surrogate for lean body mass in patients with chronic heart failure.
6MWD = 6-minute walk distance; BMI = body mass index; CHF = chronic heart failure; CRP = C-reactive protein; DEXA = dual energy x-ray absorptiometry; HRQoL = health-related quality of life; NT-proBNP = N-terminal pro-B-type natriuretic peptide; WHO = World Health Organization
Population-based cohort studies have identified obesity as a major risk factor for the development of chronic heart failure (CHF).1 In contrast, in patients with acute or stable heart failure, a higher body mass index (BMI) is strongly associated with decreased mortality.2,3 These paradoxical observations have been referred to as reverse epidemiology4,5 or the obesity paradox6 and, assuming they are valid, call into question the practice of extrapolating BMI targets derived from the general population to the CHF population.
A number of potential explanations for the obesity paradox have been proposed.6 Because the paradox has been almost exclusively reported in studies that use BMI to classify obesity in CHF (with the exception of one study that used skinfold measurements7) and because BMI is an indirect measure of body fat, the paradox may be an artifactual finding that results from the use of an inaccurate surrogate for obesity. Alternatively, the obesity paradox may represent a valid finding that reflects a greater amount of favorable metabolic reserve or lower levels of circulating N-terminal pro-B-type natriuretic peptide (NT-proBNP) in obese patients compared with their normal-weight counterparts.8
For editorial comment, see page 605
Our objectives were to (1) characterize the body composition of obese, overweight, and normal-weight patients with CHF using dual energy x-ray absorptiometry (DEXA); (2) explore the covariate-adjusted associations between body composition (both body fat and lean body mass) and prognostic factors for mortality in CHF (nutritional status, NT-proBNP, health-related quality of life [HRQoL], 6-minute walk distance [6MWD], and C-reactive protein [CRP]); and (3) compare the results of covariate-adjusted models incorporating body composition with those incorporating BMI to examine differences in their association with CHF prognostic factors.
PATIENTS AND METHODS
Between June 2008 and July 2009, 140 consecutive patients with CHF (systolic and/or diastolic) were recruited from the University of Alberta Heart Function Clinic, Edmonton, Alberta, Canada, a tertiary care clinic staffed by a multidisciplinary team of physicians, specialized nurses, pharmacists, dieticians, and social workers. Patients 18 years or older who were able to give informed consent, who had heart failure diagnosed on the basis of Framingham Heart Study criteria,9 and who were deemed to be clinically euvolemic by the clinic physician were included. Patients who were unable to lay flat or who exceeded the 136 kg (300 lb) weight limit for the DEXA scan were excluded. The University of Alberta Health Research Ethics Board approved the study.
DEXA Scans
Body composition was measured by DEXA performed with a Hologic Series 4500W Fan Beam X-ray Bone Densitometer with version 12.4 software (Hologic Inc, Bedford, MA). Three experienced technicians performed all scans in a standard fashion. Scans were analyzed using the whole-body fan beam method to determine lean mass and fat mass. Quality control tests were run every morning using a standard block of tissue-equivalent material. Patients were asked to refrain from drinking more than 500 mL of fluid an hour before their scan.
Prognostic Factors of Mortality
The following 4 markers were chosen to measure nutritional status: serum albumin, serum prealbumin, hand-grip strength, and the Simplified Nutrition Appetite Questionnaire. Grip strength was measured with a calibrated Jamar Hydraulic Hand Dynamometer (Sammons Preston Roylan, Bolingbrook, IL). The highest result of 2 attempts for the dominant hand was recorded and compared against age- and sex-specific reference ranges10 and then categorized as average, above average, or below average.
Inflammation was measured with high-sensitivity CRP by standard enzyme-linked immunosorbent assay. The NT-proBNP level was measured with the Elecsys Roche assay (Elecsys Roche, Indianapolis, IN) and used to quantify severity of CHF. The 6MWD test was used to measure exercise capacity and was administered according to the American Thoracic Society guidelines.11
The HRQoL was measured using the Kansas City Cardiomyopathy Questionnaire, the EuroQol visual analog scale, and the Center for Epidemiological Studies Depression Short Form Scale. The Kansas City Cardiomyopathy Questionnaire is a 23-item instrument that quantifies physical function, symptoms, social function, self-efficacy and knowledge regarding the disease, and quality of life specific to patients with CHF.12 The overall summary score is calculated as the mean of scores from the 5 domains. A higher score indicates better HRQoL. The EuroQol visual analog scale is a generic measure on which respondents are asked to rate their own health state relative to full health (score of 100) and worst imaginable health (score of 0).13 The Center for Epidemiological Studies Depression Short Form Scale 10 is a 10-item scale, with a higher total score indicating worse depressive symptoms.14
Statistical Analyses
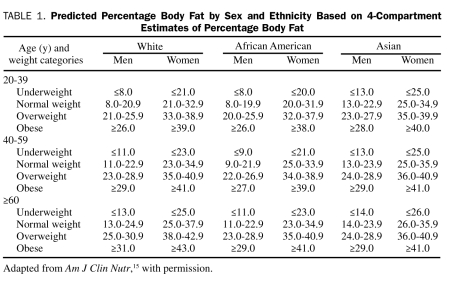
As shown in Table 1, patients were grouped according to DEXA-measured body fat categories (low-normal, overweight, and obese) proposed by Gallagher et al15 as the reference standard. These reference ranges are specific to age, sex, and race. Body fat was also assessed indirectly using the traditional World Health Organization (WHO) BMI categories calculated as weight in kilograms divided by height in meters squared: normal (18.5-24.9), overweight (25.0-29.9), and obese (≥30.0).16 Patients of races other than white, African American, and Asian (n=9) were classified according to the body fat reference table for white populations. Patient characteristics and prognostic factors were compared among the body fat categories using χ2 tests for linear trend for categorical variables or Jonckheere-Terpstra tests for continuous variables to account for the ordered nature of the body fat and BMI categories. We determined the concordance of body fat status classification between the BMI and Gallagher percent body fat categories. We also assessed the relationship between body composition and BMI by calculating the partial Pearson correlation coefficients among BMI, percent body fat, and lean body mass, adjusted for age and sex. Next, separate linear regression models were constructed to determine the independent association between BMI (as a continuous variable) and each CHF prognostic factor. Finally, regression models were rebuilt by removing BMI and inserting percent body fat and absolute lean body mass (in kilograms), with all other predictor variables remaining the same. Because of the skewed nature of the NT-proBNP and CRP distributions, both were transformed using the natural logarithm. Models were built by choosing clinically relevant variables and variables identified from prior published studies. In addition, variables that changed the β-coefficient of the outcome variable by 10% or more (as a measure of confounding) were added. Age and sex were included in all models. Model results are presented as β-coefficients with 95% confidence intervals. P<.05 was considered statistically significant.
TABLE 1.
Predicted Percentage Body Fat by Sex and Ethnicity Based on 4-Compartment Estimates of Percentage Body Fat
Normality of variables was inspected visually by histograms, and homoscedasticity of the variance of errors was checked by visual examination of scatterplots. Multicolinearity was assessed by examining the variance inflation factor of each variable. Analyses were performed using SPSS statistical software, version 16.0 (SPSS Inc, Chicago, IL), and graphs were created with STATA statistical software, version 10.1 (StataCorp, College Station, TX).
RESULTS
Of the 221 consecutive eligible patients approached, 140 consented to participate. Reasons for refusal included lack of time, poor noncardiac health, lack of transportation to attend appointments, and unwillingness to undergo x-ray exposure.
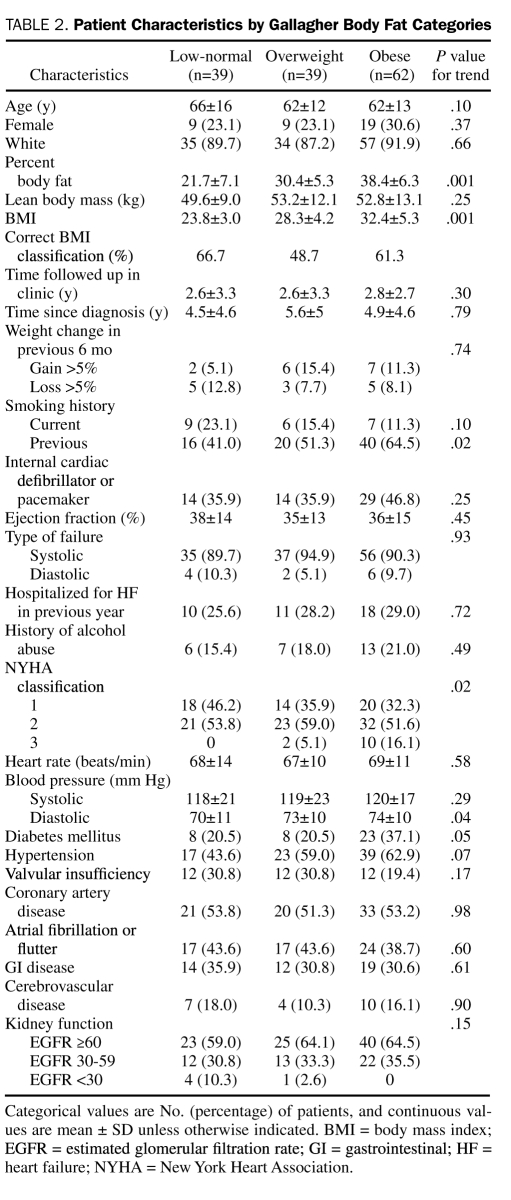
Mean age of the cohort was 63 years, 103 (74%) of the patients were male, and 126 (90%) were white. When categorized according to directly measured body fat, 39, 39, and 62 patients were in the low-normal, overweight, and obese body fat groups, respectively (Table 2). Only 2 patients in the low-normal group were below the normal body fat reference range. Although BMI was moderately positively correlated with percent body fat (r=0.67; P<.001), the WHO BMI classification system concordantly classified only 26 (66.7%), 19 (48.7%), and 38 (61.3%) of the patients in the low-normal, overweight, and obese body fat categories, respectively. Both female patients with directly measured body fat levels below normal were classified as having normal weight by WHO BMI criteria. Body mass index had a slightly higher correlation with lean body mass (r=0.72; P<.001) than with percent body fat.
TABLE 2.
Patient Characteristics by Gallagher Body Fat Categories
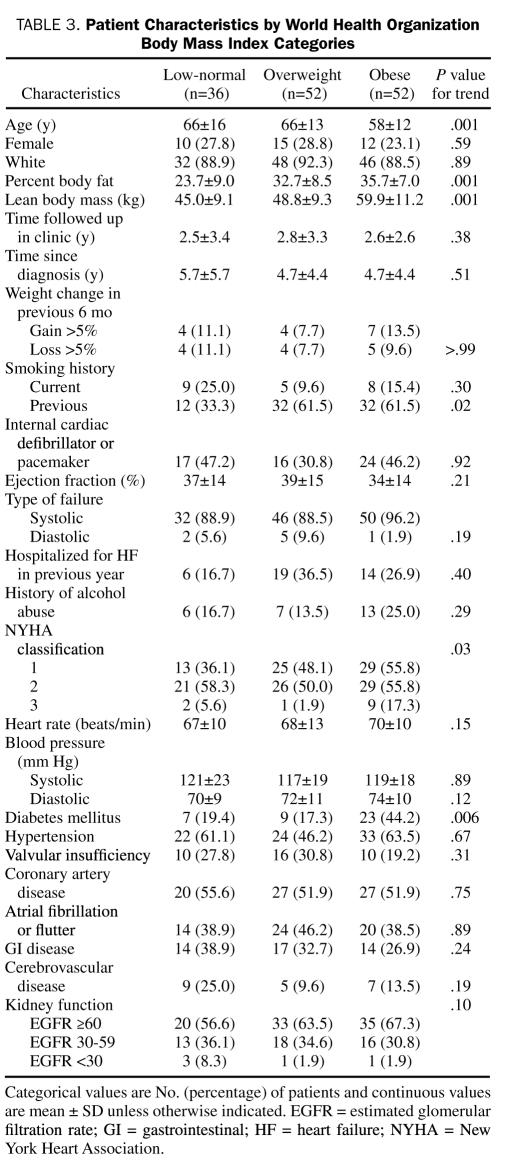
Patient characteristics by WHO BMI categories are listed in Table 3. Although comorbidities and renal function were relatively similar between the Gallagher body fat categories and the WHO BMI categories, patients with a higher percent body fat and a higher BMI reported poorer functional capacity (New York Heart Association classification) and a higher prevalence of previous smoking. Patients with a higher BMI were younger than patients with a lower BMI, but no significant differences in age were found between percent body fat categories. Diuretic use was more prevalent in patients with higher BMI and percent body fat levels; however, other cardiac medication use (cholesterol-lowering agents, angiotensin-converting enzyme inhibitors, β-blockers, acetylsalicylic acid, spironolactone, and digoxin) was similar among the groups (data not shown). Higher percent body fat and BMI were significantly associated with higher fasting glucose, higher triglycerides, and lower high-density lipoprotein levels (data not shown). As expected, percent body fat significantly increased with increasing body fat and BMI categories. However, lean body mass was not significantly different among Gallagher body fat categories and was weakly associated with percent body fat (r=−0.2; P<.06), whereas lean body mass significantly increased with increasing BMI category.
TABLE 3.
Patient Characteristics by World Health Organization Body Mass Index Categories
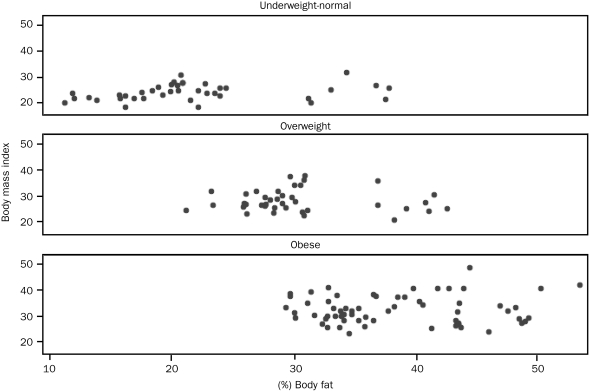
To further examine the misclassification of obesity by BMI, we graphed percent body fat against BMI for each of the 3 Gallagher body fat categories (Figure). The obese and overweight Gallagher categories displayed large variability in BMI, with 2 obese patients being misclassified as having normal weight and 2 patients with normal body fat levels classified as being obese according to BMI. Misclassification was in both directions; 11 patients (28.2%) with normal body fat levels were misclassified as overweight, and 22 patients (35.5%) with high body fat levels (considered obese by Gallagher reference) were misclassified as overweight by BMI.
FIGURE.
Relationship between percent body fat and body mass index stratified by Gallagher body fat category.
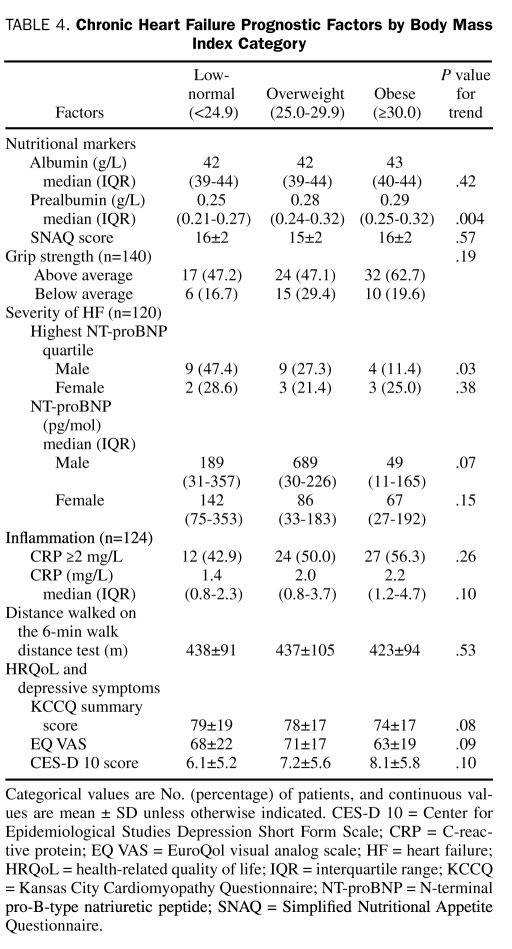
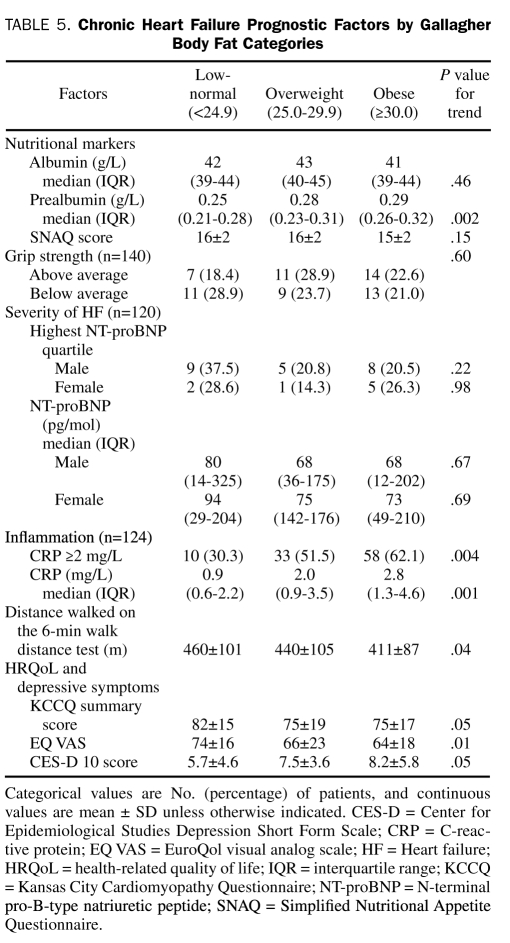
The CHF prognostic factors by BMI and Gallagher body fat categories are presented in Table 4 and Table 5, respectively. Data were missing in 16 patients (11.4%) for CRP and in 20 patients (14.3%) for NT-proBNP measurements. The BMI category was significantly associated with serum prealbumin level and highest NT-proBNP quartile in males. Body fat category was also significantly associated with serum prealbumin level, in addition to a CRP level of 2.0 g/L or higher, 6MWD, depressive symptoms, and general HRQoL and borderline significantly associated with disease-specific HRQoL. Because the WHO has also proposed a definition of obesity as greater than 25% body fat in men and greater than 35% body fat in women,16 we compared the prognostic factors between 2 obese and nonobese categories. According to this definition, 71% of the cohort was obese. Similar to the comparison by Gallagher body fat category, obese patients (>25% in men and >25% in women) had significantly higher prealbumin and CRP levels but lower 6MWD and general HRQoL compared with nonobese patients.
TABLE 4.
Chronic Heart Failure Prognostic Factors by Body Mass Index Category
TABLE 5.
Chronic Heart Failure Prognostic Factors by Gallagher Body Fat Categories
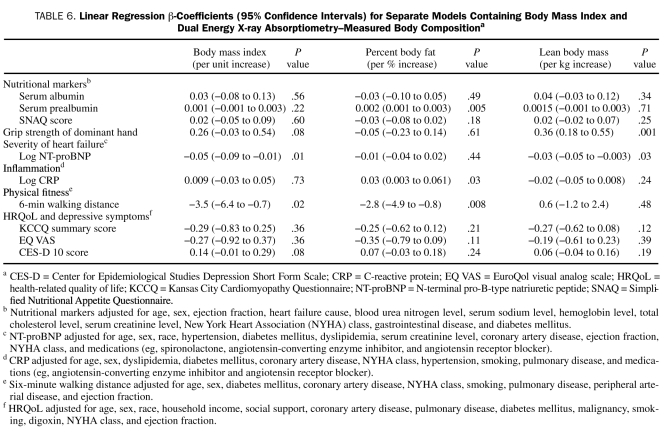
Results of the multiple regression models exploring the associations among BMI, percent body fat, lean body mass, and CHF prognostic factors are shown in Table 6. After covariate adjustment, BMI was significantly inversely associated with NT-proBNP and the 6MWD but not associated with any of the nutritional markers, CRP, or HRQoL. In contrast, body composition as assessed by DEXA correlated with more of the CHF prognostic factors: percent body fat was significantly and positively associated with CRP and serum prealbumin level and inversely associated with 6MWD, whereas lean body mass was significantly inversely associated with NT-proBNP and positively associated with hand-grip strength.
TABLE 6.
Linear Regression β-Coefficients (95% Confidence Intervals) for Separate Models Containing Body Mass Index and Dual Energy X-ray Absorptiometry–Measured Body Compositiona
Although the obesity paradox has been demonstrated in patients with diastolic heart failure and systolic failure,5 we repeated all analyses excluding the 9% of patients with only diastolic dysfunction as a sensitivity analysis. Results were similar when only patients with systolic function were analyzed.
DISCUSSION
In this cross-sectional study, we found that increasing BMI was significantly associated with lower NT-proBNP levels and lower exercise capacity. However, when directly measuring body composition, we found significant associations between increasing body fat and unfavorable changes in prognostic factors, such as higher inflammation and lower exercise capacity, whereas increasing lean mass was associated with favorable changes, such as better hand-grip strength and lower NT-proBNP levels. To our knowledge, this is the first study that examines the associations between body composition and several prognostic factors of mortality in CHF.
We also demonstrate that the WHO BMI categories misclassified 41% of the patients into the wrong Gallagher body fat categories. Body mass index is considered a surrogate for obesity; however, it does not discriminate between fat and lean mass.17 In fact, BMI had a slightly higher correlation to lean body mass compared to percent body fat in our study. In addition, although lean body mass is positively associated with BMI, there is no relationship between lean body mass and percent body fat, which explains the observation that lean body mass increases with increasing BMI category but not with increasing Gallagher body fat category, making BMI an imprecise estimate of risk in patients with CHF. If a high BMI is being used as a surrogate for adiposity, one must be aware that it is reflecting an increase in body mass, but not necessarily an increase in body fat, and that this may lead to incorrect assumptions about any purported relationship between obesity and a given outcome in CHF.
Obesity as indexed by BMI was associated with a reduced exercise capacity measured by 6MWD, which is consistent with previous findings in studies of the general population.18 We also confirmed previously reported findings that BMI is not associated with a heightened inflammatory state (higher CRP level) in patients with CHF and extended these observations by demonstrating that directly measured body fat is independently associated with higher CRP levels.19
A high BMI has been associated with lower BNP levels in patients with CHF20; however, as has been demonstrated in the general population,8 the inverse association between BMI and NT-proBNP may actually reflect an inverse relationship between lean tissue and NT-proBNP, not between body fat and NT-proBNP.
Similar to a previous study in CHF,21 we found that BMI was not associated with serum albumin levels. Percent body fat was positively and independently associated with serum prealbumin but not albumin levels. Prealbumin is more sensitive to recent changes in protein-energy status than albumin, and its concentration reflects recent dietary intake rather than overall nutritional status.22 Thus, a low prealbumin concentration can be regarded as a marker identifying a patient at risk of developing malnutrition rather than a patient who is already malnourished.23 Although higher prealbumin levels in obese patients may indicate greater nutritional reserve, it is also possible that obese patients with CHF have a higher caloric intake,24,25 which leads to a relative increase in serum prealbumin levels but not albumin levels compared with normal-weight patients.
Lean body mass, BMI, and percent body fat were not independently associated with HRQoL or depressive symptoms after adjustment of clinical, psychosocial, and socioeconomic characteristics. Our results differ from a previous study26 that found that CHF patients with a BMI of 30 or higher had worse HRQoL compared with nonobese patients.
Collectively, these observations indicate that, when BMI is divided into fat and lean mass components, a higher lean body mass and/or a lower fat mass is independently associated with factors that are prognostically advantageous in CHF. The single previous observational study7 in patients with CHF that examined body fat (measured by skinfold thickness) and adverse cardiovascular events found that a higher percent body fat was independently associated with a lower composite outcome of cardiovascular death and urgent cardiac transplant. However, the investigators could not accurately measure or adjust for lean body mass. A higher reserve of adipose tissue may have independent protective effects against mortality in the CHF population; however, further well-powered prospective studies examining the relationship of direct measures of adiposity and lean body mass to survival in CHF are needed to determine this. Our results suggest that differentiating between body fat and lean body mass may explain some of the apparently paradoxical associations between BMI and prognosis in heart failure and are supported by a recent cohort study of patients undergoing maintenance hemodialysis (another population exhibiting the obesity paradox), which demonstrated the highest survival rates in patients with greater muscle mass.27
Several limitations of our study should be noted. First, the cross-sectional design provides associative, not causal, evidence. Second, there is no current consensus on established healthy body fat ranges. The Gallagher body fat categories were developed on the basis of age, sex, and race and also on the WHO BMI cutoffs. However, the reference ranges by Gallagher et al15 are widely cited and have been cross-validated by others.28 In addition, we used percent body fat as a continuous variable in our adjusted analysis instead of as a categorical variable. Third, the number of patients in each body fat or BMI category was relatively small, and comparisons may have been underpowered. Fourth, hand-grip strength as a marker of nutritional status has not been validated in the CHF population. However, it has been validated in the hemodialysis29,30 and elderly populations,31,32 2 other populations that exhibit the obesity paradox. Fifth, we used surrogates of mortality in CHF but did not directly assess survival in this study. Whether body fat and/or lean body mass is predictive of mortality and/or hospitalization remains to be examined. Finally, DEXA measurement of lean body mass cannot distinguish between body water and muscle mass. However, ingestion of small fluid volumes (<500 mL) 1 hour before DEXA scanning does not bias the estimates of body composition,33 and patients were enrolled and tested only after they were found to be clinically euvolemic. In addition, if we were overestimating lean body mass in fluid overloaded patients, then any bias should have been operant in the opposite direction to our findings.
CONCLUSION
In this study of patients with CHF in whom body composition was directly measured, using BMI as the measure of body fat lead to misclassification of 41% of patients with CHF. Directly measured body composition was also found to be more closely linked to indicators of prognosis in patients with CHF than BMI. Significant associations were found between increasing body fat and unfavorable changes in certain important CHF prognostic factors, whereas increasing lean body mass was associated with favorable changes in other important factors. Given that BMI was similarly correlated to lean body mass and percent body fat in patients with CHF, as well as the lack of relationship between lean body mass and percent body fat, BMI may not be a good indicator of adiposity and may in fact be a better surrogate for lean body mass in this population. Using BMI as a proxy for adiposity may lead to incorrect assumptions about the relationship between obesity and outcomes in CHF, and division of this surrogate marker into lean and fat components may be a more precise estimate of risk in this population. Prospective studies with direct measures of body composition should be performed in patients with CHF to better characterize the relationship between adiposity and subsequent morbidity and mortality.
Acknowledgments
We sincerely thank the study participants, the University of Alberta Heart Function Clinic staff for their support of this study, and Mark Little, Melissa Stafford, Aga Andrzejewska, and Kinga Walter for their assistance with the DEXA scans.
Footnotes
This study was funded by the University of Alberta Hospital Foundation.
This study was presented at Cardiac Sciences Research Day; June 11, 2010; Edmonton, Alberta, Canada.
REFERENCES
- 1.Kenchaiah S, Evans J, Levy D, et al. Obesity and the risk of heart failure. N Engl J Med. 2002;347(5):305-313 [DOI] [PubMed] [Google Scholar]
- 2.Fonarow GC, Srikanthan P, Costanzo MR, Cintron GB, Lopatin M, ADHERE Scientific Advisory Committee and Investigators An obesity paradox in acute heart failure: analysis of body mass index and inhospital mortality for 108 927 patients in the Acute Decompensated Heart Failure National Registry. Am Heart J. 2007;153(1):74-81 [DOI] [PubMed] [Google Scholar]
- 3.Oreopoulos A, Padwal R, Kalantar-Zadeh K, Fonarow G, McAlister F. Body mass index and mortality in heart failure: a meta-analysis. Am Heart J. 2008;156(1):13-22 [DOI] [PubMed] [Google Scholar]
- 4.Kalantar-Zadeh K, Kilpatrick RD, Kuwae N, Wu DY. Reverse epidemiology: a spurious hypothesis or a hardcore reality? Blood Purif. 2005;23(1):57-63 [DOI] [PubMed] [Google Scholar]
- 5.Güder G, Frantz S, Bauersachs J, et al. Reverse epidemiology in systolic and nonsystolic heart failure: cumulative prognostic benefit of classical cardiovascular risk factors. Circ Heart Fail 2009;2(6):563-571 [DOI] [PubMed] [Google Scholar]
- 6.Kalantar-Zadeh K, Block G, Horwich T, Fonarow GC. Reverse epidemiology of conventional cardiovascular risk factors in patients with chronic heart failure. J Am Coll Cardiol. 2004;43(8):1439-1444 [DOI] [PubMed] [Google Scholar]
- 7.Lavie CJ, Osman AF, Milani RV, Mehra MR. Body composition and prognosis in chronic systolic heart failure: the obesity paradox. Am J Cardiol. 2003;91(7): 891-894 [DOI] [PubMed] [Google Scholar]
- 8.Das SR, Drazner MH, Dries DL, et al. Impact of body mass and body composition on circulating levels of natriuretic peptides: results from the Dallas Heart Study. Circulation 2005;112(14):2163-2168 [DOI] [PubMed] [Google Scholar]
- 9.McKee PA, Castelli WP, McNamara PM, Kannel WB. The natural history of congestive heart failure: the Framingham study. N Engl J Med. 1971;285(26):1441-1446 [DOI] [PubMed] [Google Scholar]
- 10.Bohannon RW, Peolsson A, Massy-Westropp N, Desrosiers J, Bear-Lehman J. Reference values for adult grip strength measured with a Jamar dynamometer: a descriptive meta-analysis. Physiotherapy 2006;92(1):11-15 [Google Scholar]
- 11.ATS Committee on Proficiency Standards for Clinical Pulmonary Function Laboratories ATS statement: guidelines for the six-minute walk test. Am J Respir Crit Care Med. 2002;166(1):111-117 [DOI] [PubMed] [Google Scholar]
- 12.Green CP, Porter CB, Bresnahan DR, Spertus JA. Development and evaluation of the Kansas City Cardiomyopathy Questionnaire: a new health status measure for heart failure. J Am Coll Cardiol. 2000;35(5):1245-1255 [DOI] [PubMed] [Google Scholar]
- 13.Calvert MJ, Freemantle N, Cleland JG. The impact of chronic heart failure on health-related quality of life data acquired in the baseline phase of the CARE-HF study. Eur J Heart Fail 2005;7(2):243-251 [DOI] [PubMed] [Google Scholar]
- 14.Radloff LS. The CES-D Scale: a self-report depression scale for research in the general population. Appl Psychol Meas 1977;1(3):395-401 [Google Scholar]
- 15.Gallagher D, Heymsfield SB, Heo M, Jebb SA, Murgatroyd PR, Sakamoto Y. Healthy percentage body fat ranges: an approach for developing guidelines based on body mass index. Am J Clin Nutr. 2000;72(3):694-701 [DOI] [PubMed] [Google Scholar]
- 16.World Health Organization Physical status: the use and interpretation of anthropometry: report of a WHO Expert Committee: Technical Report Series, No 854 World Health Organization 1995;854:1-452 [PubMed] [Google Scholar]
- 17.Romero-Corral A, Somers VK, Sierra-Johnson J, et al. Accuracy of body mass index in diagnosing obesity in the adult general population. Int J Obes (Lond) 2008;32(6):959-966 [DOI] [PMC free article] [PubMed] [Google Scholar]
- 18.DiPietro L. Physical activity, body weight, and adiposity: an epidemiologic perspective. Exerc Sport Sci Rev. 1995;23(1):275-303 [PubMed] [Google Scholar]
- 19.Horwich TB, Kalantar-Zadeh KK, Fonarow GC. Low serum albumin levels are strongly associated with inflammation but not with body mass index in advanced heart failure patients. J Card Fail 2007;13(6 suppl 2):S102 [Google Scholar]
- 20.Mehra M, Uber PA, Park MH, Scott RL, Ventura HO, Harris BC, Frohlich ED. Obesity and suppressed B-type natriuretic peptide levels in heart failure. J Am Coll Cardiol. 2004;43(9):1590-1595 [DOI] [PubMed] [Google Scholar]
- 21.Horwich TB, Kalantar-Zadeh K, MacLellan RW, Fonarow GC. Albumin levels predict survival in patients with systolic heart failure. Am Heart J. 2008;155(5):883-889 [DOI] [PubMed] [Google Scholar]
- 22.Ingenbleek Y, Young V. Significance of prealbumin in protein metabolism. Clin Chem Lab Med. 2002;40(12):1281-1291 [DOI] [PubMed] [Google Scholar]
- 23.Shenkin A. Serum prealbumin: Is it a marker of nutritional status or of risk of malnutrition? Clin Chem 2006;52(12):2177-2179 [DOI] [PubMed] [Google Scholar]
- 24.Bergstrom J, Furst P, Alvestrand A, Lindholm B. Protein and energy intake, nitrogen balance and nitrogen losses in patients treated with continuous ambulatory peritoneal dialysis. Kidney Int. 1993;44(5):1048-1057 [DOI] [PubMed] [Google Scholar]
- 25.Delarue J, Maingourd C, Objois M, et al. Effects of an amino acid dialysate on leucine metabolism in continuous ambulatory peritoneal dialysis patients. Kidney Int. 1999;56(5):1934-1943 [DOI] [PubMed] [Google Scholar]
- 26.Evangelista LS, Moser DK, Westlake C, Hamilton MA, Fonarow GC, Dracup K. Impact of obesity on quality of life and depression in patients with heart failure. Eur J Heart Fail 2006;8(7):750-755 [DOI] [PMC free article] [PubMed] [Google Scholar]
- 27.Beddhu S, Pappas LM, Ramkumar N, Samore M. Effects of body size and body composition on survival in hemodialysis patients. J Am Soc Nephrol. 2003;14(9):2366-2372 [DOI] [PubMed] [Google Scholar]
- 28.Jackson AS, Stanforth PR, Gagnon J, et al. The effect of sex, age and race on estimating percentage body fat from body mass index: the Heritage Family Study. Int J Obes Relat Metab Disord. 2002;26(6):789-796 [DOI] [PubMed] [Google Scholar]
- 29.Heimburger O, Qureshi A, Blaner W, Berglund L, Stenvinkel P. Handgrip muscle strength, lean body mass, and plasma proteins as markers of nutritional status in patients with chronic renal failure close to start of dialysis therapy. Am J Kidney Dis. 2000;36(6):1213-1225 [DOI] [PubMed] [Google Scholar]
- 30.Wang A, Sea M, Ho Z, Lui S, Li P, Woo J. Evaluation of handgrip strength as a nutritional marker and prognostic indicator in peritoneal dialysis patients. Am J Clin Nutr. 2005;81(1):79-86 [DOI] [PubMed] [Google Scholar]
- 31.Rantanen T, Volpato S, Ferrucci L, Heikkinen E, Fried LP, Guralnik JM. Handgrip strength and cause-specific and total mortality in older disabled women: exploring the mechanism. J Am Geriatr Soc. 2003;51(5):636-641 [DOI] [PubMed] [Google Scholar]
- 32.Al Snih S, Markides KS, Ray L, Ostir GV, Goodwin JS. Handgrip strength and mortality in older Mexican Americans. J Am Geriatr Soc. 2002;50(7):1250-1256 [DOI] [PubMed] [Google Scholar]
- 33.Heiss CJ, Naylor J, Bronco KM, Myers BJ. A small food or fluid load has no effect on body composition measured by 3 different methods. Topics Clin Nutr. 2008;23(3):229-233 [Google Scholar]


