

Abstract
It has been increasing rapidly interest in understanding genetic effects on brain structure and function in recent years. In this study, we examined the genetic and environmental influences on the variation in cortical thickness and specific tissue volumes in a large cohort of 8-year-old healthy twins. The present study can provide a better estimation of the genetic and environmental effects by virtue of the homogeneously-aged pediatric twin pairs with a similar growing environment. We found that common environmental factors contributed significantly to the variations of the right lateral ventricle (36%) and corpus callosum (36%) volumes while genetic factors accounted for most of the phenotypic variance in other brain tissue volumes. In the case of cortical thickness, several regions in the left hemisphere showed statistically significant additive genetic factors, including the middle and inferior frontal gyri, lateral fronto-orbital and occipitotemporal gyri, pars opercularis, planum temporale, precentral and parahippocampal gyri, and the medial region of the primary somatosensory cortex. Relatively high common environmental influence (> 50%) was observed in the right anterior cingulate cortex and insula. Our findings indicate that the genetic and common environmental influences on individual human brain structural differences are lateralized, with the language-dominant left cerebral cortex under stronger genetic control than the right.
Keywords: Magnetic Resonance Imaging, Pediatric Twin, Cortical Thickness, Genetic Effect, Structural Equation Modeling
Introduction
Twin studies have been an important tool for distinguishing the relative contribution of genetic and environmental influences on the phenotypic variation of human brain morphology (Boomsma D et al., 2002). Genetic influence is typically expressed as a heritability statistic which reflects the proportion of genetic variance over the total one. In contrast, environmental variance can be further decomposed into either shared variance including nutrition, education and experience as a member of family or unique environmental variance including individual differences in a trait and experimental errors such as lack of reproducibility in the test. Classical twin analysis is based on the difference in intra-pair similarity between monozygotic (MZ) twin pairs who are genetically identical, and dizygotic (DZ) twin pairs who share approximately half of their segregating genes. If pairs of MZ twin resemble each other more closely than ones of DZ do for a certain trait, it can be inferred that there must be a significant genetic influence on that trait. In addition to genetic influences, a presence of common environmental factors is suggested when a trait correlation within DZ twins is larger than half of that for MZ twins (Boomsma D et al., 2002).
The human brain varies considerably between individuals in terms of the size, shape and structural complexity and many studies have shown that these variations are significantly influenced by genetic factors (for reviews, see Lenroot RK and JN Giedd (2008); Peper JS et al.(2007)). Human brain magnetic resonance imaging (MRI) studies have suggested that total cerebral volume (Baare WF et al., 2001; Geschwind DH et al., 2002; Pennington BF et al., 2000), and individual gray matter (GM) and white matter (WM) volumes (Geschwind DH et al., 2002; Wright IC et al., 2002) are highly heritable. Also, the shape of deep sulci appears to be more genetically determined than that of superficial sulci (Biondi A et al., 1998; Lohmann G et al., 1999). However, ventricular volumes and superficial gyral patterns seem to be almost entirely mediated by environmental factors (Baare WF et al., 2001; Bartley AJ et al., 1997; Wright IC et al., 2002). Though it has been reported that individual lobar brain volumes have lower heritability than the whole brain volume, this might be a consequence of poor reliability in regional partitioning rather than any substantial difference in heritability for these regions (Geschwind DH et al., 2002). Advances in brain mapping technology have allowed more detailed maps of genetic influences on structural features of the human cortex, as opposed to gross measures of structure volume. It has been suggested that the cortical GM densities of language-associated areas in the left hemisphere were significantly influenced by genetic factors (Thompson PM et al., 2001). However, statistical comparisons of the heritability among cortical regions have to be interpreted with caution because the main limitation of small sample size is the lack of power to test for the influence of common environment (Peper JS et al., 2007). On the other hand, one recent heritability study of regional cortical thickness with a large population of healthy children and adolescents showed that several brain areas, including the dorsal frontal, temporal and orbitofrontal cortices, superior parietal regions, and inferior surfaces of the temporal lobes, exhibited statistically significant genetic effects (Lenroot RK et al., 2009). In addition, cerebral asymmetry is also found in the human fetus and newborn infant, thus establishing importance of genetic or intrauterine influences in asymmetry (Chi JG et al., 1977; Witelson SF and W Pallie, 1973). Though a variety of studies have demonstrated that handedness having a significant genetic component is clearly related to the cerebral asymmetry, little is known about genetic effects that produce the cerebral asymmetry (Alexander MP and M Annett, 1996; Geschwind N and AM Galaburda, 1985, 1985, 1985; Toga AW and PM Thompson, 2003).
In most previous twin studies, there has been considerable age variability within the cohort. This complicates the interpretation of the findings since the brain undergoes substantial morphological change with age. Moreover, the relative contribution of genetic and environmental influences on the observed phenotypic variation in human brain morphology is also reported to change according to age (Wallace GL et al., 2006). Early developing brain regions such as primary motor and sensory cortices show relatively greater genetic influences in childhood while late developing regions associated with complex cognitive functions including the prefrontal cortex, superior temporal gyri, and superior parietal lobes become more heritable with maturation (Lenroot RK et al., 2009; Plomin R and I Craig, 1997). In particular, the earlier stages of primate brain development must be more mediated by genetic effects, while later stages of brain maturation might result from a more complex interaction of genetic and environmental influences (Gogtay N et al., 2004; Rakic P, 1995; Rubenstein JL and P Rakic, 1999). If the twin cohort has a tightly-constrained age range, it should be possible to disentangle more accurately the genetic and environmental components of phenotypic variance. There are several merits in the heritability study for pediatric twin compared with adult ones despite some methodological concerns over head motion and age-dependent tissue contrast changes. First, there is less opportunity to expose each twin member to a different environment than if the twins have already reached adulthood. The validity of the twin analysis depends on the assumption that both types of twins experience equal childhood and adult environments, i.e., the equal environment assumption (Morris-Yates A et al., 1990). Second, examining the differences in the early stage of brain development must be more important and informative because most neuropsychiatric disorders manifest themselves during childhood or adolescence (Giedd JN et al., 2007). Although there are few pediatric twin studies, all of them have reported that additive genetic effects account for a considerable portion of variability in most brain regions, a finding that is consistent with previous adult studies (Pennington BF et al., 2000; Wallace GL et al., 2006).
The aim of the present study was to examine the heritability of the human brain morphological variations in a cohort of homogeneously-aged (8-year-old) healthy pediatric twins. We measured cross-twin correlations in a set of morphological indices using fully automated 3D segmentation tools for MZ and DZ twins. We then compared these measurements across two groups using structural equation modeling to determine the genetic and environmental effects on the observed variance in brain tissue volumes and cortical thickness. And, in order to compare with previous region-of-interest (ROI) studies, we defined lobar regions on the hemispheric cortical surface and explored the genetic effect on the averaged cortical thickness within each lobe. According to developmental profile, children with age 7 to 9 are developing reading skills, using more complex language and showing greater ability to control movements and to execute more fine-motor tasks (Copple and Bredekamp, 2007). The present study is expected to provide a better estimation of the genetic and environmental influences on phenotypic variance since (i) younger twin pairs have largely shared a common environment, unlike adolescent or adult twins who will have experienced different environments, and (ii) studying a homogeneously-aged cohort will reduce the age confound upon the genetic effect of interest.
Materials and Methods
Subjects
The pediatric subjects in the present study are enrolled in the Quebec Newborn Twin Study (QNTS), an ongoing longitudinal study of twins from the Province of Quebec, Canada, who were recruited at birth between 1 April, 1995 and 31 December, 1998. For same-sex twin pairs, zygosity was reliably assessed with combined use of twins’ medical files and a shortened version of Goldsmith’s Zygosity Questionnaire for Young Twins (Goldsmith HH et al., 1999), as well as DNA tests for 8 to 10 highly polymorphous genetic markers. Zygosity based on the similarity of these genetic markers corresponded at 96% with zygosity based on physical resemblance (Forget-Dubois N et al., 2003).
The demographic characteristics of participants in this study are summarized in Table 1. It has been reported that heritability estimates are not significantly affected by sex (Lenroot RK et al., 2009). Fifty seven MZ (male/female = 22/35) and thirty five DZ (15/20) twin pairs were scanned at 8 years old using the same MRI scanner (total number of subject = 184), who were the third grade in the elementary school. Hand preference was assessed using the Edinburgh Handedness Inventory (Oldfield RC, 1971). 43 MZ pairs were concordant for right handedness (RR), 2 pairs were left-handed (LL) concordant, and 11 pairs were right-left discordant (RL). For the DZ subjects, 19 pairs were RR, 11 pairs were RL, and none were LL concordant. There were 1 MZ and 5 DZ twin pairs without handedness information. All the subjects scanned were within the normal gestational age and birth weight for a twin population, which were not significantly different between groups (Table 1). They underwent physical and psychological screenings to exclude cases of pathology known to affect brain structure. There was no history of significant head injury, a neurological or psychiatric illness, substance abuse or dependence, or first-degree relative with a psychiatric disorder. Cognitive development of participant was assessed using the block-design sub-scale of the Wechsler Preschool and Primary Scale of Intelligence-Revised (WPPSI-R) when they were 60 months old (Wechsler D, 1989). The WPPSI-R is an individually administered, clinical instrument for assessing the cognitive skills of young children and its block design that we used measures nonverbal intelligence, which is highly correlated to verbal IQ. The full scale IQ whose median was centered at 100 with a standard deviation of 15 was estimated while there were several subjects (7 MZ and 11 DZ individuals) whose information were not available. And, socioeconomic status (SES) was computed from data on household income obtained during a home interview, which was converted into 10-point scales (from 1 to 10): from income less than CAD 5,000 to over CAD 80,000. There was not any significant difference in either IQ or SES between MZ and DZ twin pairs (Table 1). Written informed consent was obtained from parents after full explanation of aims and procedures for this study. The study protocol was approved by the scientific and ethics committees of Sainte-Justine and Notre Dame Hospitals in Montreal, Canada.
Table 1.
Demographic characteristics of the twin sample.
| MZ | DZ | |||
|---|---|---|---|---|
| N (boy/girl) | 57 (22/35) | 35 (15/20) | ||
| Age (year) | 8.44 ± 0.20 | 8.47 ± 0.23 | ||
| Birth weight (kg) | 2.42 ± 0.57 | 2.45 ± 0.49 | ||
| Gestational age (month) | 35.74 ± 2.57 | 36.64 ± 2.12 | ||
| IQ | 102.62 ± 14.25 | 101.27 ± 14.40 | ||
| Socioeconomic status | 6.72 ± 2.35 | 6.90 ± 2.30 | ||
| Handedness | 43 (RR) 11 (RL) |
2 (LL) 1 (n/a) |
19 (RR) 11 (RL) |
0 (LL) 5 (n/a) |
N: number of same-sex twin pairs
RR: right-handed concordant; LL: left-handed concordant
RL: right-left discordant; n/a: not applicable
Image Acquisition and Processing
MRI data were obtained on a 1.5 Tesla system (Magnetom Vision, Siemens Electric, Erlangen, Germany). A three-dimensional T1-weighted, sagittal, fast low-angle shot (FLASH) of the whole head, designed to optimally discriminate between brain tissues (TE =10 ms, TR = 22 ms, flip angle = 30°, 160 contiguous slices; matrix size = 224 × 256; 1 × 1 × 1 mm3 voxels) was acquired. To ensure a high quality, all of the raw data underwent a series of visual quality control (QC) that included the level of intensity inhomogeneity within/between slices, the amount of movement artifacts and geometric distortions (Evans AC, 2006). Even though there are more than 600 subjects in the QNTS project, only 92 twin pairs passed MRI QC for both twins of the same sex.
The following pipeline image processing steps were applied for further analysis, as described in detail elsewhere (Collins DL et al., 1994; Evans AC, 2006; Kim JS et al., 2005; MacDonald D et al., 2000; Sled JG et al., 1998; Zijdenbos AP et al., 2002). A pediatric brain template would be more suitable for the morphometric analysis of pediatric brain data than an adult template since a pediatric brain is different from an adult one in size, shape and tissue composition (Hoeksma MR et al., 2005; Wilke M et al., 2003). We developed a pediatric brain template as the standardized space for subsequent procedures, generated from an independent set of pediatric brain data (Yoon U et al., 2009). In order to match the age distribution of subjects in this study, MR images of 53 healthy children ( 23 males, 30 females, 8.97±0.56 years old) from the Pediatric MRI Data Repository created by the NIH MRI Study of Normal Brain Development (Evans et al., 2006) were selected to generate a symmetric iterative group volumetric template (for details, see Yoon U et al. (2009)). At first, the native MRI data of all subjects were registered into the pediatric template using a linear transformation and corrected for intensity non-uniformity artifacts (Sled JG et al., 1998). A hierarchical multi-scale non-linear fitting algorithms (ANIMAL, Collins et al., 1994) was then applied (i) to normalize the individual MR images in stereotaxic space, (ii) to provide a priori information i.e. tissue probability maps for subsequent tissue classification using the neural network classifier (Zijdenbos AP et al., 2002) and (iii) to obtain the 3D deformation vector field that maps the individual brain volume onto the template. An artificial neural network classifier was applied to identify gray matter (GM), white matter (WM) and cerebrospinal fluid (CSF). Partial volume errors, MRI intensity-mixing at the tissue interfaces due to the finite resolution of the imaging device, were estimated and corrected using a trimmed minimum covariance determinant method (Tohka J et al., 2004; Zijdenbos AP et al., 2002). Estimating the fractional amount of each tissue type within each voxel improved the accuracy of cortical surface extraction (Kim JS et al., 2005). Hemispheric cortical surfaces were automatically extracted from each MR volume using the Constrained Laplacian-based Automated Segmentation with Proximities (CLASP) algorithm, which reconstructed the inner cortical surface by deforming a spherical mesh onto the WM/GM boundary and then expanding the deformable model to the GM/CSF boundary (Kim JS et al., 2005; MacDonald D et al., 2000). The accuracy of this technique had been demonstrated in a phantom-based quantitative cross-validation study, showing the best geometric and topologic accuracies and mesh characteristics of the extracted cortical surface (Lee JK et al., 2006).
Measurement of Cortical Thickness
Previous studies have shown that human cortices are not simply scaled versions of one another and the expansion of WM rather than GM would be favored in larger brains (Im K et al., 2008; Luders E et al., 2002). Since cortical surface mesh models for each hemisphere were initially extracted from MRI volumes previously transformed into stereotaxic space, the inverse transformation was then applied to the cortical surfaces so that cortical thickness could be measured in native space. The inner and outer cortical surfaces had the same number of vertices (40962) and cortical thickness was measured by calculating the Euclidean distance between linked vertices on the WM/GM boundary surface and the GM/CSF intersection surface (Kabani N et al., 2001; Lerch JP and AC Evans, 2005; MacDonald D et al., 2000). Although more sophisticated definitions of the inter-surface distance are possible, e.g. based on surface normals or streamlines, previous simulation work by Lerch and Evans (2005) has shown that the simple linked-vertex approach exhibits the lowest error rates. To ensure an optimal correspondence at each vertex of the cortical surface model across individuals, we employed an iterative surface registration algorithm with an unbiased iterative group template showing enhanced anatomic detail (Lyttelton O et al., 2007). Diffusion smoothing, which generalized the Gaussian kernel smoothing, with a 30 mm FWHM (full width half maximum) kernel was used to increase the signal to noise ratio and optimally detect population changes. This kernel size was chosen to maximize the statistical power while minimizing false positives (Lerch JP and AC Evans, 2005). For comparison of our vertex-based genetic analysis with previous ROI-based analyses, we calculated the lobar-averaged cortical thickness of each subject using automatic lobar parcellation (Im K et al., 2008; Yoon U et al., 2007), based on an automated surface registration algorithm and a surface template on which lobar boundaries were defined manually (Lyttelton O et al., 2007; Robbins S et al., 2004). In a previous validation study with 10 randomly-selected left hemispheric GM surfaces, the automatic parcellated lobar area was more than 90% consistent with the manual one using the Kappa similarity index (Im K et al., 2006; Zijdenbos AP and BM Dawant, 1994).
Measurement of Tissue Volume
We also investigated the genetic and environmental contributions to several tissue volumes in native space: whole cerebrum including bilateral hemispheres, whole GM including cortical and subcortical GM, whole WM including the corpus callosum, and both lateral ventricles. The volumetric brain mask generated from the hemispheric cortical surface was used to differentiate each side of lateral ventricle area from the overall CSF map obtained by tissue classification. The GM map was divided into cortical and subcortical regions via a subcortical GM stereotaxic mask. The corpus callosum was defined from the WM map by a midsagittal brain mask.
Statistical Analysis
Intraclass correlation (ICC) was used to estimate the similarity of one variable between two members within a group (Koch GG, 1982). The difference of ICC between MZ and DZ twin pairs provides initial information on the magnitude of genetic effects on morphological variation in human brain (Falconer DS and TFC Mackay, 1996). If any genetic effects are present, the MZ ICC (rMZ) is expected to be twice the DZ ICC (rDZ). When rMZ is significantly greater than the corresponding rDZ, it is an indication of significant heritability, the magnitude of which can be roughly estimated by [2(rMZ − rDZ)], the upper bound of which is rMZ (Falconer DS and TFC Mackay, 1996). When, on the other hand, rDZ is greater than half of rMZ, there is evidence of common environmental influences which can be roughly estimated by [2rDZ − rMZ].
While the correlation method is merely designed for parameter calculation, structural equation modeling (SEM) is more sophisticated method to quantify the genetic and environmental influences by fitting models positing different patterns of influence upon the data, (Neale MC and LR Cardon, 1992). The basic model tests the hypothesis that genetic (A), common environment (C), and unique environment (E) factors account for the phenotype under study. The A term represents the broad sense heritability which reflects the additive genetic contribution to the total phenotypic variance. Although the E term is reflected by the degree to which MZ twins raised together are dissimilar, it includes effects of interactions between genes and environment, and measurement error as well. The univariate ACE models were constructed in Mx which is a software package for SEM combining a matrix algebra interpreter with a numerical optimizer (Neale MC et al., 2003). Statistical significance of variance components was determined by comparing the likelihood from models with or without the parameter. The difference in maximum likelihood between any model and a nested submodel follows a χ2 distribution with one degree of freedom. The threshold for statistical significance was set at an α of 0.05. Correction for multiple comparisons was performed using false discovery rate (FDR) at a q-value of 0.05(Genovese CR et al., 2002). Power analyses were generated using simulations, which based on finding the non-centrality parameter by constraining parameters to zero and refitting the model (Posthuma D and DI Boomsma, 2005). The non-centrality parameter is directly related to the sample size required to reject the false model with a specified power and a significance level of 0.05.
Results
Regional Tissue Volume
Table 2 shows the MZ and DZ ICCs for several brain tissue volumes. The proportion of variance shared by DZ twins was lower than that observed in MZ twins for all brain tissue volumes except the right lateral ventricle and corpus callosum. Next, we estimated the genetic and environmental components of variance using combined information in the variance-covariance matrix for each volumetric measurement. Table 2 also presents estimation of A, C, and E as derived from the univariate genetic model of the observed data. As expected from the differences in MZ and DZ ICCs, relatively large common environmental influence on the right lateral ventricle (0.36) and corpus callosum (0.36) volumes were observed while the additive genetic effects of phenotypic variance were substantial for all other brain tissue volumes. In particular, only the left cortical GM volume showed a significant genetic effect.
Table 2.
Intraclass correlations and estimates of genetic and environmental influences for brain morphometric volume measures.
| ICCMZ | ICCDZ | MLEa |
|||
|---|---|---|---|---|---|
| Ab | Cb | Eb | |||
| Whole Brain | .96** (.92/.98) | .68** (.52/.81) | .71** (.28/.87) | .09 (.00/.50) | .20 (.13/.31) |
| Left Hemisphere | .95** (.91/.98) | .68** (.53/.82) | .78** (.33/.85) | .00 (.00/.42) | .22 (.15/.34) |
| Right Hemisphere | .95** (.92/.98) | .68** (.52/.83) | .51 (.07/.82) | .22 (.00/.61) | .27 (.18/.41) |
|
| |||||
| Whole Ventricle | .78** (.63/.86) | .55** (.25/.78) | .48 (.05/.81) | .25 (.00/.63) | .27 (.18/.41) |
| Left Ventricle | .71** (.54/.83) | .46* (.11/.74) | .54 (.03/.77) | .12 (.00/.57) | .34 (.22/.50) |
| Right Ventricle | .69** (.52/.82) | .53** (.21/.75) | .24 (.00/.71) | .36 (.00/.67) | .40 (.27/.58) |
|
| |||||
| Whole GMc | .92** (.85/.96) | .60** (.36/.77) | .65 (.20/.76) | .00 (.00/.39) | .35 (.24/.52) |
| Left GM | .92** (.85/.96) | .59** (.34/.76) | .67* (.29/.78) | .00 (.00/.33) | .33 (.22/.49) |
| Cortical GM | .91** (.83/.95) | .59** (.36/.78) | .65* (.24/.77) | .00 (.00/.36) | .35 (.23/.52) |
| Subcortical GM | .57** (.40/.71) | .14 (.00/.45) | .41 (.00/.59) | .00 (.00/.47) | .59 (.41/.83) |
| Right GM | .91** (.83/.95) | .60** (.36/.78) | .59 (.04/.72) | .00 (.00/.47) | .41 (.28/.60) |
| Cortical GM | .90** (.84/.95) | .59** (.38/.77) | .56 (.00/.70) | .00 (.00/.49) | .44 (.30/.64) |
| Subcortical GM | .50** (.28/.69) | .29 (.00/.54) | .32 (.00/.60) | .10 (.00/.51) | .58 (.40/.81) |
|
| |||||
| Whole WMc | .93** (.88/.96) | .53** (.34/.73) | .80** (.57/.87) | .00 (.00/.21) | .20 (.13/.32) |
| Left WM | .92** (.88/.95) | .53** (.32/.72) | .81** (.60/.88) | .00 (.00/.18) | .19 (.12/.31) |
| Right WM | .93** (.88/.96) | .54** (.32/.74) | .81** (.59/.88) | .00 (.00/.21) | .19 (.12/.30) |
|
| |||||
| Corpus Callosum | .87** (.80/.92) | .69** (.49/.85) | .51** (.21/.90) | .36 (.00/.65) | .13 (.09/.21) |
MLE, maximum likelihood estimate
A, additive genetic effects; C, common environmental effects; E, unique environmental effects
GM, gray matter; WM, white matter
Values in parentheses are the 95% confidence intervals.
p < 0.05
p < 0.01
Cortical Thickness
The cross-twin ICC of cortical thickness at the vertex level is displayed in Figure 1. Note that rMZ was considerably higher than rDZ across the whole cortical surface. In particular, rMZ (mean±standard deviation: 0.49±0.12) was almost twice as large as rDZ (0.14±0.12) in left hemisphere, which suggested additive genetic variance. On the other hand, several regions in the right hemisphere such as the anterior cingulate cortex and insula had an rDZ (0.50) that was greater than half of rMZ (0.55), indicating that cross-twin ICCs of those regions were produced mainly by common environmental effects (2rDZ - rMZ = 0.45) rather than genetic ones (2(rMZ - rDZ) = 0.10). Table 3 shows cross-twin correlations for each hemisphere and lobe. All of the left hemisphere and lobes demonstrated significantly higher rMZ (0.59 - 0.73) compared with the rDZ (0.00 - 0.33). Even though the rMZ values (> 0.5) in the right hemispheric regions were as high as those in the left one, rDZ in those regions was also relatively high, especially the frontal (0.23) and occipital (0.31) lobes. This could be attributed to the left-lateralized genetic effects and right-lateralized environmental effects on the variation of cortical thickness for pediatric brain. This would be confirmed by the following formal estimation of the genetic and environmental influences using the combined information in the variance -covariance matrix.
Figure 1.

Intraclass correlation map for cortical thickness. Color bar displays the scale of the correlation value. MZ correlations were significantly higher than those for DZ at most of vertices in both hemispheres.
Table 3.
Intraclass correlations and estimates of genetic and environmental influences for mean cortical thickness in each hemisphere and lobe.
| ICCMZ | ICCDZ | MLEa | ||||
|---|---|---|---|---|---|---|
| Ab | Cb | Eb | ||||
| Whole | Lc | .72** (.57/.83) | .08 (.00/.40) | .71** (.45/.81) | .00 (.00/.21) | .29 (.19/.46) |
| Rc | .58** (.39/.71) | .20 (.00/.55) | .56 (.09/.70) | .00 (.00/.40) | .44 (.30/.63) | |
| Frontal | L | .73** (.58/.83) | .12 (.00/.48) | .72** (.45/.82) | .00 (.00/.23) | .28 (.18/.43) |
| R | .55** (.35/.71) | .23 (.00/.53) | .54 (.00/.69) | .00 (.00/.46) | .46 (.31/.66) | |
| Temporal | L | .59** (.37/.72) | .12 (.00/.44) | .56 (.17/.71) | .00 (.00/.32) | .44 (.29/.64) |
| R | .55** (.34/.68) | .21 (.00/.52) | .53 (.02/.68) | .00 (.00/.43) | .47 (.32/.67) | |
| Parietal | L | .64** (.46/.75) | .00 (.00/.27) | .59** (.32/.74) | .00 (.00/.20) | .41 (.26/.61) |
| R | .50** (.25/.67) | .06 (.00/.34) | .46 (.05/.64) | .00 (.00/.33) | .54 (.36/.76) | |
| Occipital | L | .68** (.51/.80) | .33 (.00/.64) | .67* (.17/.78) | .00 (.00/.45) | .33 (.22/.48) |
| R | .62** (.45/.74) | .31 (.00/.56) | .61 (.05/.74) | .00 (.00/.49) | .39 (.26/.57) | |
MLE, maximum likelihood estimate
A, additive genetic effects; C, common environmental effects; E, unique environmental effects
L, left; R, right
Values in parentheses are the 95% confidence intervals.
p < 0.05
p < 0.01
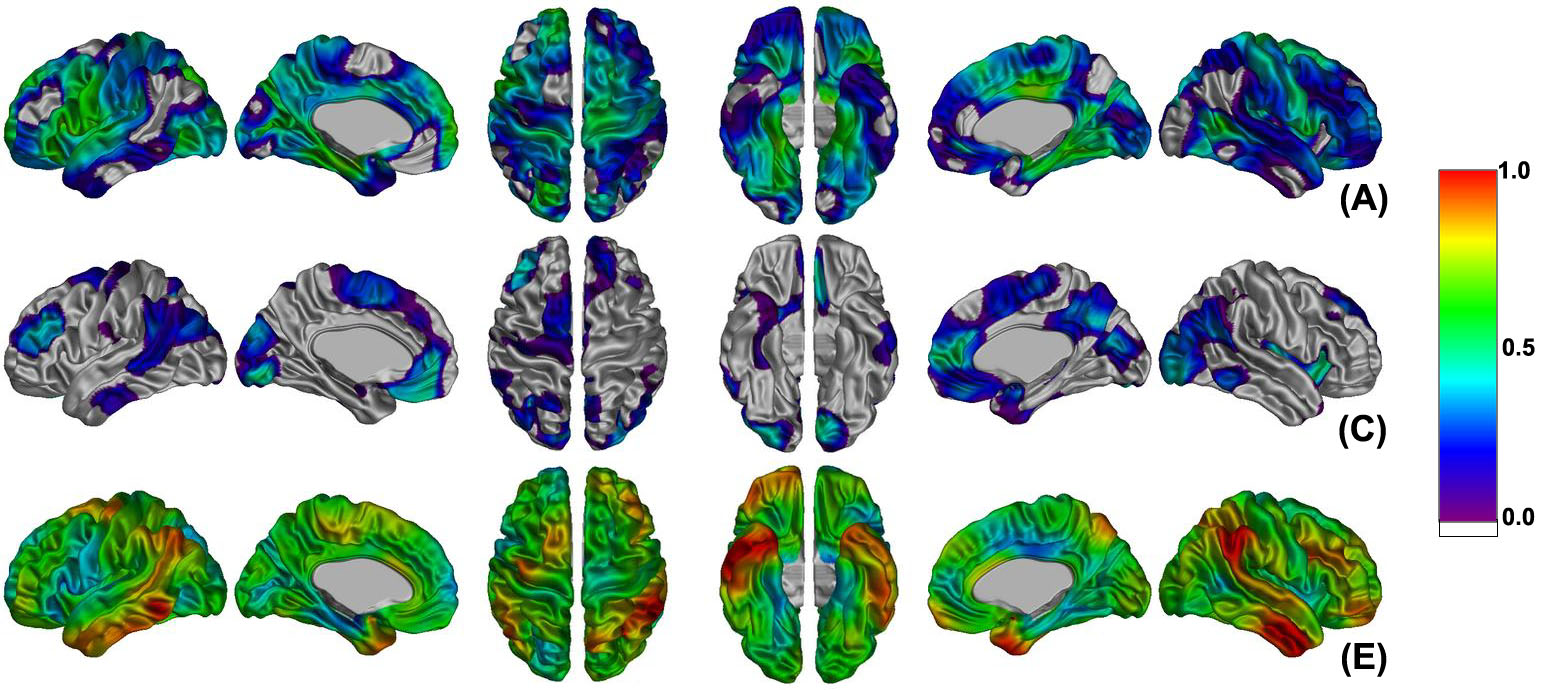
Figure 2 shows the vertex-based estimation of genetic and environmental influences on cortical thickness variance derived from the full ACE model. Power analyses showed that with this sample we had more than an 80% chance of detecting cortical points with heritability values of 50% or greater. Heritability estimates ranged from 0 to a maximum of 0.78 (left) and 0.67 (right). Regions where heritability was over 0.60 were found bilaterally in the primary motor cortex. Unilateral foci were found in the left insula, uncus, superior occipital gyrus, parahippocampal gyrus, middle and inferior frontal gyri, and the right precuneus, medial frontal and occipitotemporal gyri. Although common environmental influences were not significant for any regions, the right anterior cingulate cortex and insula exhibited rather high value (> 0.50). This increased common environmental effect was consistent with the high rDZ (> 0.50) of those areas (Figure 1). While there was no region with significant genetic effect in the right hemisphere that could be explained by a rather high common environmental effect, the middle and inferior frontal gyri, lateral fronto-orbital and occipitotemporal gyri, pars opercularis (Broca’s area), planum temporale (Wernicke’s area), precentral and parahippocampal gyri, and medial region of the primary somatosensory cortex of the left hemisphere showed statistically significant heritability of cortical thickness (Figure 3(a)). All of the left hemisphere and lobes except temporal lobe showed statistically significant genetic effects (0.59 - 0.72) as expected (Table 3). These results indicate that left hemispheric cortical morphology is more genetically determined and that the right hemisphere is more susceptible to environmental factors. In order to verify if there was any influence of handedness on heritability of cortical thickness, the same vertex-based genetic analysis was applied to only right-handed twin pairs (see Table 1, MZ: 43 pairs; DZ: 19). While this showed a little larger common environmental effect compared with the result from all twin pairs, we observed left-lateralized genetic trends in the same areas as for the entire sample, albeit that these trends just failed to reach significance (see Supplementary Figure 3). Although the number of left-handed subjects omitted was relatively small (N= 60) with respect to the total sample size under study (N=184), they represented 46% of the DZ population and their removal had a significant impact on the power of the analysis.
Figure 2.

Estimates of genetic and environmental influences at each vertex from the hypothesis that additive genetic (A), common environment (C), and unique environment (E) factors account for the variance of cortical thickness between twins. Color bar displays the scale of proportional variance value.
Figure 3.
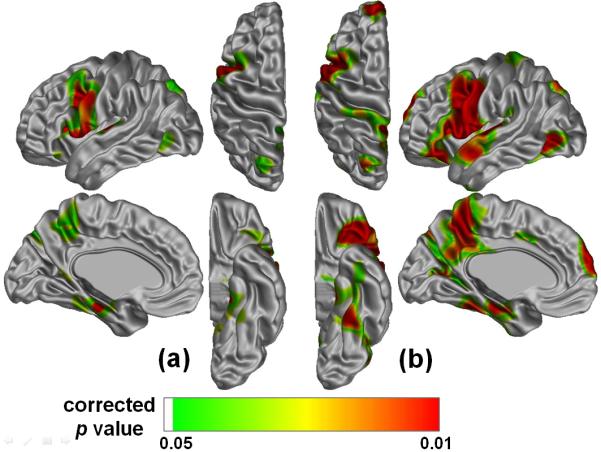
Brain regions with significant genetic effects on cortical thickness (a) and its hemispheric asymmetry (b). Each vertex is color-mapped for level of significance following the application of an FDR threshold. Since there is no region with a significant genetic effect in the right hemisphere, only the left hemispheric cortical surface is displayed. In particular, Broca’s area (BA 44), parahippocampal gyri (BA 34) and the medial region of primary somatosensory cortex (BA 1, 2, 3) showed a statistically significant heritability of cortical thickness (a). These areas were included in regions of significantly heritable hemispheric asymmetry (b). It meant that left-lateralized genetic influences on cortical thickness were rather caused by structural asymmetry.
We performed a similar analysis to measure the genetic influence upon cortical thickness asymmetry, substituting an asymmetry index for cortical thickness. We defined the asymmetry index (A) of cortical thickness (T) between left and right hemispheres for each subject as follows:
Figure 3(b) shows the significance of the genetic effect on this cortical thickness asymmetry. All of areas that showed left-lateralized genetic effects on cortical thickness were included in regions of significantly heritable hemispheric asymmetry.
Discussion
Interest in understanding genetic effects on brain structure and function is increasing rapidly within the neuroimaging community (Glahn DC et al., 2007). Twin studies in genetic epidemiology are popular since the comparison between MZ and DZ twins provides a unique and powerful method of partitioning genetic and environmental sources of covariance. In this study, we have analyzed the heritability of several brain tissue volumes and cortical thickness in a cohort of healthy pediatrics twins. Although several pediatric twin studies have reported genetic and environmental influences on brain morphometric measures, most of them included subjects with wide age ranged from early childhood to adolescent (Eckert MA et al., 2002; Pennington BF et al., 2000; Wallace GL et al., 2006). This complicates any generalization of the results since brain volumes undergo dynamic changes with age. Cortical growth rate is different with respect to the lobes and gyri even if brain folding is almost complete by birth (Blinkov SM and II Glezer, 1968). Moreover, the influences of genetic and environmental factors on human brain structure also change with age. It has been previously shown that frontal and temporal GM structures have a decreasing genetic but increasing environmental variance component with age (Wallace GL et al., 2006). In homogeneous age groups, therefore, more accurate heritabilities at their developmental stage can be provided even though findings from this study might not be applicable to different age populations such as younger children, adolescents or adults (Peper JS et al., 2007). To the best of our knowledge, this is the first heritability study of cortical thickness and regional tissue volumes for homogeneously-aged pediatric twins. The key point is that one must first isolate the genetic effect without an age confound in a homegenously-aged cohort. While the result from an 8-year-old population may not be immediately generalizable to younger or older cohorts, the solution to the problem of generalizability is not to have a heterogeneously-aged cohort. This will only tend to confound aging and genetic effects. Although the classical twin method is generally insufficient for detecting common environmental influences on brain morphological variability due to subject heterogeneity, our study provides a better estimate of environmental influence by virtue of the homogeneity in the ages and growing environment of the subjects, respectively.
The cross-twin ICCs for MZ twins were significantly higher than those for DZ twins for cortical thickness in all cortical areas, except for right anterior cingulate cortex and insula, and for all brain tissue volumes except for the right lateral ventricle and corpus callosum. These results were consistent with previous studies (Geschwind DH et al., 2002; Thompson PM et al., 2001; Wallace GL et al., 2006). Though it might seem unnecessary to consider brain morphological differences between MZ twins because of the identical genotype of MZ twins, there are various reasons why MZ twins might still have different brain morphological features. For example, different placental location between twins can make intrauterine blood supply unbalanced (Gilmore JH et al., 1996). Birth order with a possibly less favorable oxygen supply for the second twin can also result in different brain morphology (Mohr A et al., 2004). Therefore, the observed phenotypic differences between MZ twins might be explained by the environmental factors rather than by the genetic effects. Generally, “common environment” refers to the life experience shared by co-twins, including the intrauterine environment, early familial factors such as the rearing environment and their joint exposure to the same social and cultural environment.
As shown in Table 2, genetic factors accounted for most of the phenotypic variance in most brain tissue volumes, whereas the right lateral ventricle (0.36) and corpus callosum (0.36) showed a relatively large common environmental effect. It seems that a significant genetic influence on human brain morphology is already presented in childhood, and moreover, even in old age, variation in the brain volumes remains to be mainly explained by genetic factors (Peper JS et al., 2007). Previous studies have also reported the high heritability estimates for overall brain size and global GM and WM volumes (Baare WF et al., 2001; Bartley AJ et al., 1997; Geschwind DH et al., 2002; Pennington BF et al., 2000; Wright IC et al., 2002). In particular, GM volumes (0.65) tend to be less heritable compared with WM ones (0.80), which is consistent with the notion of synaptic plasticity in response to environmental influences and activity (Giedd JN et al., 2007). Although the variation in the corpus callosum has been shown to be highly heritable (Pfefferbaum A et al., 2000; Scamvougeras A et al., 2003) and the genetic effect achieved statistical significance in our study, a relatively strong common environmental influence (0.36) on the corpus callosum was also observed. It has been reported that a significant increase in the size of the corpus callosum, relative to total intracranial volume, occurs during early childhood (Schaefer GB et al., 1990). This might reflect the fact that myelination of the corpus callosum is still under way at those ages. Observed post-natal changes will therefore be ascribed to environmental effects, with a concomitantly decreased heritability relative to the adult population. In addition, individual differences in the lateral ventricle volume have been mainly explained by environmental factors, suggesting that the neighboring brain tissue, such as subcortical GM, is at least partly influenced by these environmental factors (Baare WF et al., 2001; Hulshoff Pol HE et al., 2006; Wright IC et al., 2002).
Several regions in the left hemisphere (middle and inferior frontal gyri, lateral fronto-orbital and occipitotemporal gyri, pars opercularis, planum temporale, precentral/ parahippocampal gyri and medial primary somatosensory cortex) showed statistically significant heritability for cortical thickness. These left-lateralized genetic effects were mostly involved in language processing and the somatosensory system, which was consistent with the developmental profile of 7- to 9-year-old children with regard to intellectual and physical aspects. As mentioned above, children with age 7 to 9 are developing linguistic refinement and auditory discrimination skills, and are more capable of finemotor tasks (Copple and Bredekamp, 2007). And, it has been suggested that the cerebral hemispheres might experience different genetic influences on cortical morphogenesis, with the language-dominant left cerebral cortex under stronger genetic control than the right (Tramo MJ et al., 1995). Given that the neural subsystems mediating speech and language functions are largely lateralized within the left hemisphere in humans, and language, as predicated on the rules of syntax, is a unique human behavior, our findings of a stronger genetic influence on the left than right cortical morphogenesis is an intriguing association that may shed light on the neurobiological bases of human evolution(Tramo MJ et al., 1995).
The functional asymmetry for language in the human brain correlates with the structural asymmetry of two regions, Broca’s and Wernicke’s area (Foundas AL et al., 1995; Geschwind N, 1970). It also has been reported that functional and structural asymmetry for language is strongly associated with hand preference (Benson DF, 1986; Geschwind N, 1970). Although little is known about the genetic basis of cerebral laterality, several researchers have explored the genetic models of handedness and report that right-handed people inherit the cerebral laterality for language and motor dominance to a greater degree than nonright-handed ones (Klar AJ, 1999; McManus IC, 1991). It was reported that genetic factors contributed twice the influence to hemispheric volume in right-handed twin pairs, suggesting a large decrement in genetic control of cerebral volumes in the nonright-handed twin pairs (Geschwind DH et al., 2002). While limiting the number of twin pairs to only right-handers (see Table 1, 75% of MZ (43 pairs) and 54% of DZ (19 pairs)) might dilute the significance of genetic effects, there was no significant difference between the asymmetry results for only right-handed twins and for all twins (see Figure 1 and Supplementary Figure 3). Instead, a similar trend of left-lateralized genetic effects was also observed for right-handed twin pairs only, albeit failing to reach significance, probably due to the small sample size. Even though they differ from previous volumetric findings of handedness effects on heritability (Geschwind DH et al., 2002), our findings were in close agreement with the recent result from Lenroot et al. (2009) which reported that heritability estimates of cortical thickness were not significantly affected by handedness.
Common environmental factors accounted for most of the phenotypic variance in the right lateral ventricle and corpus callosum volumes as well as cortical thickness of the right anterior cingulate cortex and insula. Even though the size of the common environmental effect did not achieve statistical significance, these brain morphological variations may still provide biological markers for the common environmental influences in siblings. This might be primarily maternal in origin since brain growth is largely completed in the prenatal and early postnatal period (Dekaban AS, 1978; Epstein HT, 1986; Roche AF et al., 1987). Contrary to the findings in this study, common environmental factors in adult twin studies have been reported previously to be almost twice as strong in frontal and temporal regions of the left hemisphere compared to those in the right hemisphere (Geschwind DH et al., 2002). There are several plausible reasons for this apparent contradiction. First, the age difference may be one of the factors since the relative contributions of genetic and non-genetic factors vary with developmental brain trajectories (Geschwind DH and BL Miller, 2001; Wallace GL et al., 2006). Secondly, the different methodology for brain morphometric measures such as GM density (Hulshoff Pol HE et al., 2006), cortical gyral pattern (Bartley AJ et al., 1997) and cortical thickness (Lenroot RK and JN Giedd, 2008; Lenroot RK et al., 2009) might yield different heritability estimates.
Methodological Considerations
A number of methodological factors should be considered when interpreting the results of this study.
a) Regional Parcellation
The contribution of measurement error or bias in regional partitioning has been previously identified as a major cause for the lower heritabilities in lobar regions (Geschwind DH et al., 2002). However, for the present study, it is intriguing that there is no significant difference in the cross-twin correlation and heritability between the whole hemisphere and each lobe. This suggests that any lobar parcellation errors do not affect the estimation of lobar volume heritability. In addition, previous validation studies (Im K et al., 2008; Yoon U et al., 2007) showed that the automatic lobar parcellation extracted reliable boundaries between lobes. Most volumetric heritability studies have been focused on a few specific ROI that are relevant to a particular neurobiological question (Baare WF et al., 2001; Eckert MA et al., 2002; Pfefferbaum A et al., 2000; Scamvougeras A et al., 2003). Even though studies have been performed on the estimation of genetic influences in typical populations for nearly all small substructures defined from MR brain images, low power and multiple testing issues caused by small sample size and variability in regional boundary have made those results unacceptable (Wright IC et al., 2002). Recently, various approaches to define functionally meaningful regions from the cortical surface have been presented (Clouchoux C et al., 2006; Fischl B et al., 2004; Lohmann G and DY von Cramon, 2000) even though there are still many controversies. For example, sulcal boundaries are used to define cortical regions, even though these boundaries can be quite different among individuals and do not necessarily correspond to real functional boundaries. If a more reliable parcellation for cortical substructures is used for future heritability studies, it would be possible to estimate genetic and environmental influences on more focally-defined brain regions that have clearer functional relevance than just the lobes used in this study.
b) Statistical Modeling
The Falconer’s method for estimating genetic variance is somewhat less powerful than the SEM method providing a more conservative tests of significance (Christian JC et al., 1995). However, it would be helpful to other researchers because ICCs are provided as a frame of reference as in this study. On the other hand, there have been several reports that estimate genetic variance and its significance from the reduced AE model, i.e. the ACE model without the common environment term. However, this strategy might yield too low power for relatively small twin studies or generate biased results due to questionable acceptances of the null hypothesis by ignoring the common environmental effect (Christian JC et al., 1995). Therefore, it is recommended that comparison of the ACE and CE models should be used to estimate and test the significance of genetic effect.
c) Regional Volume vs. Vertex-based Analysis
Vertex-level analysis has the advantage of increased spatial resolution, as well as a lack of a priori constraints on the data. However, it can also raise the issue of measurement errors in the analysis and subsequent multiple testing due to the more exploratory nature of the method. Nevertheless, this technique offers great promises in identifying subtle effects of genetic factors on brain structure that may be obscured by using only lobar measures. On the other hand, cortical gray matter volume is affected by both the thickness of the cortex and its surface area. They are determined by different types of cell division during the genesis of the cortex, suggesting that cortical thickness and area may be affected by different factors during evolution and individual development (Rakic P, 1988, 1995). Although developmental changes in both cortical thickness and surface topology during childhood and adolescence have been reported, little is known about how longitudinal changes in these measurements may relate to each other (Gogtay N et al., 2004; Sowell ER et al., 2002). These findings suggest that variations in cortical thickness and lobar volumes may be controlled by different factors, and tha t caution should be observed in considering gray matter volume and thickness as equivalent measures. In conclusion, our results show that left-lateralized genetic and right-lateralized common environmental influences account for individual differences in human brain structures. This lateralization appears weighted toward a greater genetic influence upon left hemispheric areas involved in language processing.
Supplementary Material
Supplement Figure 1. Lower and upper bounds of 95% confidence intervals for cross-twin correlation in cortical thickness at the level of vertex in cortical hemispheric surface. (LCI: lower bounds of confidence interval; UCI: upper bounds of. confidence interval)
Supplement Figure 2. Lower and upper bounds of 95% confidence intervals for estimates of genetic and environmental influences at each vertex. (LCI: lower bounds of confidence interval; UCI: upper bounds of confidence interval)
Supplement Figure 3. Estimates of genetic and environmental influences at each vertex for right-handed twin pairs. Color bar displays the scale of proportional variance value.
Footnotes
Publisher's Disclaimer: This is a PDF file of an unedited manuscript that has been accepted for publication. As a service to our customers we are providing this early version of the manuscript. The manuscript will undergo copyediting, typesetting, and review of the resulting proof before it is published in its final citable form. Please note that during the production process errors may be discovered which could affect the content, and all legal disclaimers that apply to the journal pertain.
Footnotes to the title Lateralized Genetic Influences on Pediatric Brain
References
- Alexander MP, Annett M. Crossed aphasia and related anomalies of cerebral organization: case reports and a genetic hypothesis. Brain Lang. 1996;55:213–239. doi: 10.1006/brln.1996.0102. [DOI] [PubMed] [Google Scholar]
- Baare WF, Pol HE Hulshoff, Boomsma DI, Posthuma D, de Geus EJ, Schnack HG, van Haren NE, van Oel CJ, Kahn RS. Quantitative genetic modeling of variation in human brain morphology. Cereb Cortex. 2001;11:816–824. doi: 10.1093/cercor/11.9.816. [DOI] [PubMed] [Google Scholar]
- Bartley AJ, Jones DW, Weinberger DR. Genetic variability of human brain size and cortical gyral patterns. Brain. 1997;120(Pt 2):257–269. doi: 10.1093/brain/120.2.257. [DOI] [PubMed] [Google Scholar]
- Benson DF. Aphasia and the lateralization of language. Cortex. 1986;22:71–86. doi: 10.1016/s0010-9452(86)80033-8. [DOI] [PubMed] [Google Scholar]
- Biondi A, Nogueira H, Dormont D, Duyme M, Hasboun D, Zouaoui A, Chantome M, Marsault C. Are the brains of monozygotic twins similar? A three-dimensional MR study. Ajnr. 1998;19:1361–1367. [PMC free article] [PubMed] [Google Scholar]
- Blinkov SM, Glezer II. The human brain in figures and tables: A quantitative handbook. Basic Books; New York: 1968. [Google Scholar]
- Boomsma D, Busjahn A, Peltonen L. Classical twin studies and beyond. Nat Rev Genet. 2002;3:872–882. doi: 10.1038/nrg932. [DOI] [PubMed] [Google Scholar]
- Chi JG, Dooling EC, Gilles FH. Left-right asymmetries of the temporal speech areas of the human fetus. Arch Neurol. 1977;34:346–348. doi: 10.1001/archneur.1977.00500180040008. [DOI] [PubMed] [Google Scholar]
- Christian JC, Norton JA, Jr., Sorbel J, Williams CJ. Comparison of analysis of variance and maximum likelihood based path analysis of twin data: partitioning genetic and environmental sources of covariance. Genetic epidemiology. 1995;12:27–35. doi: 10.1002/gepi.1370120104. [DOI] [PubMed] [Google Scholar]
- Clouchoux C, Coulon O, Anton JL, Mangin JF, Regis J. A new cortical surface parcellation model and its automatic implementation. Med Image Comput Comput Assist Interv Int Conf Med Image Comput Comput Assist Interv. 2006;9:193–200. doi: 10.1007/11866763_24. [DOI] [PubMed] [Google Scholar]
- Collins DL, Neelin P, Peters TM, Evans AC. Automatic 3D intersubject registration of MR volumetric data in standardized Talairach space. J Comput Assist Tomogr. 1994;18:192–205. [PubMed] [Google Scholar]
- Dekaban AS. Changes in brain weights during the span of human life: relation of brain weights to body heights and body weights. Annals of neurology. 1978;4:345–356. doi: 10.1002/ana.410040410. [DOI] [PubMed] [Google Scholar]
- Eckert MA, Leonard CM, Molloy EA, Blumenthal J, Zijdenbos A, Giedd JN. The epigenesis of planum temporale asymmetry in twins. Cereb Cortex. 2002;12:749–755. doi: 10.1093/cercor/12.7.749. [DOI] [PMC free article] [PubMed] [Google Scholar]
- Epstein HT. Stages in human brain development. Brain research. 1986;395:114–119. doi: 10.1016/s0006-8993(86)80017-8. [DOI] [PubMed] [Google Scholar]
- Evans AC. The NIH MRI study of normal brain development. Neuroimage. 2006;30:184–202. doi: 10.1016/j.neuroimage.2005.09.068. [DOI] [PubMed] [Google Scholar]
- Falconer DS, Mackay TFC. Introduction to Quantitative Genetics. 4th Edition Longman Group; London: 1996. [Google Scholar]
- Fischl B, van der Kouwe A, Destrieux C, Halgren E, Segonne F, Salat DH, Busa E, Seidman LJ, Goldstein J, Kennedy D, Caviness V, Makris N, Rosen B, Dale AM. Automatically parcellating the human cerebral cortex. Cereb Cortex. 2004;14:11–22. doi: 10.1093/cercor/bhg087. [DOI] [PubMed] [Google Scholar]
- Forget-Dubois N, Perusse D, Turecki G, Girard A, Billette JM, Rouleau G, Boivin M, Malo J, Tremblay RE. Diagnosing zygosity in infant twins: physical similarity, genotyping, and chorionicity. Twin Res. 2003;6:479–485. doi: 10.1375/136905203322686464. [DOI] [PubMed] [Google Scholar]
- Foundas AL, Leonard CM, Heilman KM. Morphologic cerebral asymmetries and handedness. The pars triangularis and planum temporale. Arch Neurol. 1995;52:501–508. doi: 10.1001/archneur.1995.00540290091023. [DOI] [PubMed] [Google Scholar]
- Genovese CR, Lazar NA, Nichols T. Thresholding of statistical maps in functional neuroimaging using the false discovery rate. Neuroimage. 2002;15:870–878. doi: 10.1006/nimg.2001.1037. [DOI] [PubMed] [Google Scholar]
- Geschwind DH, Miller BL. Molecular approaches to cerebral laterality: development and neurodegeneration. American journal of medical genetics. 2001;101:370–381. [PubMed] [Google Scholar]
- Geschwind DH, Miller BL, DeCarli C, Carmelli D. Heritability of lobar brain volumes in twins supports genetic models of cerebral laterality and handedness. Proc Natl Acad Sci U S A. 2002;99:3176–3181. doi: 10.1073/pnas.052494999. [DOI] [PMC free article] [PubMed] [Google Scholar]
- Geschwind N. The organization of language and the brain. Science. 1970;170:940–944. doi: 10.1126/science.170.3961.940. [DOI] [PubMed] [Google Scholar]
- Geschwind N, Galaburda AM. Cerebral lateralization. Biological mechanisms, associations, and pathology: I. A hypothesis and a program for research. Arch Neurol. 1985;42:428–459. doi: 10.1001/archneur.1985.04060050026008. [DOI] [PubMed] [Google Scholar]
- Geschwind N, Galaburda AM. Cerebral lateralization. Biological mechanisms, associations, and pathology: II. A hypothesis and a program for research. Arch Neurol. 1985;42:521–552. doi: 10.1001/archneur.1985.04060060019009. [DOI] [PubMed] [Google Scholar]
- Geschwind N, Galaburda AM. Cerebral lateralization. Biological mechanisms, associations, and pathology: III. A hypothesis and a program for research. Arch Neurol. 1985;42:634–654. doi: 10.1001/archneur.1985.04060070024012. [DOI] [PubMed] [Google Scholar]
- Giedd JN, Schmitt JE, Neale MC. Structural brain magnetic resonance imaging of pediatric twins. Hum Brain Mapp. 2007;28:474–481. doi: 10.1002/hbm.20403. [DOI] [PMC free article] [PubMed] [Google Scholar]
- Gilmore JH, Perkins DO, Kliewer MA, Hage ML, Silva SG, Chescheir NC, Hertzberg BS, Sears CA. Fetal brain development of twins assessed in utero by ultrasound: implications for schizophrenia. Schizophr Res. 1996;19:141–149. doi: 10.1016/0920-9964(95)00099-2. [DOI] [PubMed] [Google Scholar]
- Glahn DC, Thompson PM, Blangero J. Neuroimaging endophenotypes: strategies for finding genes influencing brain structure and function. Hum Brain Mapp. 2007;28:488–501. doi: 10.1002/hbm.20401. [DOI] [PMC free article] [PubMed] [Google Scholar]
- Gogtay N, Giedd JN, Lusk L, Hayashi KM, Greenstein D, Vaituzis AC, Nugent TF, Herman DH, Clasen LS, Toga AW, Rapoport JL, Thompson PM. Dynamic mapping of human cortical development during childhood through early adulthood. Proceedings of the National Academy of Sciences of the United States of America. 2004;101:8174–8179. doi: 10.1073/pnas.0402680101. [DOI] [PMC free article] [PubMed] [Google Scholar]
- Goldsmith HH, Lemery KS, Buss KA, Campos JJ. Genetic analyses of focal aspects of infant temperament. Dev Psychol. 1999;35:972–985. [PubMed] [Google Scholar]
- Hoeksma MR, Kenemans JL, Kemner C, van Engeland H. Variability in spatial normalization of pediatric and adult brain images. Clin Neurophysiol. 2005;116:1188–1194. doi: 10.1016/j.clinph.2004.12.021. [DOI] [PubMed] [Google Scholar]
- Pol HE Hulshoff, Schnack HG, Posthuma D, Mandl RC, Baare WF, van Oel C, van Haren NE, Collins DL, Evans AC, Amunts K, Burgel U, Zilles K, de Geus E, Boomsma DI, Kahn RS. Genetic contributions to human brain morphology and intelligence. J Neurosci. 2006;26:10235–10242. doi: 10.1523/JNEUROSCI.1312-06.2006. [DOI] [PMC free article] [PubMed] [Google Scholar]
- Im K, Lee JM, Lyttelton O, Kim SH, Evans AC, Kim SI. Brain size and cortical structure in the adult human brain. Cereb Cortex. 2008;18:2181–2191. doi: 10.1093/cercor/bhm244. [DOI] [PubMed] [Google Scholar]
- Im K, Lee JM, Yoon U, Shin YW, Hong SB, Kim IY, Kwon JS, Kim SI. Fractal dimension in human cortical surface: multiple regression analysis with cortical thickness, sulcal depth, and folding area. Hum Brain Mapp. 2006;27:994–1003. doi: 10.1002/hbm.20238. [DOI] [PMC free article] [PubMed] [Google Scholar]
- Kabani N, Le Goualher G, MacDonald D, Evans AC. Measurement of cortical thickness using an automated 3-D algorithm: a validation study. Neuroimage. 2001;13:375–380. doi: 10.1006/nimg.2000.0652. [DOI] [PubMed] [Google Scholar]
- Kim JS, Singh V, Lee JK, Lerch J, Ad-Dab’bagh Y, MacDonald D, Lee JM, Kim SI, Evans AC. Automated 3-D extraction and evaluation of the inner and outer cortical surfaces using a Laplacian map and partial volume effect classification. Neuroimage. 2005;27:210–221. doi: 10.1016/j.neuroimage.2005.03.036. [DOI] [PubMed] [Google Scholar]
- Klar AJ. Genetic models for handedness, brain lateralization, schizophrenia, and manic - depression. Schizophr Res. 1999;39:207–218. doi: 10.1016/s0920-9964(99)00075-4. [DOI] [PubMed] [Google Scholar]
- Koch GG. Intraclass correlation coefficient. John Wiley & Sons; New York: 1982. [Google Scholar]
- Lee JK, Lee JM, Kim JS, Kim IY, Evans AC, Kim SI. A novel quantitative cross-validation of different cortical surface reconstruction algorithms using MRI phantom. Neuroimage. 2006;31:572–584. doi: 10.1016/j.neuroimage.2005.12.044. [DOI] [PubMed] [Google Scholar]
- Lenroot RK, Giedd JN. The changing impact of genes and environment on brain development during childhood and adolescence: initial findings from a neuroimaging study of pediatric twins. Development and psychopathology. 2008;20:1161–1175. doi: 10.1017/S0954579408000552. [DOI] [PMC free article] [PubMed] [Google Scholar]
- Lenroot RK, Schmitt JE, Ordaz SJ, Wallace GL, Neale MC, Lerch JP, Kendler KS, Evans AC, Giedd JN. Differences in genetic and environmental influences on the human cerebral cortex associated with development during childhood and adolescence. Hum Brain Mapp. 2009;30:163–174. doi: 10.1002/hbm.20494. [DOI] [PMC free article] [PubMed] [Google Scholar]
- Lerch JP, Evans AC. Cortical thickness analysis examined through power analysis and a population simulation. Neuroimage. 2005;24:163–173. doi: 10.1016/j.neuroimage.2004.07.045. [DOI] [PubMed] [Google Scholar]
- Lohmann G, von Cramon DY. Automatic labelling of the human cortical surface using sulcal basins. Med Image Anal. 2000;4:179–188. doi: 10.1016/s1361-8415(00)00024-4. [DOI] [PubMed] [Google Scholar]
- Lohmann G, von Cramon DY, Steinmetz H. Sulcal variability of twins. Cereb Cortex. 1999;9:754–763. doi: 10.1093/cercor/9.7.754. [DOI] [PubMed] [Google Scholar]
- Luders E, Steinmetz H, Jancke L. Brain size and grey matter volume in the healthy human brain. Neuroreport. 2002;13:2371–2374. [PubMed] [Google Scholar]
- Lyttelton O, Boucher M, Robbins S, Evans A. An unbiased iterative group registration template for cortical surface analysis. Neuroimage. 2007;34:1535–1544. doi: 10.1016/j.neuroimage.2006.10.041. [DOI] [PubMed] [Google Scholar]
- MacDonald D, Kabani N, Avis D, Evans AC. Automated 3-D extraction of inner and outer surfaces of cerebral cortex from MRI. Neuroimage. 2000;12:340–356. doi: 10.1006/nimg.1999.0534. [DOI] [PubMed] [Google Scholar]
- McManus IC. The inheritance of left-handedness. Ciba Found Symp. 1991;162:251–267. doi: 10.1002/9780470514160.ch15. discussion 267-281. [DOI] [PubMed] [Google Scholar]
- Mohr A, Weisbrod M, Schellinger P, Knauth M. The similarity of brain morphology in healthy monozygotic twins. Brain Res Cogn Brain Res. 2004;20:106–110. doi: 10.1016/j.cogbrainres.2004.02.001. [DOI] [PubMed] [Google Scholar]
- Morris-Yates A, Andrews G, Howie P, Henderson S. Twins: a test of the equal environments assumption. Acta Psychiatr Scand. 1990;81:322–326. doi: 10.1111/j.1600-0447.1990.tb05457.x. [DOI] [PubMed] [Google Scholar]
- Neale MC, Boker SM, Xie G, Maes HH. Mx: statistical modeling. 6th Edition Department of Psychiatry, Virginia Commonwealth University; Richmond, VA: 2003. [Google Scholar]
- Neale MC, Cardon LR. Methodology for genetic studies of twins and families. Kluwer Academic Publishers; Dordrecht, the Netherlands: 1992. [Google Scholar]
- Oldfield RC. The assessment and analysis of handedness: the Edinburgh inventory. Neuropsychologia. 1971;9:97–113. doi: 10.1016/0028-3932(71)90067-4. [DOI] [PubMed] [Google Scholar]
- Pennington BF, Filipek PA, Lefly D, Chhabildas N, Kennedy DN, Simon JH, Filley CM, Galaburda A, DeFries JC. A twin MRI study of size variations in human brain. J Cogn Neurosci. 2000;12:223–232. doi: 10.1162/089892900561850. [DOI] [PubMed] [Google Scholar]
- Peper JS, Brouwer RM, Boomsma DI, Kahn RS, Pol HE Hulshoff. Genetic influences on human brain structure: a review of brain imaging studies in twins. Hum Brain Mapp. 2007;28:464–473. doi: 10.1002/hbm.20398. [DOI] [PMC free article] [PubMed] [Google Scholar]
- Pfefferbaum A, Sullivan EV, Swan GE, Carmelli D. Brain structure in men remains highly heritable in the seventh and eighth decades of life. Neurobiology of aging. 2000;21:63–74. doi: 10.1016/s0197-4580(00)00086-5. [DOI] [PubMed] [Google Scholar]
- Plomin R, Craig I. Human behavioural genetics of cognitive abilities and disabilities. Bioessays. 1997;19:1117–1124. doi: 10.1002/bies.950191211. [DOI] [PubMed] [Google Scholar]
- Rakic P. Specification of cerebral cortical areas. Science (New York, NY. 1988;241:170–176. doi: 10.1126/science.3291116. [DOI] [PubMed] [Google Scholar]
- Rakic P. A small step for the cell, a giant leap for mankind: a hypothesis of neocortical expansion during evolution. Trends in neurosciences. 1995;18:383–388. doi: 10.1016/0166-2236(95)93934-p. [DOI] [PubMed] [Google Scholar]
- Robbins S, Evans AC, Collins DL, Whitesides S. Tuning and comparing spatial normalization methods. Med Image Anal. 2004;8:311–323. doi: 10.1016/j.media.2004.06.009. [DOI] [PubMed] [Google Scholar]
- Roche AF, Mukherjee D, Guo SM, Moore WM. Head circumference reference data: birth to 18 years. Pediatrics. 1987;79:706–712. [PubMed] [Google Scholar]
- Rubenstein JL, Rakic P. Genetic control of cortical development. Cereb Cortex. 1999;9:521–523. doi: 10.1093/cercor/9.6.521. [DOI] [PubMed] [Google Scholar]
- Scamvougeras A, Kigar DL, Jones D, Weinberger DR, Witelson SF. Size of the human corpus callosum is genetically determined: an MRI study in mono and dizygotic twins. Neuroscience letters. 2003;338:91–94. doi: 10.1016/s0304-3940(02)01333-2. [DOI] [PubMed] [Google Scholar]
- Schaefer GB, Thompson JN, Jr., Bodensteiner JB, Hamza M, Tucker RR, Marks W, Gay C, Wilson D. Quantitative morphometric analysis of brain growth using magnetic resonance imaging. Journal of child neurology. 1990;5:127–130. doi: 10.1177/088307389000500211. [DOI] [PubMed] [Google Scholar]
- Sled JG, Zijdenbos AP, Evans AC. A nonparametric method for automatic correction of intensity nonuniformity in MRI data. IEEE Trans Med Imaging. 1998;17:87–97. doi: 10.1109/42.668698. [DOI] [PubMed] [Google Scholar]
- Sowell ER, Thompson PM, Rex D, Kornsand D, Tessner KD, Jernigan TL, Toga AW. Mapping sulcal pattern asymmetry and local cortical surface gray matter distribution in vivo: maturation in perisylvian cortices. Cereb Cortex. 2002;12:17–26. doi: 10.1093/cercor/12.1.17. [DOI] [PubMed] [Google Scholar]
- Thompson PM, Cannon TD, Narr KL, van Erp T, Poutanen VP, Huttunen M, Lonnqvist J, Standertskjold-Nordenstam CG, Kaprio J, Khaledy M, Dail R, Zoumalan CI, Toga AW. Genetic influences on brain structure. Nat Neurosci. 2001;4:1253–1258. doi: 10.1038/nn758. [DOI] [PubMed] [Google Scholar]
- Toga AW, Thompson PM. Mapping brain asymmetry. Nat Rev Neurosci. 2003;4:37–48. doi: 10.1038/nrn1009. [DOI] [PubMed] [Google Scholar]
- Tohka J, Zijdenbos A, Evans A. Fast and robust parameter estimation for statistical partial volume models in brain MRI. Neuroimage. 2004;23:84–97. doi: 10.1016/j.neuroimage.2004.05.007. [DOI] [PubMed] [Google Scholar]
- Tramo MJ, Loftus WC, Thomas CE, Green RL, Mott LA, Gazzaniga MS. Surface-Area of Human Cerebral-Cortex and Its Gross Morphological Subdivisions - in-Vivo Measurements in Monozygotic Twins Suggest Differential Hemisphere Effects of Genetic-Factors. Journal of Cognitive Neuroscience. 1995;7:292–302. doi: 10.1162/jocn.1995.7.2.292. [DOI] [PubMed] [Google Scholar]
- Wallace GL, Schmitt J Eric, Lenroot R, Viding E, Ordaz S, Rosenthal MA, Molloy EA, Clasen LS, Kendler KS, Neale MC, Giedd JN. A pediatric twin study of brain morphometry. J Child Psychol Psychiatry. 2006;47:987–993. doi: 10.1111/j.1469-7610.2006.01676.x. [DOI] [PubMed] [Google Scholar]
- Wechsler D. Wechsler Preschool and Primary Scale of Intelligence-Revised. The Psychological Corporation; San Antonio: 1989. [Google Scholar]
- Wilke M, Schmithorst VJ, Holland SK. Normative pediatric brain data for spatial normalization and segmentation differs from standard adult data. Magn Reson Med. 2003;50:749–757. doi: 10.1002/mrm.10606. [DOI] [PubMed] [Google Scholar]
- Witelson SF, Pallie W. Left hemisphere specialization for language in the newborn. Neuroanatomical evidence of asymmetry. Brain. 1973;96:641–646. doi: 10.1093/brain/96.3.641. [DOI] [PubMed] [Google Scholar]
- Wright IC, Sham P, Murray RM, Weinberger DR, Bullmore ET. Genetic contributions to regional variability in human brain structure: methods and preliminary results. Neuroimage. 2002;17:256–271. doi: 10.1006/nimg.2002.1163. [DOI] [PubMed] [Google Scholar]
- Yoon U, Lee JM, Im K, Shin YW, Cho BH, Kim IY, Kwon JS, Kim SI. Pattern classification using principal components of cortical thickness and its discriminative pattern in schizophrenia. Neuroimage. 2007;34:1405–1415. doi: 10.1016/j.neuroimage.2006.11.021. [DOI] [PubMed] [Google Scholar]
- Zijdenbos AP, Dawant BM. Brain segmentation and white matter lesion detection in MR images. Critical reviews in biomedical engineering. 1994;22:401–465. [PubMed] [Google Scholar]
- Zijdenbos AP, Forghani R, Evans AC. Automatic “pipeline” analysis of 3-D MRI data for clinical trials: application to multiple sclerosis. IEEE Trans Med Imaging. 2002;21:1280–1291. doi: 10.1109/TMI.2002.806283. [DOI] [PubMed] [Google Scholar]
Associated Data
This section collects any data citations, data availability statements, or supplementary materials included in this article.
Supplementary Materials
Supplement Figure 1. Lower and upper bounds of 95% confidence intervals for cross-twin correlation in cortical thickness at the level of vertex in cortical hemispheric surface. (LCI: lower bounds of confidence interval; UCI: upper bounds of. confidence interval)
Supplement Figure 2. Lower and upper bounds of 95% confidence intervals for estimates of genetic and environmental influences at each vertex. (LCI: lower bounds of confidence interval; UCI: upper bounds of confidence interval)
Supplement Figure 3. Estimates of genetic and environmental influences at each vertex for right-handed twin pairs. Color bar displays the scale of proportional variance value.