

Abstract
Plants flower in particular seasons even in natural, fluctuating environments. The molecular basis of temperature-dependent flowering-time regulation has been extensively studied, but little is known about how gene expression is controlled in natural environments. Without a memory of past temperatures, it would be difficult for plants to detect seasons in natural, noisy environments because temperature changes occurring within a few weeks are often inconsistent with seasonal trends. Our 2-y census of the expression of a temperature-dependent flowering-time gene, AhgFLC, in a natural population of perennial Arabidopsis halleri revealed that the regulatory system of this flowering-time gene extracts seasonal cues as if it memorizes temperatures over the past 6 wk. Time-series analysis revealed that as much as 83% of the variation in the AhgFLC expression is explained solely by the temperature for the previous 6 wk, but not by the temperatures over shorter or longer periods. The accuracy of our model in predicting the gene expression pattern under contrasting temperature regimes in the transplant experiments indicates that such modeling incorporating the molecular bases of flowering-time regulation will contribute to predicting plant responses to future climate changes.
Keywords: Arabidopsis halleri, FLOWERING LOCUS C, gene regulation, natural temperature fluctuation, plant phenology modeling
A unique paradigm that has arisen from a systems biological approach is that gene regulation under a fluctuating environment is significantly different to that seen under constant laboratory conditions (1). This was recently shown for the flowering phenotypes of Arabidopsis mutants grown in natural environments (2). Many genes are involved in flowering-time control (3–5), but little is known about how these genes function in nature (1). Plants flower at particular times of the year using environmental cues to detect seasons (6), and flowering with other timing often decreases reproductive success substantially (7, 8). Because genetic systems, such as flowering time control, operate in natural habitats, a full understanding of gene function requires the study of gene regulation in complex environments.
Temperature is a major seasonal cue by which plants determine when to flower. In natural conditions, temperature shows day/night, day-by-day, and weekly fluctuations that are often inconsistent with the seasonal trends. Plants, however, control flowering time precisely even in the noisy natural environment. We expected, therefore, that plants would have a gene regulatory system that is characterized by a memory of past temperatures, and this memory should be long enough to buffer shorter-term temperature fluctuations, but short enough to be sensitive to the seasonal temperature trend.
In the MADS-box gene family of Arabidopsis thaliana, genes belonging to a monophyletic clade, including the FLOWERING LOCUS C (FLC) and MADS AFFECTING FLOWERING (MAF) gene subfamily, have been found to encode transcription factors that regulate flowering time in response to temperature change (9). FLC represses flowering by down-regulating the floral pathway integrators, SUPPRESSOR OF OVEREXPRESSION OF CO 1 (SOC1) and FLOWERING LOCUS T (FT) (10, 11). The FLC expression is down-regulated in response to prolonged cold (vernalization), and this response ensures that flowering occurs after winter (12–14). MAF2 is probably involved in the vernalization response to short periods of cold within 3 wk, and the role of other MAF genes remains to be determined (15). In the perennial life cycle, PERPETUAL FLOWERING 1 (PEP1), an FLC ortholog of Arabis alpina, controls flowering transition by being down-regulated in response to prolonged cold, and the reverse transition by being up-regulated in response to a warm temperature after cold (16). We expected that the gene regulation of FLC orthologs may serve as the mechanism to extract seasonal cues from natural environments, because they are regulated by histone modification (17–19), which is often involved in stable cellular memory (20, 21).
Herein we report on a 2-y census on the gene expression of an FLC ortholog AhgFLC in a natural population of perennial Arabidopsis halleri subsp. gemmifera (referred as to A. halleri hereafter) in central Honshu, Japan (Fig. S1). The aim of this study was to evaluate how AhgFLC is regulated during natural temperature fluctuations—specifically, for how long the gene regulatory system holds the memory of past temperatures to detect seasons.
Results
Characterization of AhgFLC.
An AhgFLC full-length cDNA sequence showed 95.9% and 94.9% identity in nucleotide and amino acid sequences, respectively, with A. thaliana FLC (Fig. S2, Table S1). AhgFLC formed a clade with A. thaliana FLC and other FLC orthologs of related Brassicaceae in a neighbor-joining cladogram, and A. thaliana MAF genes formed a distinct clade (Fig. 1A and SI Materials and Methods). Arabidopsis halleri showed vernalization responses to 4 wk or longer cold treatment, which promoted flowering and suppressed the AhgFLC expression (Fig. S3). Furthermore, a strong delay in flowering was observed in transgenic A. thaliana in which AhgFLC was constitutively expressed (Fig. 1 B and C). These findings suggest that AhgFLC is an ortholog of FLC.
Fig. 1.

Sequence analysis and transformation experiments of AhgFLC. (A) AhgFLC forms a clade with A. thaliana FLC (FLC) in a neighbor-joining cladogram including FLC homologs of related plants in Brassicaceae. AaFLC, BnFLC, RsFLC, SaFLC, ThFLC, and PEP1 represent Arabidopsis arenosa, Brassica napus, Raphanus sativus, Sinapis alba, Thellungiella halophila, and Arabis alpina homologs of FLC, respectively. The percentage of replicate trees in which the associated taxa clustered together in the bootstrap test (1,000 replicates) are shown above nodes, and branch lengths are proportional to the nucleotide substitution rate. (B) Strong delay in flowering was observed for transgenic plants in which AhgFLC was constitutively expressed in A. thaliana. Phenotypes of 7-wk-old transgenic T1 A. thaliana (Col) expressing FLC and AhgFLC are shown from left to right: 35S::FLCCol, 35S::AhgFLCOMO, 35S::AhgFLCINA, and nontransgenic wild-type plant. AhgFLCOMO and AhgFLCINA were obtained from different individuals of A. halleri. (C) Number of rosette leaves of the transgenic plants and wild type at flowering (mean and SD). The numbers above the bars are the total number of plants tested together with the number of nonflowered plants in parentheses. The number of leaves of nonflowered plants was set as 30 in the mean calculation because all nonflowered plants had more than 30 leaves at the end of the growth experiments. Asterisks indicate significant differences in the number of leaves as compared with that of the wild type (Wilcoxon rank-sum test; *P < 0.05; **P < 0.001).
Seasonal Pattern of AhgFLC Expression in a Natural Environment.
We quantified the expression of AhgFLC in a natural population of A. halleri for ~2 y by visiting the field site 96 times at ~1-wk intervals. At every visit, the AhgFLC expression level in the leaves of six plants was measured by real-time quantitative PCR and then quantified relative to the level for a standard sample obtained from a 6-wk cold-treated plant. The AhgFLC expression showed a clear seasonal pattern in both years (Fig. 2A). We observed strong winter repression, with the average levels of maximally suppressed AhgFLC being 1–3% of those of the 6-wk cold-treated standard and less than 0.03% of those of the yearly maximum (Fig. 2A). Notably, the decreases and increases of AhgFLC expression occurred slowly over multiple weeks following the long-term seasonal trends of temperature change. The diurnal variation of AhgFLC expression was much smaller compared with the seasonal variation, and the minimum expression levels within 48 h were about 20% of the maximum values for the two measurement periods at the vernal and autumnal equinoxes (Fig. S4).
Fig. 2.

Expression of AhgFLC in the natural habitat shows a seasonal pattern that corresponds with plant phenology. (A) Seasonal pattern of the AhgFLC expression in leaves (solid line and circles, mean ± SD, n = 6) measured at ~1-wk intervals for 2 y. The thin line indicates daily mean air temperature, and photoperiods are shown by the shading. (B) Phenology of the study population. The number of plants per day that initiated bolting, flower opening, and inflorescence reversion, respectively, between the two successive censuses are shown. (C) Infloresence reversion, i.e., leaf formation at the reproductive shoot-apical meristem. (D) The expression of AhgAP1 in shoot apical meristems corresponded to plant phenology. The AhgAP1 was expressed throughout the period from bolting to flower opening in the apical meristems [left three lanes; meristem tissues of plants at bolting (Bo) in February and March, and at flowering (Fl) in April]. In May, AhgAP1 RNA was present in the meristems of flower-producing inflorescences but absent in the meristems of reverted inflorescences [fourth and fifth lanes; meristem tissues at inflorescence reversion (Re) and flowering (Fl) in May, respectively]. The expression of AhgAP1 was not detected in the meristem of vegetative rosettes [sixth lane; meristem tissue at the rosette stage (Ro) in September]. AhgACTIN2 was used as a loading control. The GenBank accession number for the AhgAP1 cDNA sequence is AB465587.
Phenological transitions corresponded with the expression levels of AhgFLC (Fig. 2 A and B). We recorded the timing of bolting (elongation of the flowering stem, the earliest morphological sign of flowering) and flower opening of 160 naturally growing plants. We also observed the reverse transition from reproductive to vegetative growth by recording the timing of inflorescence reversion, in which leaf formation occurs at the apical meristem after inflorescence development (Fig. 2C). The average AhgFLC expression levels at the peaks of bolting were low, 0.085 and 0.071 in 2007 and 2008, respectively, and they remained low until the end of March in both years (Fig. 2 A and B). By the beginning of the reverse transition to vegetative growth, the AhgFLC expression levels increased to nearly the prewinter levels (Fig. 2 A and B). The gross morphology of meristems in the phenology observations corresponded with the expression of AhgAP1, a homolog of the reporter gene for identifying floral meristem APETALA1 (22). The expression of AhgAP1 was observed at meristem at least during bolting and flowering, and the timing of its suppression corresponded with that of reverse transition (Fig. 2D).
Time-Series Analyses of the AhgFLC Expression.
We applied three chilling-unit models that are commonly used to predict plant phenology (23) to analyze the relationship between the AhgFLC expression and temperature in the natural habitat. First, we developed a chilling accumulation model in which the AhgFLC expression levels are assumed to be determined by the cumulative sum of temperatures lower than a certain threshold (T) over a past given period (L). Using the maximum likelihood method, we estimated L and T (Fig. 3A). The results showed that the level of the AhgFLC expression was best explained by the temperature regime over the previous 42 d [95% confidence interval (CI): 39–45 d], with a threshold temperature of 10.5 °C (95% CI: 9.7 °C–11.1 °C). Surprisingly, the proposed model explained as much as 83% of the variation in the AhgFLC expression level (Fig. 3B). The log likelihood was more sensitive to the change in L than to that of T (Fig. 3A), implying that the length of the period during which past temperature was assumed to determine the current AhgFLC expression was a more influential factor. We also tested two other models, chilling hour and exponential decay models. Instead of cumulative sum of temperature below the threshold, the chilling-hour model used the cumulative sum of hours, and the exponential decay model incorporated a decay factor by which the effect of past temperature was diminished. All three models explained ≈80% of the variation in AhgFLC expression solely by temperature if we assume that the expression level is determined by the temperature of the past ~6 wk (Table S2). The analyses using the hourly air temperature at the nearest meteorological station and the hourly ground-surface temperatures at the study site showed similar results (Table S2).
Fig. 3.

Time-series analyses revealed that seasonal variation in the AhgFLC expression is mostly explained by temperature during the past ~6 wk. (A) 3D surface plot of log likelihood function of T (base temperature) and L (length of period) in the chilling accumulation model. As indicated by the peak of the surface (the maximum likelihood), the level of AhgFLC was best explained by the temperature regime over the past 42 d with a base temperature of 10.5 °C. (B) The relative expression of AhgFLC as a function of the cumulative sum of chilling units with the maximum likelihood estimates (L = 42 d and T = 10.5 °C). The model explained most of the variation of AhgFLC (adjusted R2 = 0.83). Log-transformed variables were used for the relative expression of AhgFLC. The line represents the linear regression, which has an intercept of 1.58 (SE = 2.8 × 10⁻², P < 0.001) and a slope of −4.1 × 10⁻⁴ (SE = 8.0 × 10⁻⁶, P < 0.001).
Transplant Experiments with Controlled Temperature Conditions.
To evaluate the predictions of the model, we conducted a set of transplant experiments and compared the predicted and observed AhgFLC expression levels. Field-grown plants were transplanted into two laboratory controlled conditions, i.e., 20 °C/15 °C and 4 °C/4 °C (day/night temperature for a 12-h day length), and the temporal changes in the AhgFLC expression were measured for the next 3 mo. When plants were transplanted before the decrease in the AhgFLC expression (November 12, 2007), the AhgFLC expression level in the transplants gradually decreased at 4 °C/4 °C but remained high at 20 °C/15 °C (Fig. 4A). When plants were transplanted before the increase in the AhgFLC expression (February 19, 2007), the AhgFLC expression level in the transplants gradually increased at 20 °C/15 °C but remained to be suppressed at 4 °C/4 °C (Fig. 4B). The observed changes in the AhgFLC expression level were mostly consistent with the model predictions, but the decrease of the AhgFLC expression continued for ~9 wk in the November transplants (Fig. 4 A and B).
Fig. 4.

Changes in AhgFLC expression in the transplant experiments and the model predictions. Plants with high (A) and low (B) AhgFLC expression were transplanted into the two controlled conditions (20 °C/15 °C and 4 °C/4 °C, day/night temperatures) in November and February, respectively. AhgFLC expressions (mean ± SD, n = 6) are shown by closed and open circles for the 20 °C/15 °C and 4 °C/4 °C conditions, respectively. The predictions based on the chilling accumulation model are shown by solid and dashed lines for 20 °C/15 °C and 4 °C/4 °C, respectively.
Semiquantitative Reverse-Transcription PCR for Putative Vernalization Genes.
The seasonal expression was further examined for genes homologous to those involved in the vernalization response of A. thaliana. The seasonal changes of expression of these genes occurred during winter and successive flowering periods, and the expression states after the reverse transition returned to the prewinter state (Fig. 5). The expression of AhgSOC1, a homolog of FLC-downstream flowering activator, corresponded quantitatively with the repression of AghFLC (Fig. 5). Although weak signals of AhgFT, another homolog of FLC-downstream flowering activator, were present in February and March, a strong expression was observed after the photoperiods became longer in April (Fig. 5). Thereafter, the AhgFT expression was repressed and corresponded with a high expression of AhgFLC (Fig. 5). AhgVIN3, a homolog of the VERNALIZATION INSENSITIVE3 (VIN3) required for the initial repression of FLC (24), was expressed during the months of low temperatures, and a high expression corresponded with the period of continual decline in the AhgFLC expression (Fig. 5). AhgLHP1, a homolog of LIKE HETEROCHROMATIN PROTEIN1 (LHP1) required for the maintenance of the FLC repression (25, 26), was expressed year-round. An increase of AhgVRN2, a homolog of VERNALIZATION 2 (VRN2) whose product is known to constitutively associate with the H3K27me3 sites of the FLC locus (17, 19, 27), was observed corresponding with the repression of AhgFLC (Fig. 5).
Fig. 5.

Semiquantitative RT-PCR analyses of seasonal expression patterns of AhgFLC, AhgSOC1, AhgFT, AhgVIN3, AhgLHP1, and AhgVRN2 in leaves. These genes are A. halleri homologs (95% or greater sequence homology) of the corresponding A. thaliana genes, which are involved in the vernalization response. The GenBank accession numbers for the AhgFLC, AhgSOC1, AhgFT, AhgVIN3, AhgLHP1, and AhgVRN2 cDNA sequences are AB465585, AB465588, AB465586, AB465590, AB465589, and AB465591, respectively.
Discussion
Our findings suggest that Arabidopsis halleri plants detect the seasonal trend of temperature at the level of gene regulation. The memory and buffering functions of AhgFLC that were revealed to last for ~6 wk are likely to act as a filter to extract the seasonal cue from the noisy natural environment. FLC is regulated by PcG protein-mediated gene repression through histone modification (17–19), which is known to be a stable gene regulation involved in many kinds of cellular memory (20, 21). Repression of the FLC is stable after cold in A. thaliana (14, 28), and this is shown to be maintained at the FLC locus by H3K27me3, a universal repressive histone mark (19). PEP1, an FLC ortholog of perennial Arabis alpina, is up-regulated in response to warm temperature, and H3K27me3 at PEP1 is not maintained after cold (16). These mechanisms for the FLC and PEP1 regulations led us to expect that a similar mechanism might provide the functions of AhgFLC as a memory and a buffer.
The natural level of the AhgFLC expression was strongly correlated with the seasonal trend of past temperatures in a dosage-dependent manner. We therefore consider that AhgFLC provides not merely a memory of winter but a quantitative memory throughout the year. Although the underlying mechanism is currently unknown, the involvement of a quantitative regulation throughout a relative balance of repressive and active histone marks has been suggested by the A. thaliana FLC regulation (29, 30). Our model analyses estimated that temperatures during the previous ~6 wk determined the level of AhgFLC expression, but down-regulation of AhgFLC continued over 6 wk when plants were moved to cold temperatures in November in the transplant experiments. This may be an indication that periods of past temperature that affect the AhgFLC expression is longer in the down-regulation in comparison with the up-regulation processes. The additional analyses using half-year data during up- and down-regulation periods of AhgFLC estimated L as ~20 and 60 d, respectively, although these models did not improve the predictions for the transplant experiment results (Table S2).
The AhgFLC expression level in natural conditions was correlated not only with bolting time, but also with the timing of inflorescence reversion. The seasonal regulation of AhgFLC is therefore likely to serve as a robust mechanism that controls both the initiation and termination of flowering in the noisy natural environment. The results of AhgFLC characterization suggest that AhgFLC is the flowering repressor of A. halleri, but to fully substantiate this we require further genetic or transgenic evidence from the study species. PEP1 has been genetically proven to limit the duration of perennial Arabis alpina flowering and facilitates a return to vegetative growth (16). Although reversible regulation of flowering repressors is a necessity for perennial life-cycles (16), it means that the warm temperature required for reproductive growth after cold also up-regulates the flowering repressor. In A. halleri, the combination of strong winter repression and a gradual increment in the AhgFLC expression are likely to provide the time window during which flowering takes place. At the lowest level, the natural AhgFLC expression was repressed much more markedly than in the standard plant that was experimentally treated for 6 wk in the cold. The situation is in contrast with that of A. thaliana FLC, in which stable repression after cold allowed flowering to occur in successive warm temperatures (14, 28). However, some northern lines are known to show reversibility in the FLC repression (29).
The putative homologs of downstream genes also showed seasonal patterns that corresponded to the flowering phenology of A. halleri. In natural conditions, repression of AhgFLC and the rise of AhgSOC1 start in December under the shortest day-lengths, followed by AhgAP1 expression at the meristem and bolting in February and March. Weak AhgFT signals were present at bolting, although the strong AhgFT expression occurred much later, corresponding with a 12-h or longer day-length in April. The AhgFT expression ceased in late May, corresponding with the inflorescence reversion and a spring increase of AhgFLC, notwithstanding that the plants were subjected to the longest photoperiods. In A. thaliana, FLC acts as an inhibitor of SOC1 and FT (10, 11), but the repression of FLC is not sufficient to activate SOC1 and FT (31, 32). SOC1 is activated by a gibberellin-dependent pathway under a short day (32) and by a photoperiod-dependent pathway under a long day (33, 34). FT activation depends strongly on the photoperiod (31). The observed expression patterns of A. halleri homologs may represent the temporal shift of relative importance of different pathways in controlling flowering phenology under seasonal environments.
In the phenological modeling of plants, a “chilling requirement” is often incorporated to predict flowering and budburst (23). A major problem with these models has been the lack of direct measurement of the developmental state of plants during the cold (23). Our study indicates that gene expression data can serve as such measurements and give a mechanistic explanation as to why these models predict plant phenology. Although our study is one of few examples of the measurement of temporal changes in gene expression under natural conditions (1), such approaches will become increasingly important in the prediction of plant responses to future climate change in diverse ecosystems.
Materials and Methods
Some details not included here, as well as primer information (Table S1), appear in SI Materials and Methods.
Study Site.
The plant population (35°06' N, 134°55' E, altitude 190–230 m) occurs on an open site alongside a small stream that runs through secondary forest (Fig. S1). Thousands of A. halleri plants continually grow in a habitat that extends for ~400 m along the stream. At the study site, we monitored the AhgFLC expression, plant phenology, and the ground-surface temperatures during the study period. Temperature records were also obtained from the nearest meteorological station (Nishiwaki, 35°00'N, 134°59.9'E, altitude 72 m, Japan Meteorological Agency). Average temperatures during the study period (n = 19,464) were 15.77 °C and 15.57 °C for the hourly ground-surface temperature at the study site and the hourly air temperature at the meteorological station, respectively, and Pearson's correlation coefficient between them was 0.966.
AhgFLC Expression Quantification.
In a natural population of A. halleri, we quantified the expression of AhgFLC for ~2 y from September 19, 2006, to August 11, 2008, at ~1-wk intervals. Six large plants with multiple clonal rosettes were selected to conduct multiple sampling on the same individuals. A young leaf that reached to ~10 mm in length was collected from each plant on the sampling date. Total RNA from 5 to 10 mg of leaf tissue was extracted using an RNeasy Plant Mini Kit (Qiagen). The AhgFLC expression was quantified by 7300 Real-Time PCR System (Applied Biosystems).
Time-Series Analyses.
We developed three chilling unit (CU) models to explain y(t), log (AhgFLC expression level) at time t, based on x(t), a function of the past temperature regime designated in each model. In the chilling accumulation model, a CU is defined as 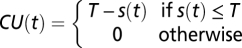 , where T is base (threshold) temperature and s(t) is temperature during hour t. y(t) is assumed to depend on the cumulative sum of CU over a certain period (L days) before the measurement,
 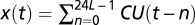 . y(t) was regressed using a linear function of ax(t) + b, where a and b are regression coefficients.
In the chilling-hour model, a chilling unit is simply defined as 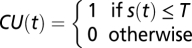 . This model assumes that the effect of temperature is proportional only to the time period as long as it is lower than the threshold.
In the exponential decay model, the definition of CU was same with that in the chilling accumulation model, but x(t) was calculated as  . This model assumes that y(t) is influenced by temperature in the recent past with a decay parameter, α. The confidence interval of the parameters was calculated by the bootstrapping method. For these analyses, the data from the six individuals were pooled.
Transplant Experiments.
Six plants from the field site were transferred to each of the 20 °C/15 °C and the 4 °C conditions. AhgFLC was quantified just before the transplantation and periodically at 7- to 39-d intervals for ~3 mo after the transplantation. Predictions from the chilling accumulation model (L = 42, T = 10.5) were calculated based on the temperatures experienced by the transplants.
Supplementary Material
Acknowledgments
We thank U. Grossniklaus, R. Shimizu-Inatsugi, T. Kakutani, T. Araki, T. Kawagoe, T. Kubo, E. Nakajima, M. Purugganan, S. Sawa, J. Sugisaka, and T. Tsuchimatsu for their valuable suggestions during the data analyses and manuscript preparation. This study was supported by Grants-in-Aid from the Ministry of Education, Culture, Sports, Science and Technology (MEXT), Japan; PRESTO; Swiss National Foundation; SystemsX.ch; University of Zurich; and the Global COE Program A06 of Kyoto University.
Footnotes
The authors declare no conflict of interest.
*This Direct Submission article had a prearranged editor.
Data deposition: The cDNA sequences reported in this paper, AhgFLC, AhgFT, AhgAP1, AhgSOC1, AhgLHP1, AhgVIN3, and AhgVRN2 have been deposited in the GenBank database (accession nos. AB465585, AB465586, AB465587, AB465588, AB465589, AB465590, and AB465591, respectively).
This article contains supporting information online at www.pnas.org/lookup/suppl/doi:10.1073/pnas.0914293107/-/DCSupplemental.
References
- 1.Richards CL, et al. Perspective on ecological and evolutionary systems biology. Annu Plant Rev. 2009;35:331–351. [Google Scholar]
- 2.Wilczek AM, et al. Effects of genetic perturbation on seasonal life history plasticity. Science. 2009;323:930–934. doi: 10.1126/science.1165826. [DOI] [PubMed] [Google Scholar]
- 3.Simpson GG, Dean C. Arabidopsis, the Rosetta stone of flowering time? Science. 2002;296:285–289. doi: 10.1126/science.296.5566.285. [DOI] [PubMed] [Google Scholar]
- 4.Yanovsky MJ, Kay SA. Living by the calendar: How plants know when to flower. Nat Rev Mol Cell Biol. 2003;4:265–275. doi: 10.1038/nrm1077. [DOI] [PubMed] [Google Scholar]
- 5.He YH, Amasino RM. Role of chromatin modification in flowering-time control. Trends Plant Sci. 2005;10:30–35. doi: 10.1016/j.tplants.2004.11.003. [DOI] [PubMed] [Google Scholar]
- 6.Salisbury FB. The Flowering Process. Oxford: Pergamon; 1963. [Google Scholar]
- 7.Franks SJ, Sim S, Weis AE. Rapid evolution of flowering time by an annual plant in response to a climate fluctuation. Proc Natl Acad Sci USA. 2007;104:1278–1282. doi: 10.1073/pnas.0608379104. [DOI] [PMC free article] [PubMed] [Google Scholar]
- 8.Elzinga JA, et al. Time after time: Flowering phenology and biotic interactions. Trends Ecol Evol. 2007;22:432–439. doi: 10.1016/j.tree.2007.05.006. [DOI] [PubMed] [Google Scholar]
- 9.Alvarez-Buylla ER, et al. An ancestral MADS-box gene duplication occurred before the divergence of plants and animals. Proc Natl Acad Sci USA. 2000;97:5328–5333. doi: 10.1073/pnas.97.10.5328. [DOI] [PMC free article] [PubMed] [Google Scholar]
- 10.Lee H, et al. The AGAMOUS-LIKE 20 MADS domain protein integrates floral inductive pathways in Arabidopsis. Genes Dev. 2000;14:2366–2376. doi: 10.1101/gad.813600. [DOI] [PMC free article] [PubMed] [Google Scholar]
- 11.Michaels SD, Himelblau E, Kim SY, Schomburg FM, Amasino RM. Integration of flowering signals in winter-annual Arabidopsis. Plant Physiol. 2005;137:149–156. doi: 10.1104/pp.104.052811. [DOI] [PMC free article] [PubMed] [Google Scholar]
- 12.Michaels SD, Amasino RM. FLOWERING LOCUS C encodes a novel MADS domain protein that acts as a repressor of flowering. Plant Cell. 1999;11:949–956. doi: 10.1105/tpc.11.5.949. [DOI] [PMC free article] [PubMed] [Google Scholar]
- 13.Sheldon CC, et al. The FLF MADS box gene: A repressor of flowering in Arabidopsis regulated by vernalization and methylation. Plant Cell. 1999;11:445–458. doi: 10.1105/tpc.11.3.445. [DOI] [PMC free article] [PubMed] [Google Scholar]
- 14.Sheldon CC, Rouse DT, Finnegan EJ, Peacock WJ, Dennis ES. The molecular basis of vernalization: The central role of FLOWERING LOCUS C (FLC) Proc Natl Acad Sci USA. 2000;97:3753–3758. doi: 10.1073/pnas.060023597. [DOI] [PMC free article] [PubMed] [Google Scholar]
- 15.Ratcliffe OJ, Kumimoto RW, Wong BJ, Riechmann JL. Analysis of the Arabidopsis MADS AFFECTING FLOWERING gene family: MAF2 prevents vernalization by short periods of cold. Plant Cell. 2003;15:1159–1169. doi: 10.1105/tpc.009506. [DOI] [PMC free article] [PubMed] [Google Scholar]
- 16.Wang R, et al. PEP1 regulates perennial flowering in Arabis alpina. Nature. 2009;459:423–427. doi: 10.1038/nature07988. [DOI] [PubMed] [Google Scholar]
- 17.Bastow R, et al. Vernalization requires epigenetic silencing of FLC by histone methylation. Nature. 2004;427:164–167. doi: 10.1038/nature02269. [DOI] [PubMed] [Google Scholar]
- 18.Schmitz RJ, Sung S, Amasino RM. Histone arginine methylation is required for vernalization-induced epigenetic silencing of FLC in winter-annual Arabidopsis thaliana. Proc Natl Acad Sci USA. 2008;105:411–416. doi: 10.1073/pnas.0710423104. [DOI] [PMC free article] [PubMed] [Google Scholar]
- 19.De Lucia F, Crevillen P, Jones AME, Greb T, Dean C. A PHD-polycomb repressive complex 2 triggers the epigenetic silencing of FLC during vernalization. Proc Natl Acad Sci USA. 2008;105:16831–16836. doi: 10.1073/pnas.0808687105. [DOI] [PMC free article] [PubMed] [Google Scholar]
- 20.Hsieh TF, Hakim O, Ohad N, Fischer RL. From flour to flower: How Polycomb group proteins influence multiple aspects of plant development. Trends Plant Sci. 2003;8:439–445. doi: 10.1016/S1360-1385(03)00189-4. [DOI] [PubMed] [Google Scholar]
- 21.Schwartz YB, Pirrotta V. Polycomb silencing mechanisms and the management of genomic programmes. Nat Rev Genet. 2007;8:9–22. doi: 10.1038/nrg1981. [DOI] [PubMed] [Google Scholar]
- 22.Mandel MA, Yanofsky MF. A gene triggering flower formation in Arabidopsis. Nature. 1995;377:522–524. doi: 10.1038/377522a0. [DOI] [PubMed] [Google Scholar]
- 23.Chuine I, Kramer K, Hänninen H. In: Phenology: An Integrative Environmental Science. Schwartz MD, editor. Dordrecht: Kluwer; 2003. pp. 217–235. [Google Scholar]
- 24.Sung S, Amasino RM. Vernalization in Arabidopsis thaliana is mediated by the PHD finger protein VIN3. Nature. 2004;427:159–164. doi: 10.1038/nature02195. [DOI] [PubMed] [Google Scholar]
- 25.Mylne JS, et al. LHP1, the Arabidopsis homologue of HETEROCHROMATIN PROTEIN1, is required for epigenetic silencing of FLC. Proc Natl Acad Sci USA. 2006;103:5012–5017. doi: 10.1073/pnas.0507427103. [DOI] [PMC free article] [PubMed] [Google Scholar]
- 26.Sung S, et al. Epigenetic maintenance of the vernalized state in Arabidopsis thaliana requires LIKE HETEROCHROMATIN PROTEIN 1. Nat Genet. 2006;38:706–710. doi: 10.1038/ng1795. [DOI] [PubMed] [Google Scholar]
- 27.Gendall AR, Levy YY, Wilson A, Dean C. The VERNALIZATION 2 gene mediates the epigenetic regulation of vernalization in Arabidopsis. Cell. 2001;107:525–535. doi: 10.1016/s0092-8674(01)00573-6. [DOI] [PubMed] [Google Scholar]
- 28.Sheldon CC, et al. Resetting of FLOWERING LOCUS C expression after epigenetic repression by vernalization. Proc Natl Acad Sci USA. 2008;105:2214–2219. doi: 10.1073/pnas.0711453105. [DOI] [PMC free article] [PubMed] [Google Scholar]
- 29.Shindo C, Lister C, Crevillen P, Nordborg M, Dean C. Variation in the epigenetic silencing of FLC contributes to natural variation in Arabidopsis vernalization response. Genes Dev. 2006;20:3079–3083. doi: 10.1101/gad.405306. [DOI] [PMC free article] [PubMed] [Google Scholar]
- 30.Pien S, et al. ARABIDOPSIS TRITHORAX1 dynamically regulates FLOWERING LOCUS C activation via histone 3 lysine 4 trimethylation. Plant Cell. 2008;20:580–588. doi: 10.1105/tpc.108.058172. [DOI] [PMC free article] [PubMed] [Google Scholar]
- 31.Wigge PA, et al. Integration of spatial and temporal information during floral induction in Arabidopsis. Science. 2005;309:1056–1059. doi: 10.1126/science.1114358. [DOI] [PubMed] [Google Scholar]
- 32.Moon J, et al. The SOC1 MADS-box gene integrates vernalization and gibberellin signals for flowering in Arabidopsis. Plant J. 2003;35:613–623. doi: 10.1046/j.1365-313x.2003.01833.x. [DOI] [PubMed] [Google Scholar]
- 33.Hepworth SR, Valverde F, Ravenscroft D, Mouradov A, Coupland G. Antagonistic regulation of flowering-time gene SOC1 by CONSTANS and FLC via separate promoter motifs. EMBO J. 2002;21:4327–4337. doi: 10.1093/emboj/cdf432. [DOI] [PMC free article] [PubMed] [Google Scholar]
- 34.Yoo SK, et al. CONSTANS activates SUPPRESSOR OF OVEREXPRESSION OF CONSTANS 1 through FLOWERING LOCUS T to promote flowering in Arabidopsis. Plant Physiol. 2005;139:770–778. doi: 10.1104/pp.105.066928. [DOI] [PMC free article] [PubMed] [Google Scholar]
Associated Data
This section collects any data citations, data availability statements, or supplementary materials included in this article.